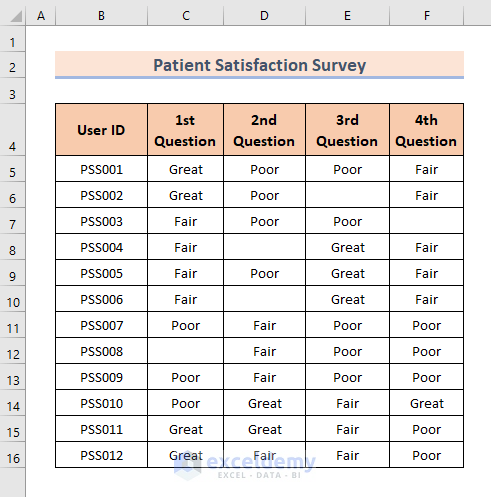
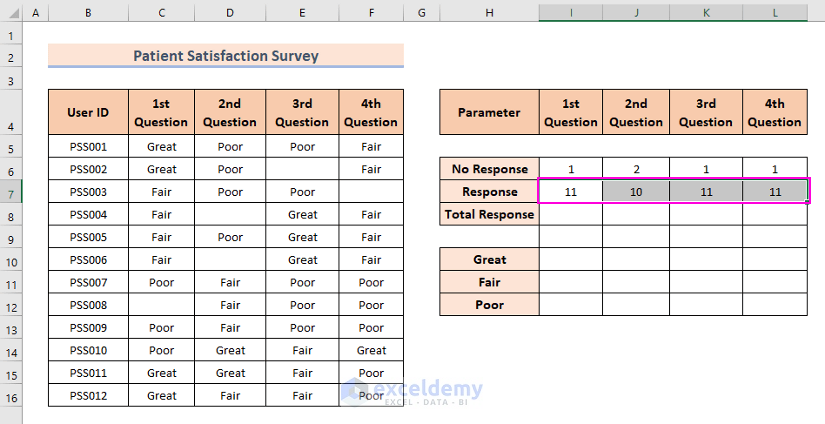
In the following Patient Satisfaction Survey, you can see some survey questions and their corresponding feedback. All the feedback is recorded against the User IDs. The feedback is categorized as Great, Fair, and Poor. The questions that didn’t get any feedback are left blank. We will use this survey result to show you how to tally them.
Step 1 – Count All Feedback to Tally Survey Results
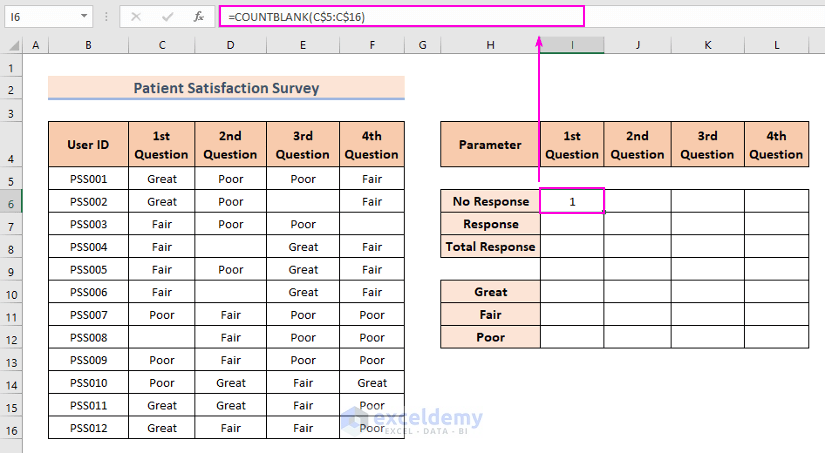
Case 1.1 – Counting Empty Responses
- Insert the following formula in I6 and press Enter to apply it:
=COUNTBLANK(C$5:C$16)Formula Breakdown
Here, the range C$5:C$16 is the range of the 1st Question column. In the range, only the row numbers are locked. Thus, when you drag the formula to the right, only the column number changes but the rows.
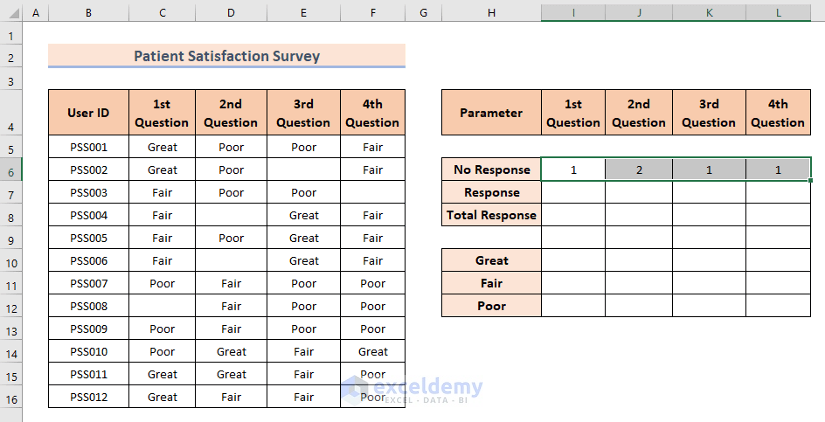
- Drag the bottom-right corner of cell I6 until cell L6 to copy the formula.
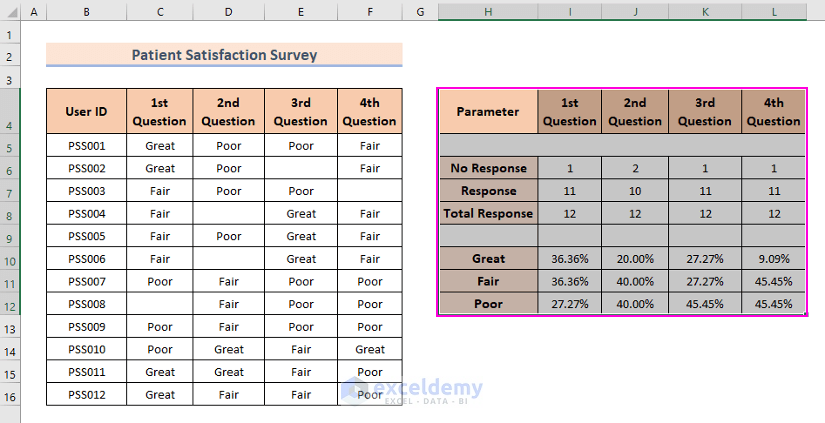
- You will see the total number of empty responses against all the questions.
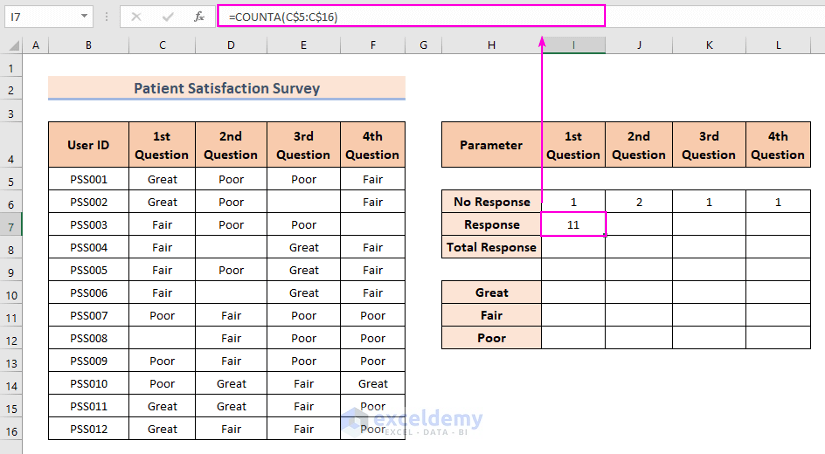
Case 1.2 – Counting Non-Empty Response
- Insert the following formula in cell I7 and press Enter.
=COUNTA(C$5:C$16)Formula Breakdown
Here, the range C$5:C$16 is the range of the 1st Question column. In the range, only the row numbers are locked. Thus, when you drag the formula to the right, only the column number changes but the rows.
- Drag the bottom-right corner of cell I7 to cell L7 to copy the formula.
- You will see the total number of non-empty responses against all the questions.
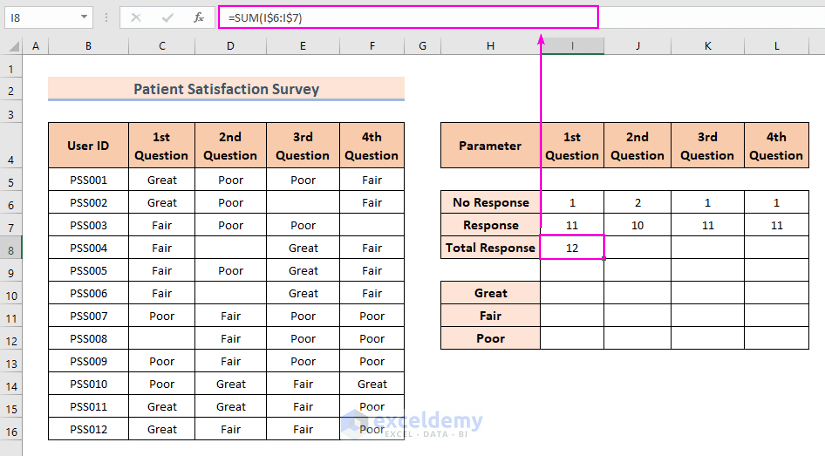
Case 1.3 – Count Total Number of Responses
- Copy the following formula in cell I8 and hit Enter.
=SUM(I$6:I$7)Formula Breakdown
Here, the range I$6:I$7 includes the count value of empty and non-empty responses. In the range, only the row numbers are locked. Thus, when you drag the formula to the right, only the column number changes but the rows.
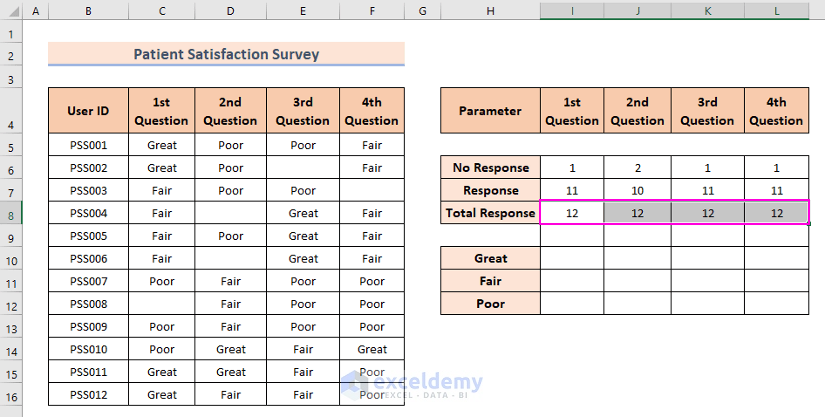
- Drag the bottom-right corner of cell I8 to cell L8.
- You will see the total number of responses to all the questions.
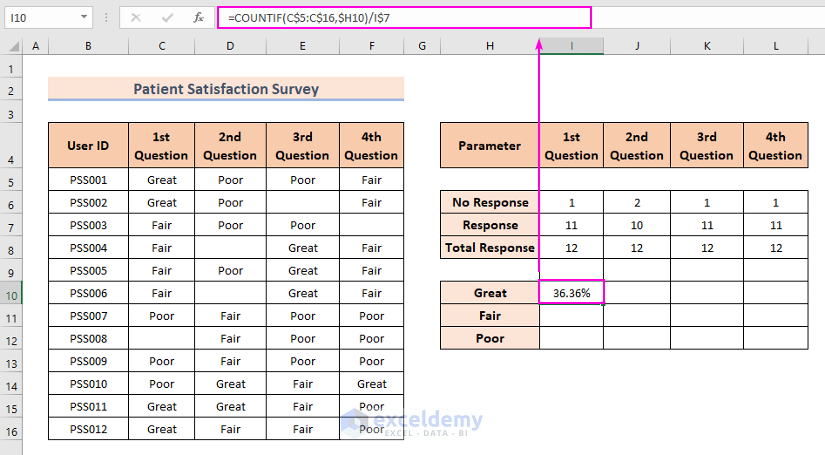
Step 2 – Calculate Feedback Percentages to Tally Survey Results
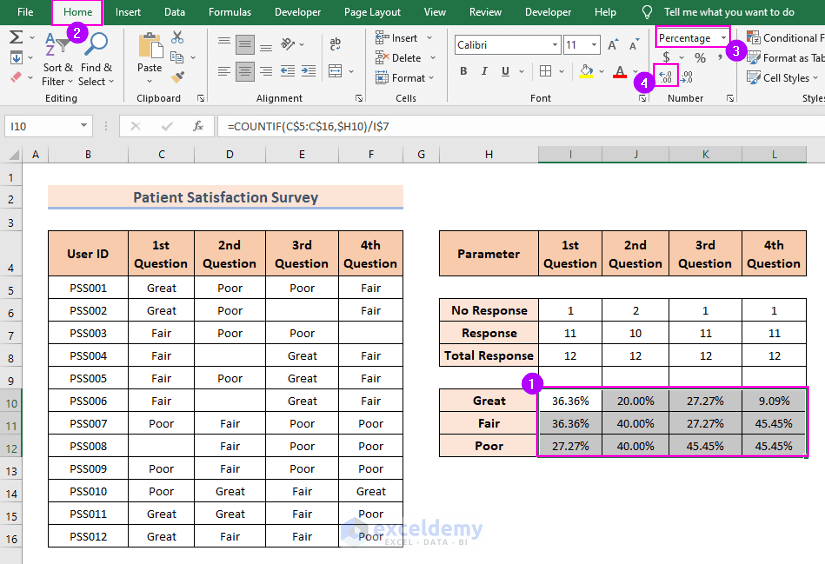
- Insert the following formula in cell I10. This formula will calculate the percentages of Great, Fair, Poor:
=COUNTIF(C$5:C$16,$H10)/I$7Formula Breakdown
- C$5:C$16: Here, the range C$5:C$16 is the range of the 1st Question In the range only the row numbers are locked. Thus, when you drag the formula to the right, only the column number changes but the rows.
- $H10: It refers to feedback, “Great”. Thus, the formula only counts the feedback that is “Great”. Dollar Sign ($) before the column number locks the column to H. I locked only the column because feedback is available only in the range H10:H12.
- I$7: It refers to the total non-empty response. Here, I locked only the row number because the number of total non-empty responses is only available in the range I7:L7.
- Drag the bottom-right corner of cell I10 up to cell L10.
- Select the range I10:L10 and drag the bottom-right corner of the selection area up to cell L12. This copies the formula in cell I10 all over the range I10:L12.
- With the range I10:L12 selected go to Home and select the Percentage icon.
- Click on the Increase Decimal icon two times.
Step 3 – Create a Survey Report
- Select the range H4:L12.
- Press Ctrl + C.
- Go to a blank worksheet.
- Select a cell and right-click on it.
- From the context menu, click on Transpose in the Paste Options.
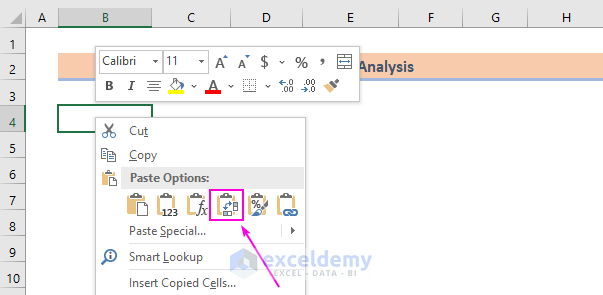
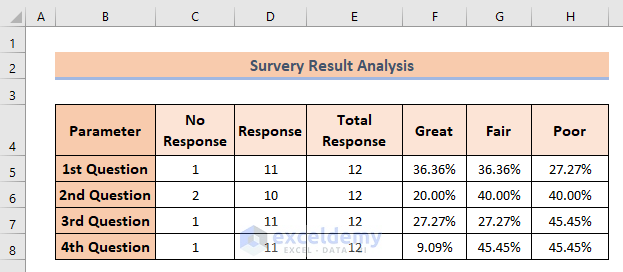
- Your copied rows will be converted into columns and vice versa like in the following screenshot.
- Select the Parameter, No Response, Response, and Total Response columns alongside their headers.
- Go to Insert, select Insert Column or Bar Chart, and choose 2-D Clustered Column.
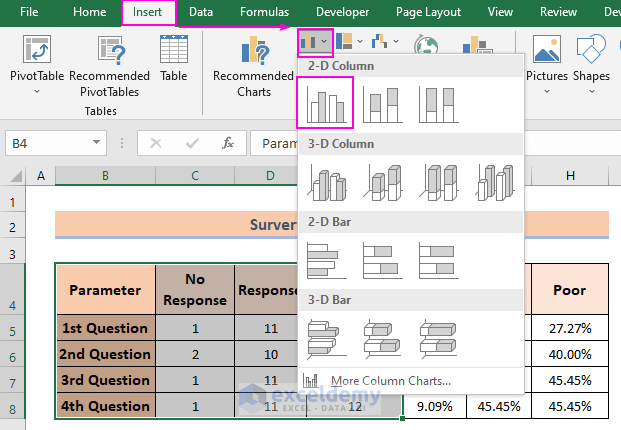
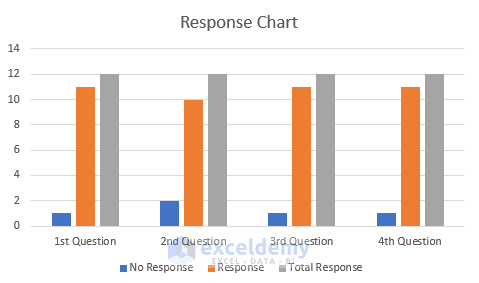
- This will generate a Question vs. Response chart. In the chart, Response, No Response, and Total Response data will be represented with 3 different color columns.
- Select Parameter, Great, Fair, and Poor columns and their headers.
- Insert a 2-D Cluster Column Chart.
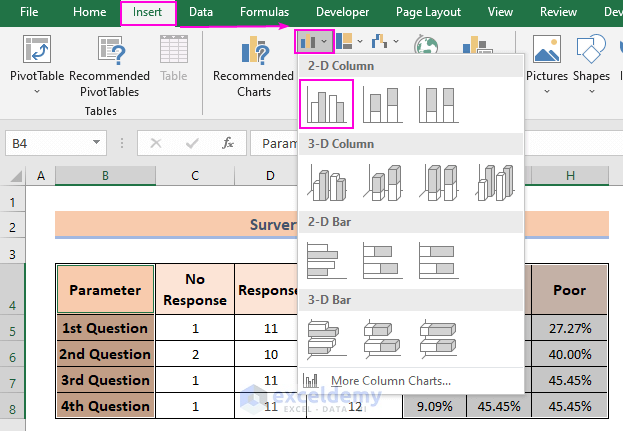
- This will generate a Feedback vs. Question chart.

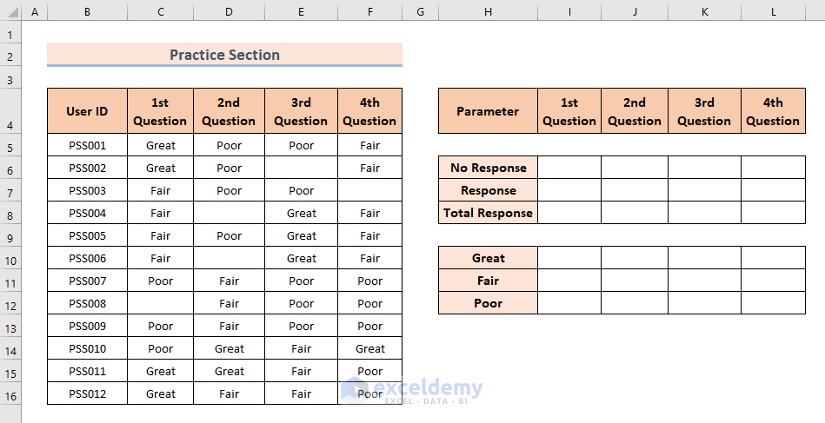
Practice Section
You will get an Excel sheet at the end of the provided Excel file where you can practice all the methods discussed in this article.
Download the Practice Workbook
Related Articles
- How to Display Survey Results in Excel
- How to Create a Questionnaire in Excel
- How to Tabulate Data in Excel
- How to Encode Survey Data in Excel
- How to Analyze Survey Data in Excel
- How to Analyze Satisfaction Survey Data in Excel
- How to Analyze Survey Data with Multiple Responses in Excel
<< Go Back to Survey in Excel | Excel for Statistics | Learn Excel
Get FREE Advanced Excel Exercises with Solutions!

Very informative post.