Method 1 – Creating a Survey Form for Feedback
- Create all the questions regarding your products.
- Create five questions to get the feedback from the customers


- Take the response from the customers.
- Go for the analysis of that survey data in Excel.
Method 2 – Counting Blank and Non-Blank Feedback from Survey Data in Excel
- We provide five questions to get responses from the customers, we set a dataset without this.
- Our dataset is mainly focused on the question answers and the customers’ IDs.
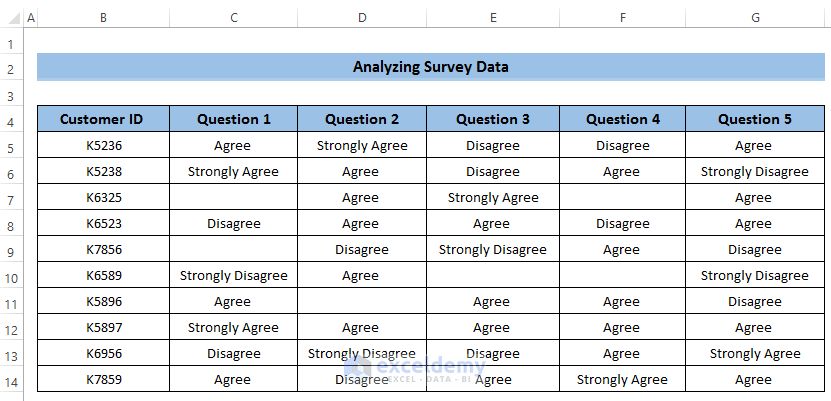
- Several customers skip some of the questions without giving any feedback.
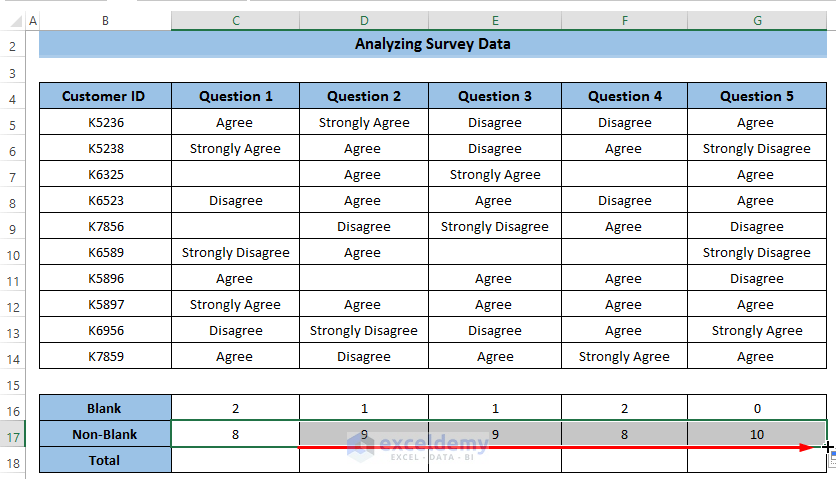
- We need to count the blank and non-blank cells at first.
- Select cell C16.

- Write down the following formula in the formula box.
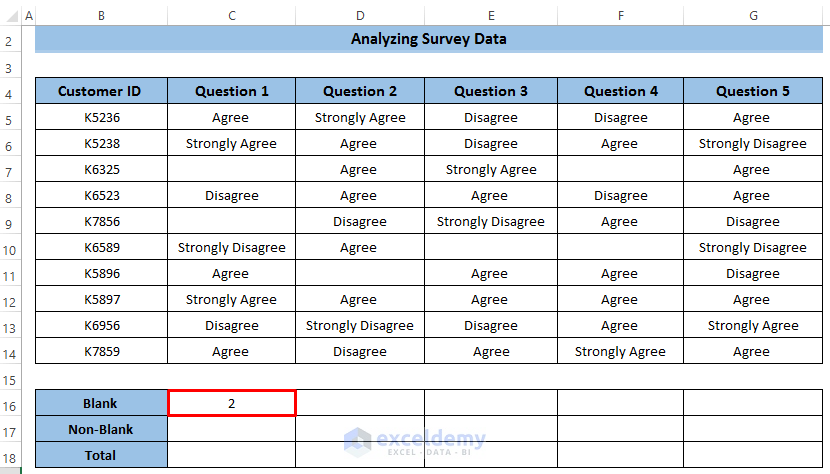
=COUNTBLANK(C5:C14)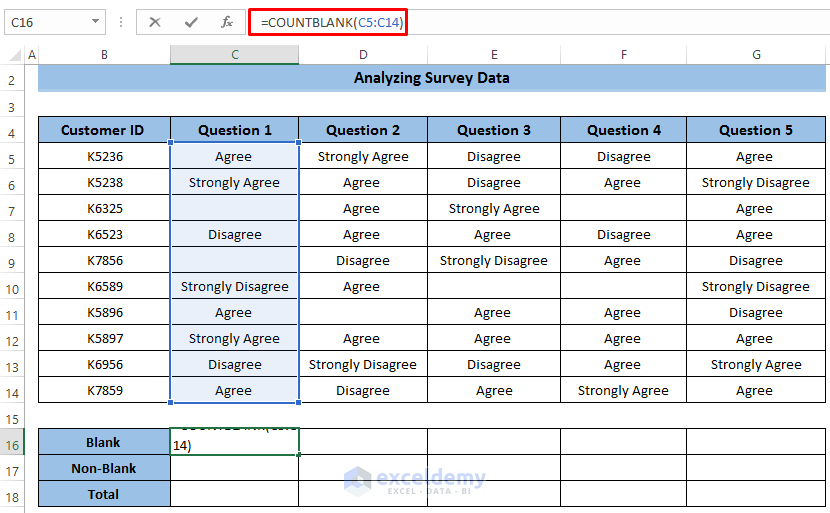
- Press Enter to apply the formula.
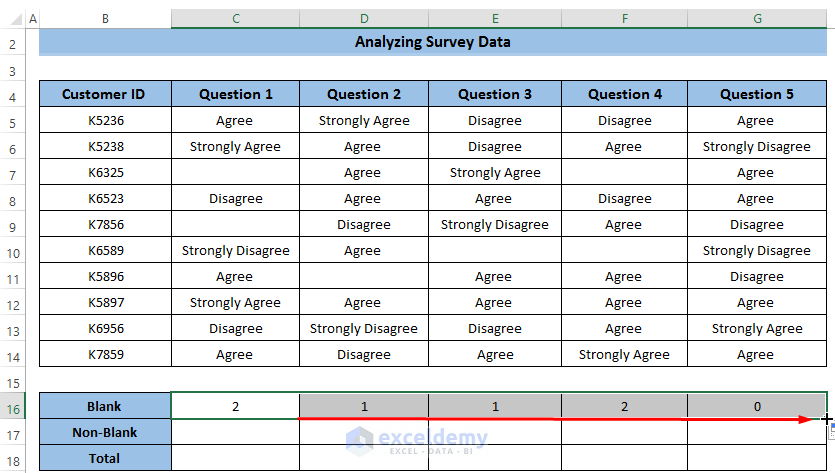
- Drag the Fill Handle icon up to cell G16.
- Count the non-blank feedback from the customers, select cell C17.

- Write down the following formula in the formula box.
=COUNTA(C5:C14)
- Press Enter to apply the formula.

- Drag the Fill Handle icon up to cell G17.
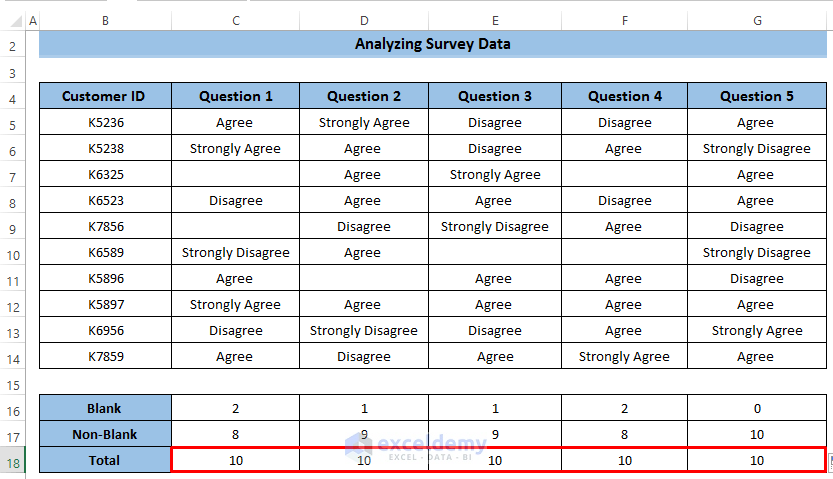
- Count the total feedback using the SUM function. we need to add all the blank and non-blank cells.
- Select cell C18.

- Write down the following formula in the formula box.
=SUM(C16:C17)
- Press Enter to apply the formula.

- Drag the Fill Handle icon up to cell G18.
Method 3 – Counting All Feedback from Survey
- We need to increase the visibility of our dataset.
- Select row 15.

- Go to the View tab in the ribbon.
- From the Freeze Panes drop-down menu, select Freeze Panes.

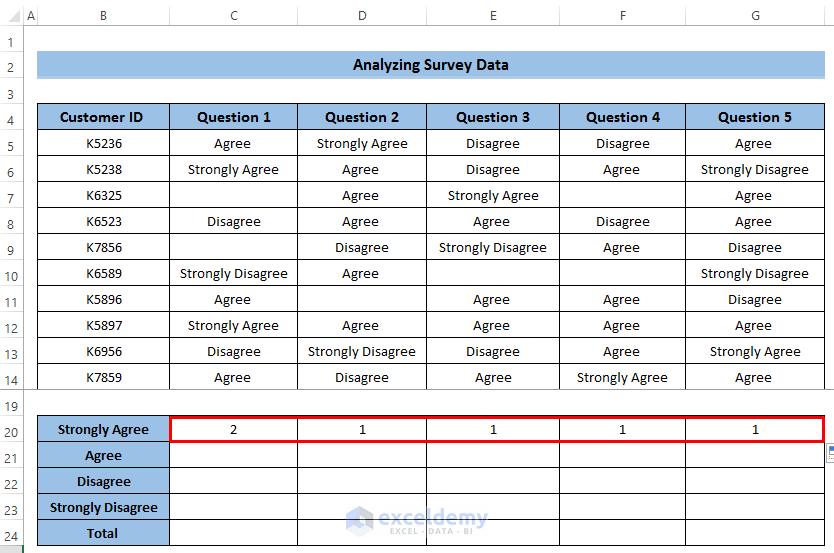
- Select cell C20.
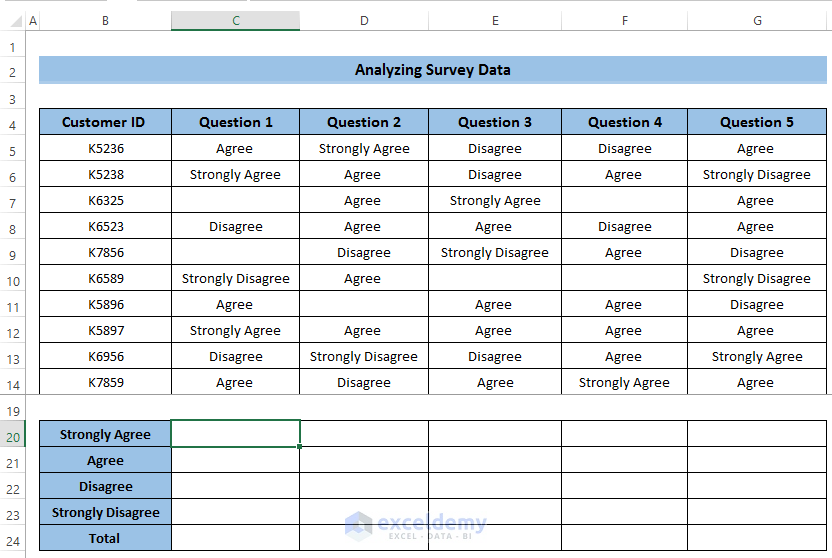
- Write down the following formula.
=COUNTIF(C5:C14,$C$6)
- Press Enter to apply the formula.
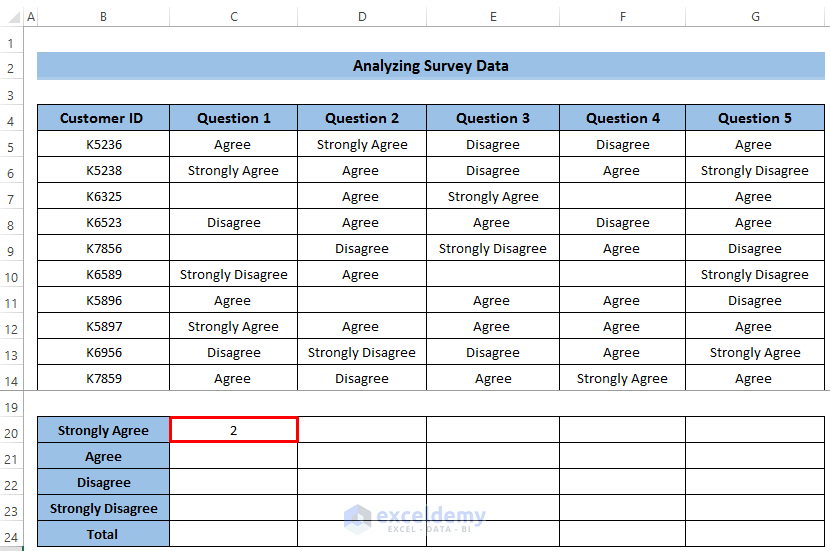
- Drag the Fill Handle icon up to cell G20.
Breakdown of the Formula
COUNTIF(C5:C14,$C$6)
This formula denotes the total number of condition that appears in the given range of cells. The function first enters into the range of cells C5 to C14. It searches the criteria you give in the formula. We give a criterion cell C6 which means Strongly Agree. The function searches this criterion in the whole range of cells. It returns the total number of times it appears. Two customers give this response in the survey data.
- We need to calculate the total number of times Agree appears in the survey data.
- Select cell C21.

- Write down the following formula in the formula box. Here, we have taken the criterion Agree. Take cell C5 as the criterion and make it constant by pressing F4.
=COUNTIF(C5:C14,$C$5)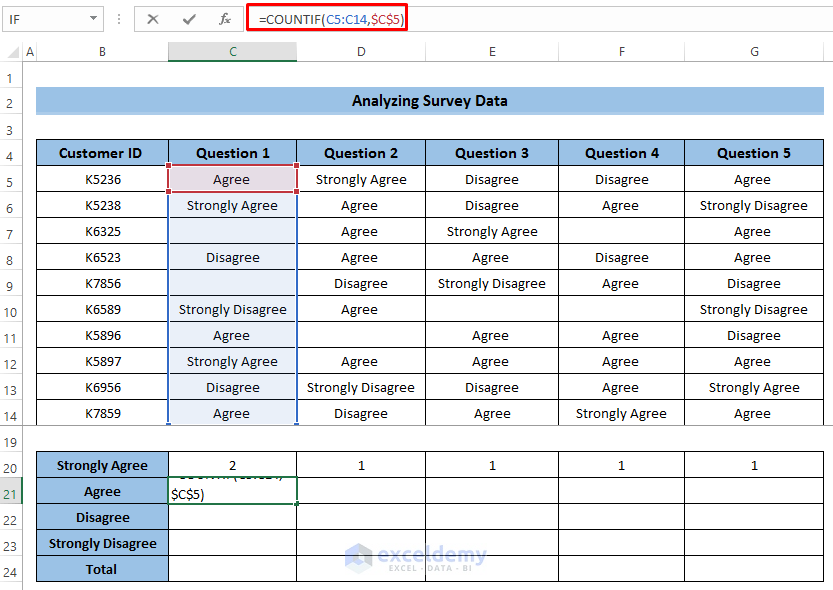
- Press Enter to apply the formula.

- Drag the Fill Handle icon up to cell G21.
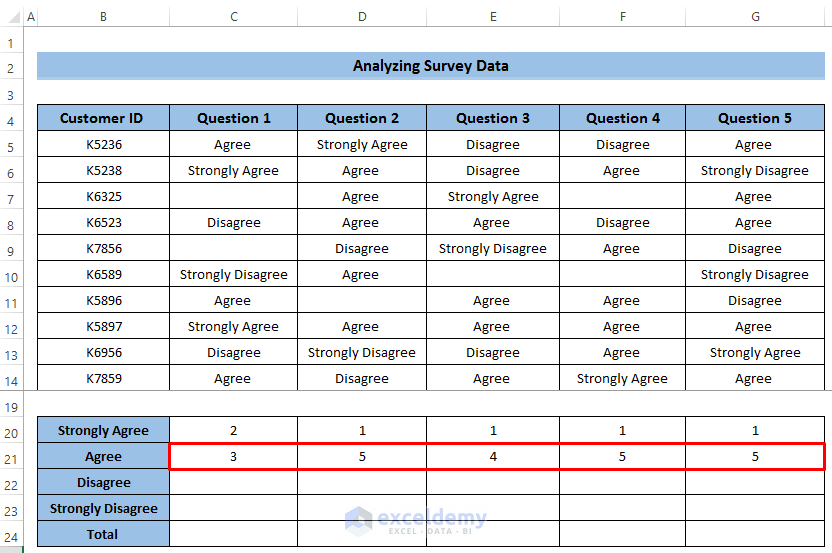
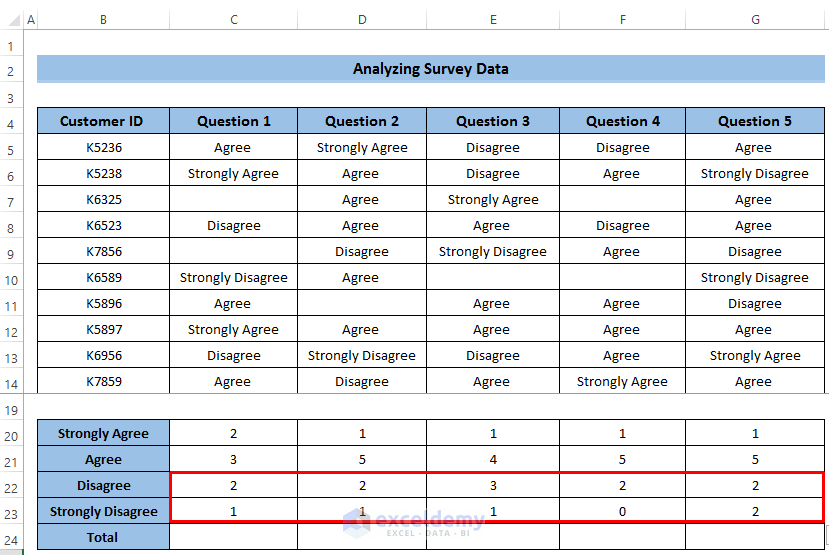
- We can count feedback for the other two options.
- The basic difference between all the conditions is the criterion. Set the criterion according to the feedback options.
- We get the final calculation of all the feedback. See the screenshot.
- We need to calculate the total number of feedback using the SUM function.
- Select cell C24.

- Write down the following formula.
=SUM(C20:C23)
- Press Enter to apply the formula.

- Drag the Fill Handle icon up to cell G24.

Method 4 – Calculating Percentage of Each Feedback
- Select cell C27.

- Write down the following formula in the formula box.
=C20/$C$24
- Press Enter to apply the formula.
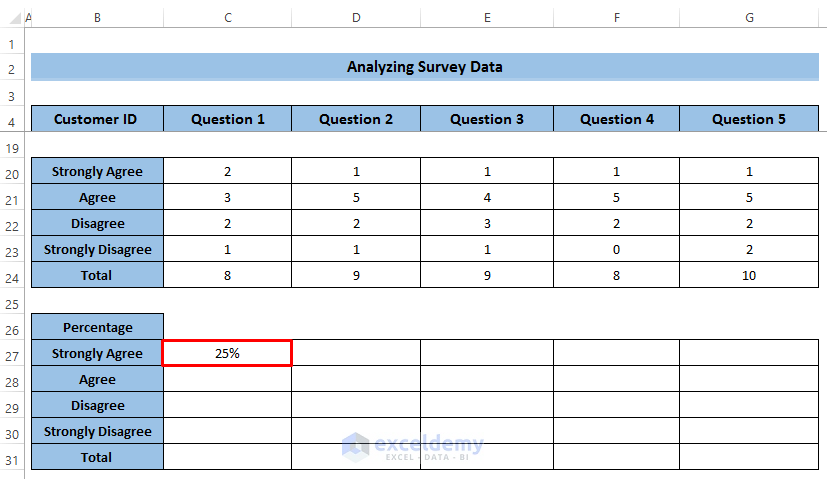
- Drag the Fill Handle icon up to cell C30.

- Select cell D27.

- Write down the following formula in the formula box.
=D20/$D$24
- Press Enter to apply the formula.

- Drag the Fill Handle icon up to cell D30.

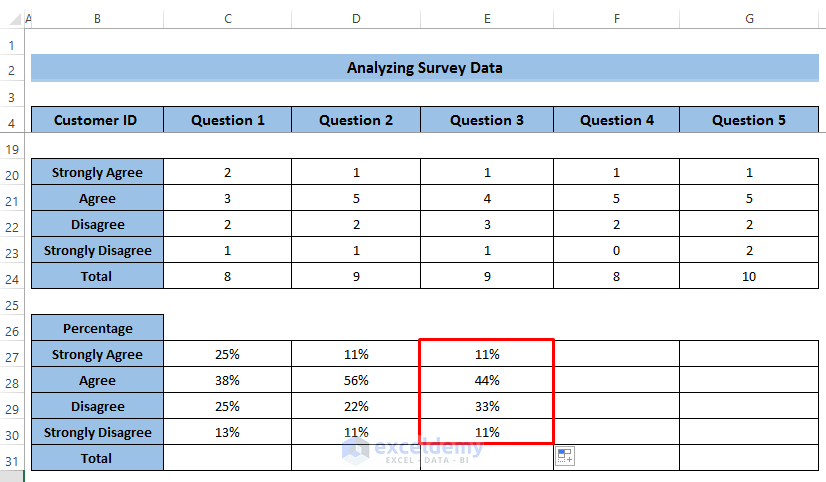
- Select cell E27.

- Write down the following formula in the formula box.
=E20/$E$24
- Press Enter to apply the formula.

- Drag the Fill Handle icon up to cell E30.
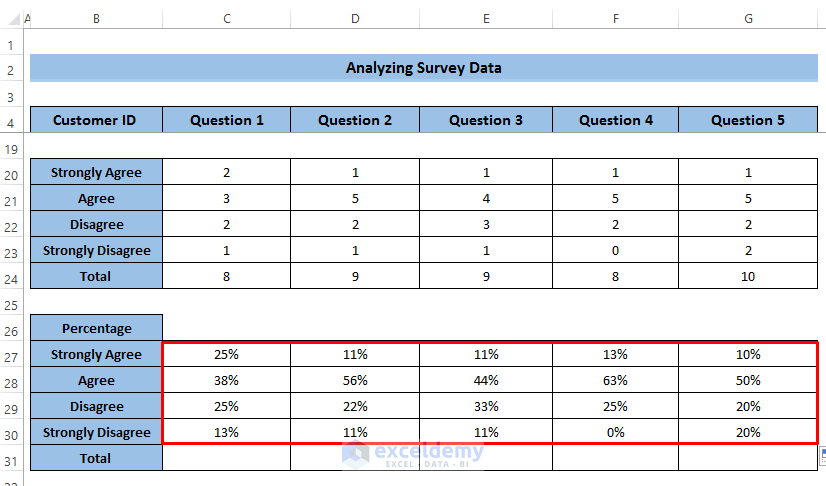
- Calculate the percentage in a similar way for questions 4 and question 5.
- You will get the following results. See the screenshot.
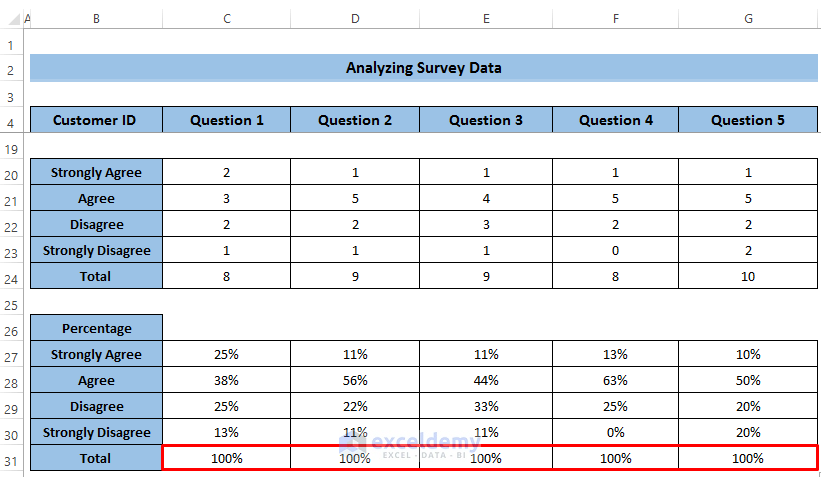
- Calculate the total percentage to check whether it is 100% or not.
- Select cell C31.

- Write down the following formula.
=SUM(C27:C30)
- Press Enter to apply the formula.

- Drag the Fill Handle icon up to cell G31.
Method 5 – Using Estimated Results to Analyze Survey Data
- Select the row header of the dataset.

- Go to the Home tab in the ribbon.
- From the Clipboard group, select Copy. For keyboard shortcuts, you can use Ctrl+C.

- Go to the open worksheet.
- Then, select cell B4.
- Go to the Home tab in the ribbon
- From the Clipboard group, select the Paste option.

- In the Paste option, select Paste Special.

- A Paste Special dialog box will appear.
- In the Paste section, select Values.
- Check on Transpose.
- Click OK.

- Have the result in the screenshot.
- We changed the Customer ID to Questions.

- Go to the dataset and select row 24 where we have all the total feedback.

- Copy the total feedback row by pressing Ctrl+C on the keyboard.

- Go to the Survey Result
- Select cell C4.
- Go to the Home tab in the ribbon
- From the Clipboard group, select the Paste option.
- In the Paste option, select Paste Special.
- A Paste Special dialog box will appear.
- In the Paste section, select Values.
- Check on Transpose.
- Click on OK.
- Get the total number of feedback in the transpose format.

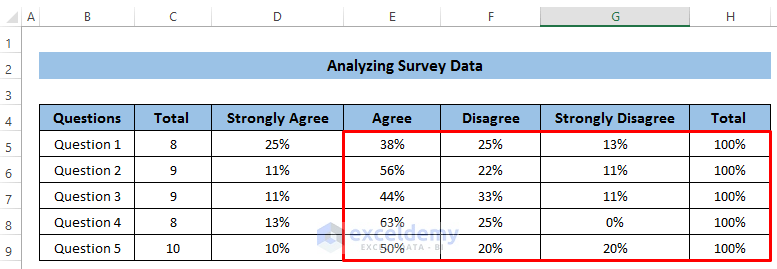
- Get the percentage of the feedback from customers, you need to select the range of cells B27 to G31.

- Copy the total feedback row by pressing Ctrl+C on the keyboard.

- Go to the Survey Result.
- Select cell D4.
- Go to the Home tab in the ribbon.
- From the Clipboard group, select the Paste option.
- In the Paste option, select Paste Special.
- A Paste Special dialog box will appear.
- In the Paste section, select Values.
- Check on Transpose.
- Click on OK.
- Get the percentage of feedback in the transpose format.
Method 6 – Creating Excel Chart to Analyze Survey Data
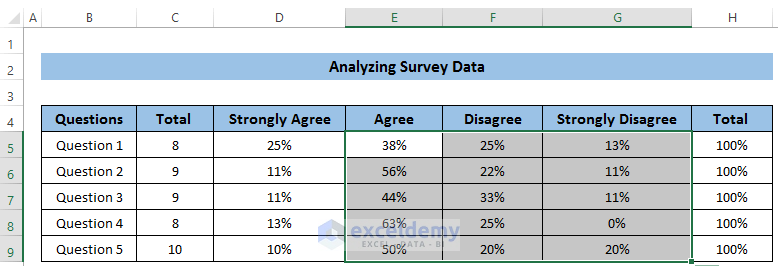
- Select the range of cells D4 to G9.
- Go to the Insert tab in the ribbon.
- From the Charts option, select Recommended Charts.

- An Insert Chart dialog box will appear.
- Select Clustered Bar chart.
- Click OK.

- It will provide a bar chart. But that’s what we want.
- We need to add more data. Select the chart, and it will open up the Chart Design option.
- From there in the Data group, select the Select Data option.

- A Select Data Source dialog box will appear.
- In the Horizontal Axis Labels, click Edit.

- The Axis label range and select cells B5 to B9.
- Click on OK.

- Click on OK in the Select Data Source dialog box to apply the changes.

- There we have our desired bar chart.

- We can change the Chart Style by clicking on the icon. See the screenshot.

- There we have our final bar chart regarding the survey data.

- You can change the chart type by right-clicking on it.
- Right-click on the chart and a Context Menu box will appear.
- Select the Change Chart Type option.

- Select the Column chart from the Recommended Charts option.
- Select the first type of column chart.
- Click OK.

- We have our required column chart for survey data.

Download Practice Workbook
Download this practice workbook.
Related Articles
- How to Tabulate Data in Excel
- How to Tally Survey Results in Excel
- How to Encode Survey Data in Excel
- How to Create a Questionnaire in Excel
- How to Display Survey Results in Excel
- How to Analyze Survey Data with Multiple Responses in Excel
- How to Analyze Satisfaction Survey Data in Excel
<< Go Back to Survey in Excel | Excel for Statistics | Learn Excel
Get FREE Advanced Excel Exercises with Solutions!


This is helpful. Thank you.
Hello, An!
You are most welcome. To get helpful content follow ExcelDemy.
Regards
ExcelDemy
Thankyou ..it helped me a lot
Great piece
Thank you, Saffue! I’m glad you enjoyed it. Do let me know if you’d like me to cover any specific survey analysis techniques in Excel in future posts.
Regards,
ExcelDemy