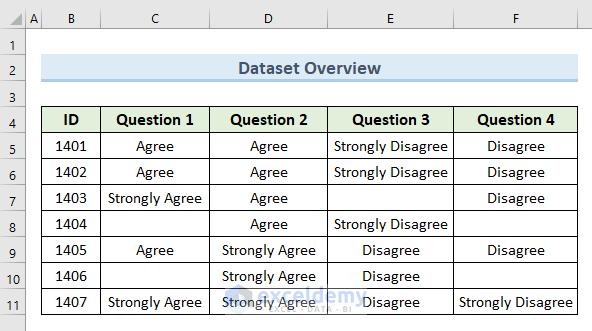
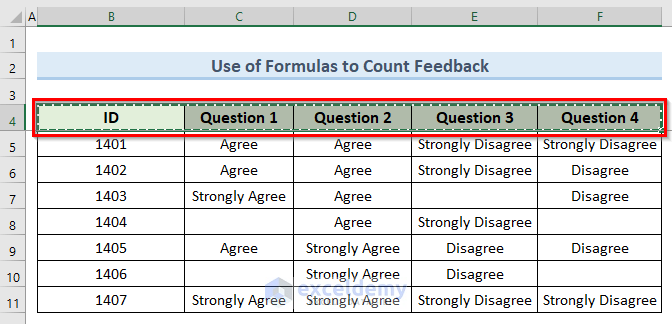
Dataset Overview
Our dataset contains feedback on four questions from different individuals, with unique ID numbers assigned to each person.
Step 1 – Count All Feedback
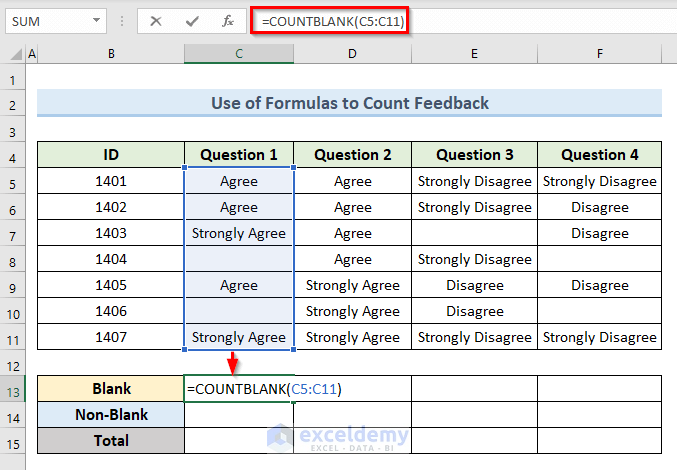
- Count Blank Cells:
- Start by selecting cell C13.
- Enter the following formula:
=COUNTBLANK(C5:C11)
-
- Press Enter.
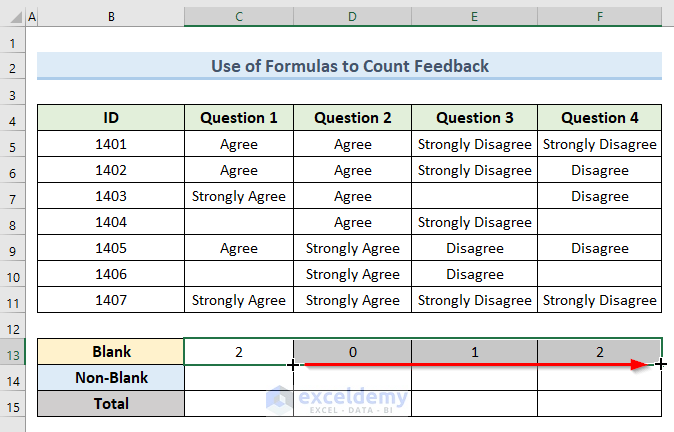
- Drag the Fill Handle horizontally to apply the formula to the desired range.
- This formula calculates the number of blank cells in the selected range.
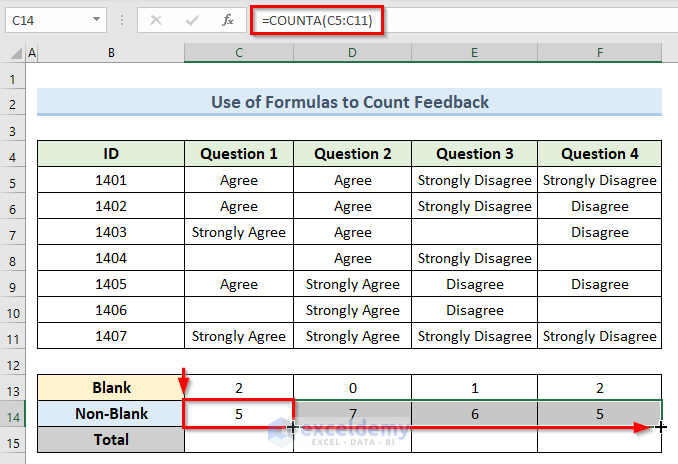
- Count Non-Empty Cells:
- Select cell C14.
- Enter the formula:
=COUNTA(C5:C11)-
- Press Enter.
- Drag the Fill Handle horizontally to apply the formula.
- The COUNTA function counts non-empty cells.
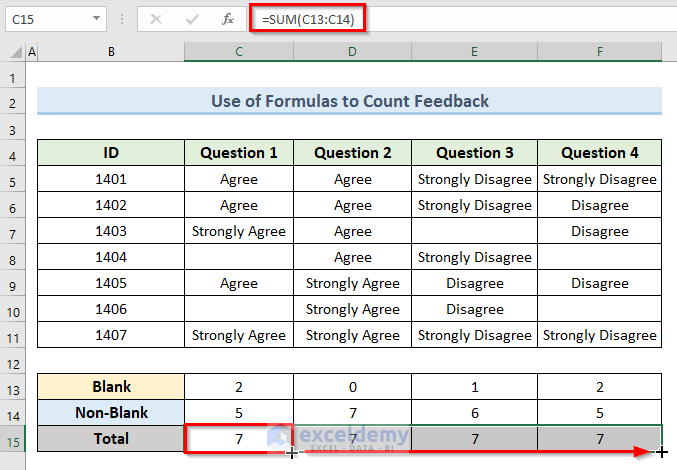
- Total Feedback Cells:
- In cell C15, enter:
=SUM(C13:C14)-
- Press Enter.
- Drag the Fill Handle to extend the formula.
- The SUM function adds the counts of blank and non-blank cells.
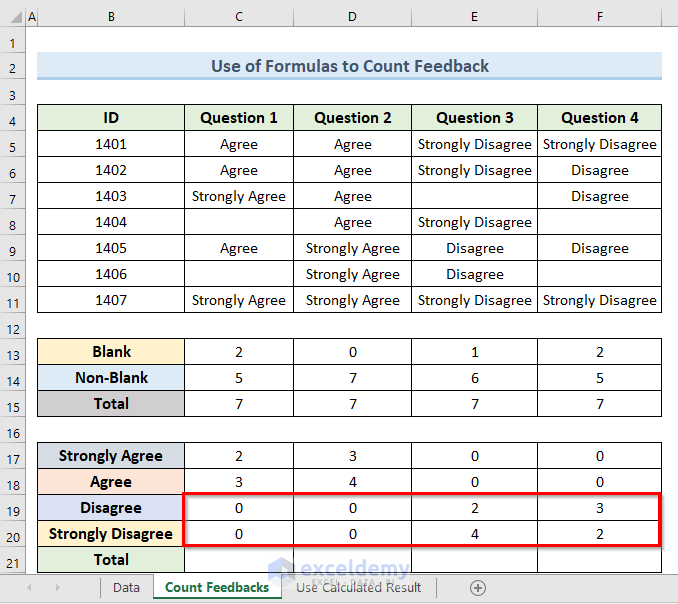
- Record Feedback Counts:
- Create a new section to record feedback counts (similar to the image provided).
- In cell C17, use the formula:
=COUNTIF(C5:C11,$C$11)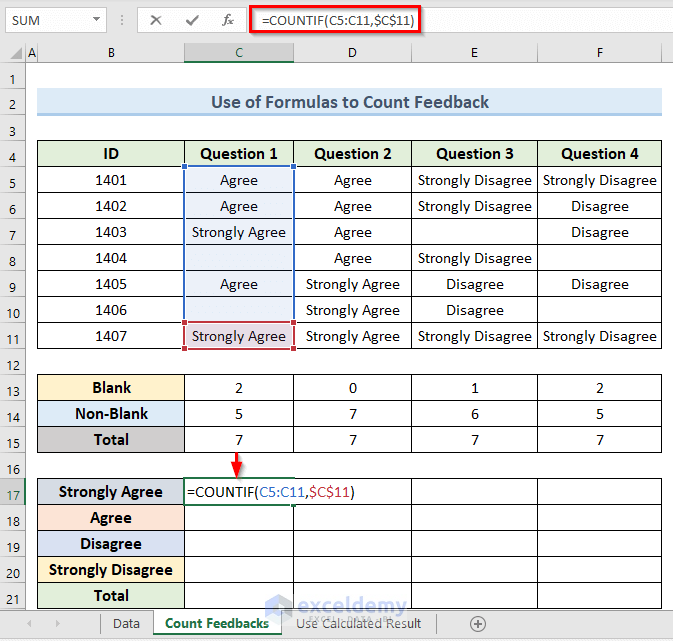
-
- Press Enter.
- Drag the Fill Handle from C17 to F17 to copy the formula.
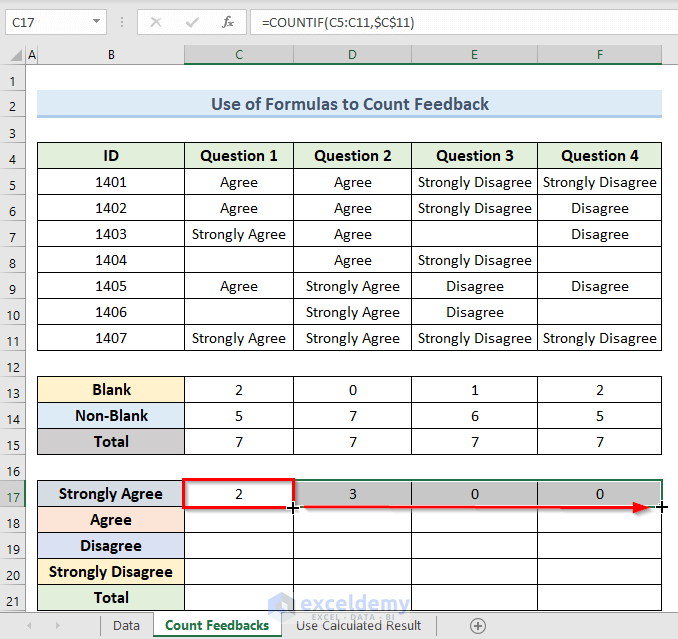
-
- Repeat for the other feedback categories (e.g., Agree, Disagree).
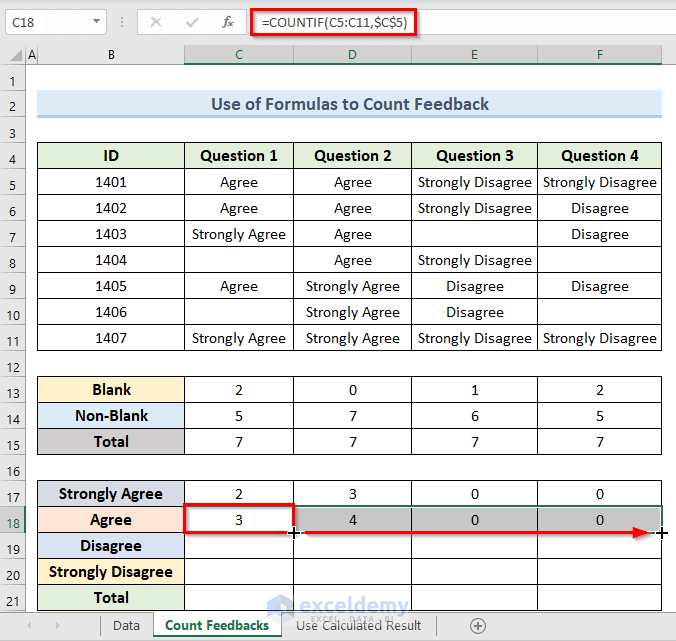
- The final result will look like the following image.
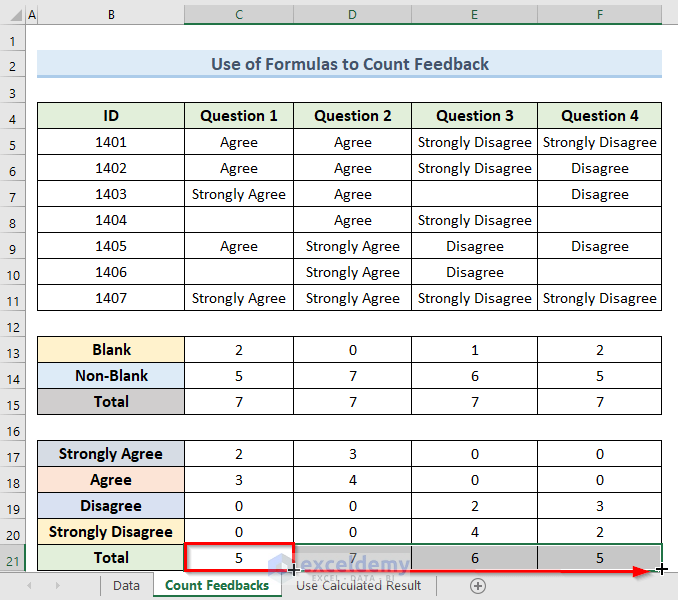
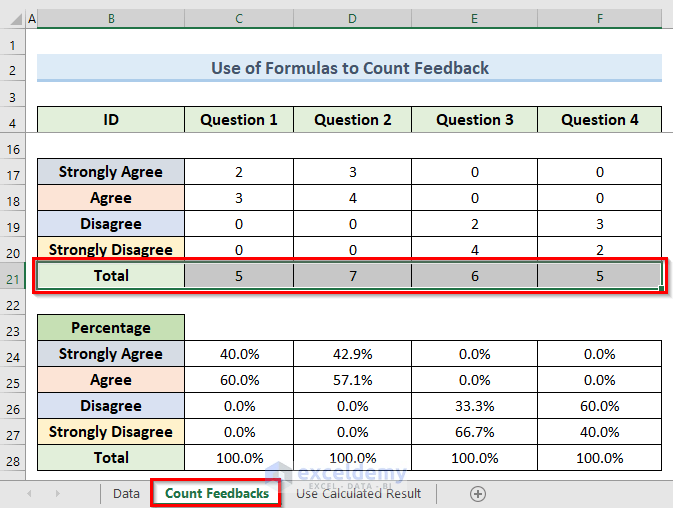
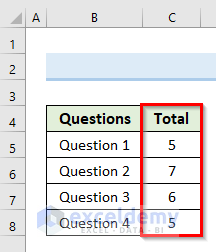
- Total Feedback for Each Question:
- In cell C21, enter:
=SUM(C17:C20)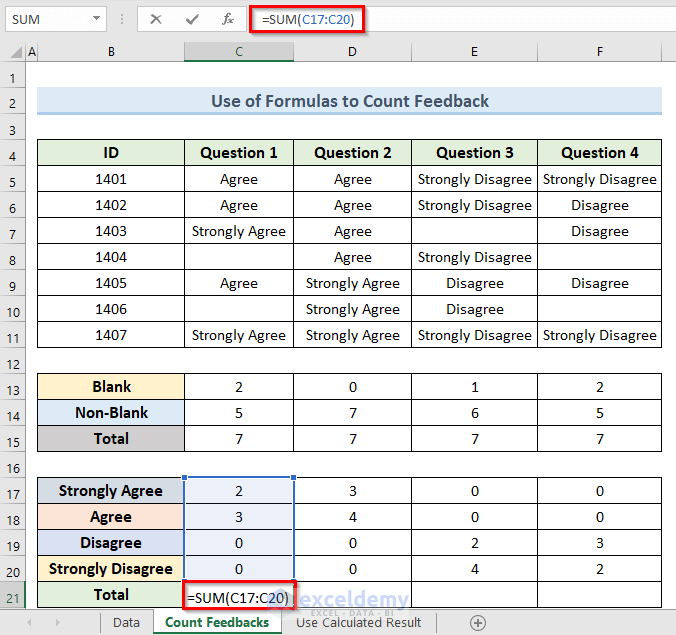
-
- Press Enter.
- Drag the Fill Handle to copy the formula.
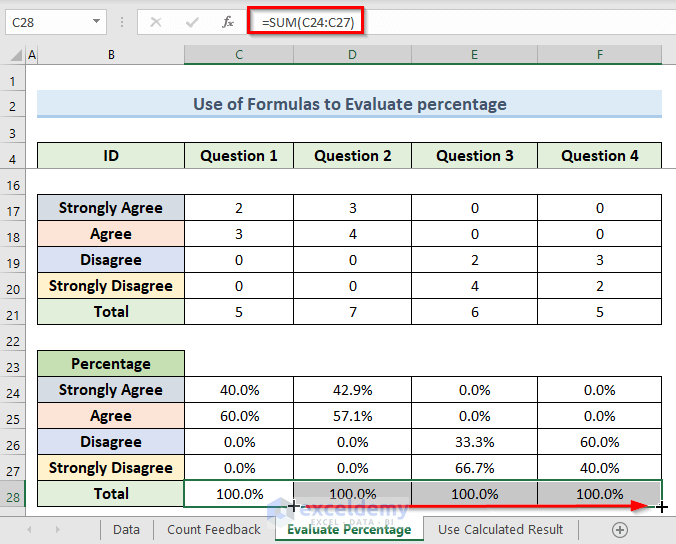
Step 2 – Evaluate Feedback Percentages
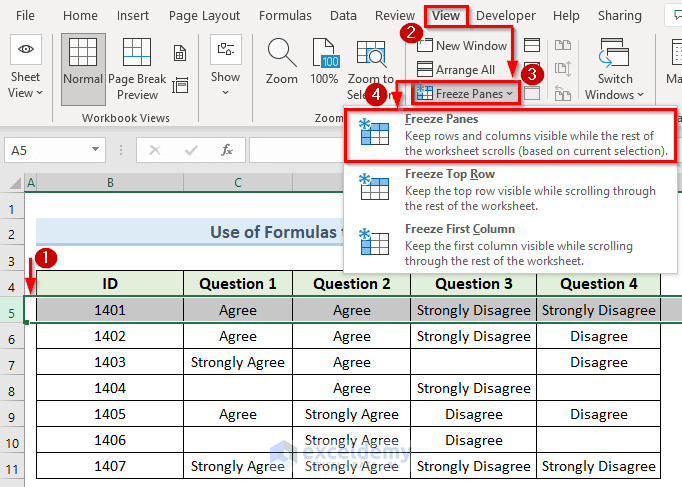
- Enhance Dataset Visibility:
- Select row 5 to freeze it (go to the View tab and select Freeze Panes).
- Now you can scroll through the dataset while keeping the header row visible.
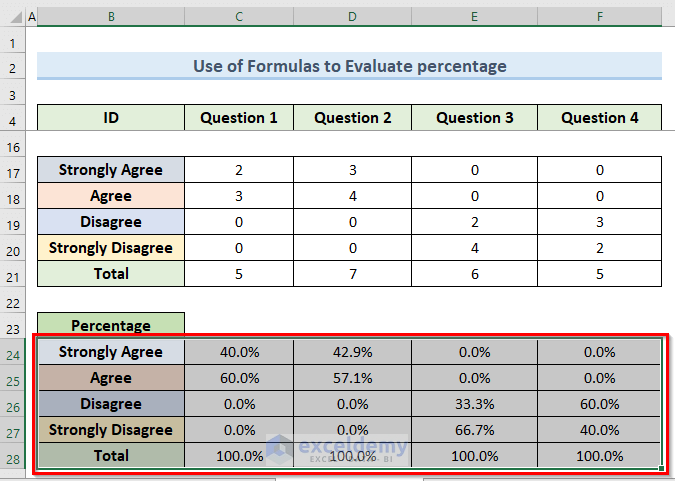
- Calculate Percentages:
- In cell C24, enter:
=C17/$C$21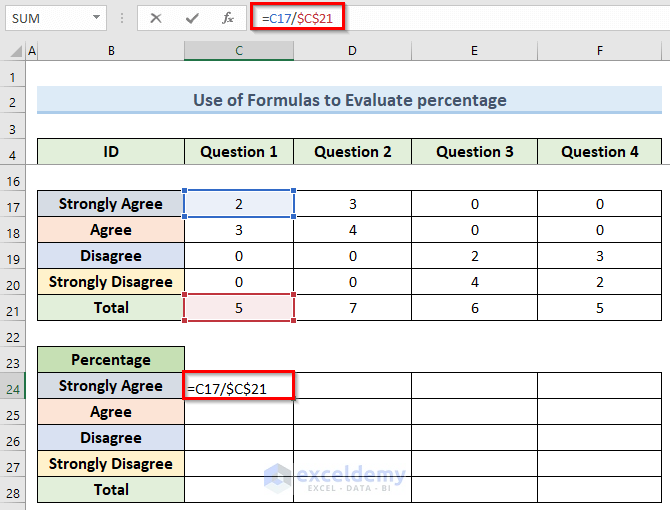
-
- Press Enter.
- Format cell C24 as a percentage (go to Format Cells and select Percentage).
- Drag the Fill Handle from C24 to C27 to copy the formula.
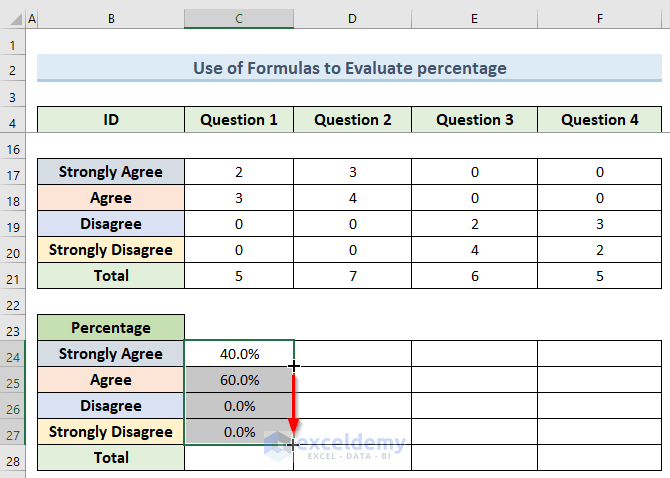
-
- Repeat for cells D24, E24, and F24.
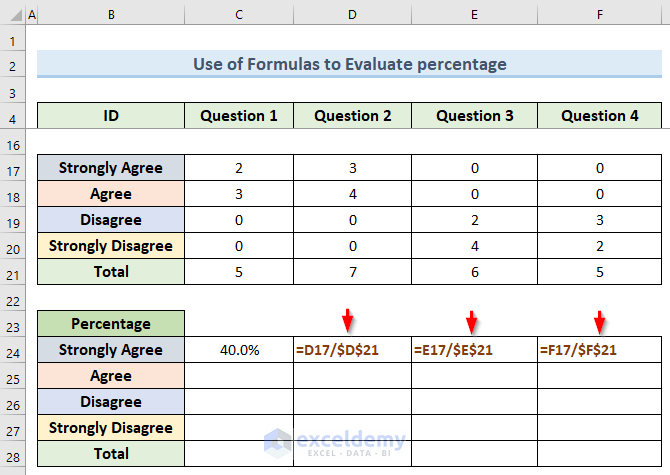
-
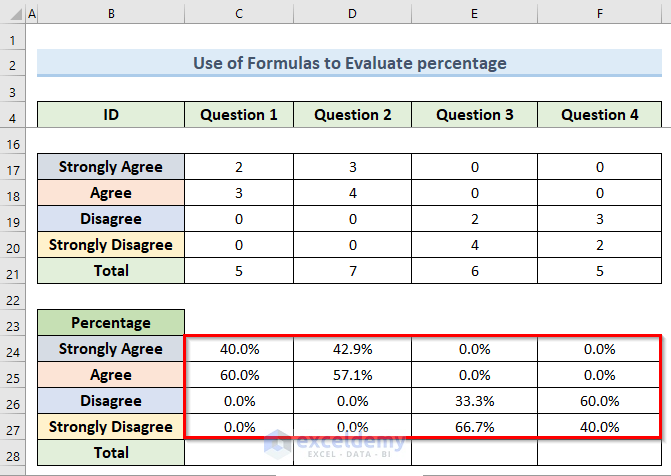
- Drag the Fill handle tool to get results as per the below image.
- Total Percentage:
- In cell C28, enter:
=SUM(C24:C27)-
- Press Enter.
- Drag the Fill Handle from C28 to F28.
You should now have results similar to the provided image after completing these steps.
Step 3 – Use Evaluated Results to Analyze Satisfaction Survey Data
Follow these instructions to create the final report based on the satisfaction survey data:
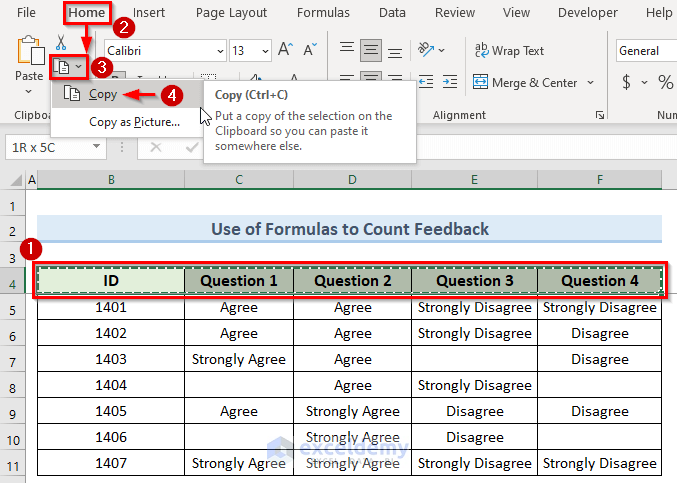
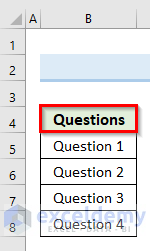
- Select Header Row:
- Select the header row of your dataset.
- Copy Data:
- Go to the Home tab.
- Click on the Copy icon to copy the selected data (you can also use Ctrl + C).
-
- Open a new worksheet.
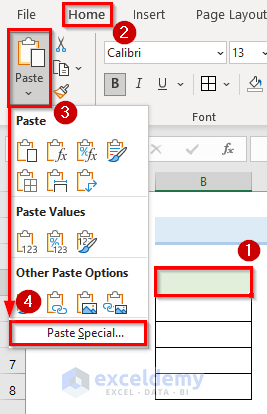
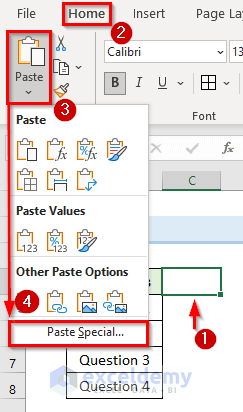
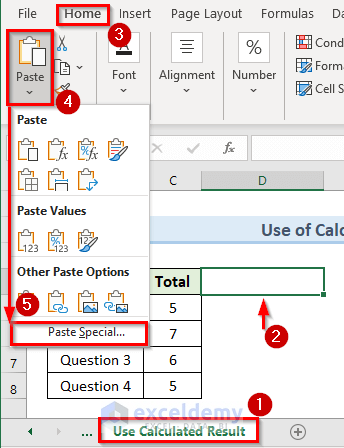
- Paste Special:
- Select cell B4 in the new worksheet.
- Go to Home > Paste > Paste Special.
-
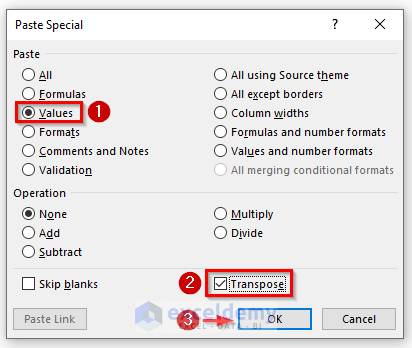
- In the dialog box, check the options for Values and Transpose, then click OK.

-
- The results should appear as shown in the image. We’ve edited the name in cell B4 to Questions from ID.
- Total Feedback Count:
- Return to the original sheet named Count Feedback.
- Copy row number 5, which contains the total number of feedback.
-
- Select cell C5 in the new worksheet.
- Go to Home, select Paste and click on Paste Special.
-
- Check the options for Values and Transpose, then click OK.
This provides the total feedback count in a new column.
- Transfer Calculated Results:
- Select the cell range B24:F28 (where you calculated percentages).
-
- Go to the sheet named Use Calculated Result.
- Select cell D5 and go to Home, select Paste and click on Paste Special.
-
- Check the options for Values and Transpose, then click OK.

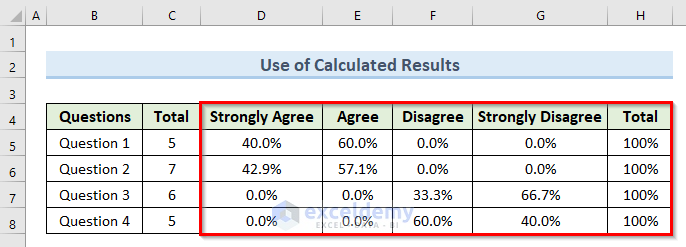
- Final Report:
- The resulting table should resemble the image provided. You’ve completed the analysis of the satisfaction survey data.
Read More: How to Analyze Survey Data in Excel
Download Practice Workbook
You can download the practice workbook from here:
Related Articles
- Analyze Survey Data with Multiple Responses in Excel
- How to Create a Questionnaire in Excel
- How to Encode Survey Data in Excel
- How to Display Survey Results in Excel
- How to Tally Survey Results in Excel
- How to Tabulate Data in Excel
<< Go Back to Survey in Excel | Excel for Statistics | Learn Excel
Get FREE Advanced Excel Exercises with Solutions!
