In this article, we will show how to create a data table with 3 variables. Users often have to deal with a data table with 2 variables. However, there are many instances when we will have to resort to a 3 variable data table. Excel does not offer any direct method to create a data table with 3 variables. In this article, we will show 2 different ways to do that in Excel.
How to Create Data Table with 3 Variables: 2 Quick Tricks
In this article, we will discuss 2 ways to create a data table with 3 variables. Firstly, we will use the Pivot Table to do the task. Then, we will use the Data Table command to create the 3 variables data table.
1. Using PivotTable to Create Data Table with 3 Variables
The PivotTable is a powerful tool to store and manipulate data according to the users’ desire. In this method, we will use this tool to create a data table with 3 variables. Here, we will try to find out the monthly payment for changing principles, terms, and interest rates by using the PMT function.
Steps:
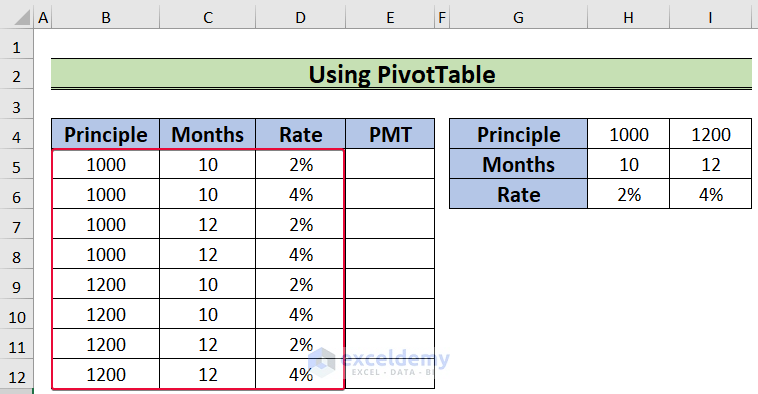
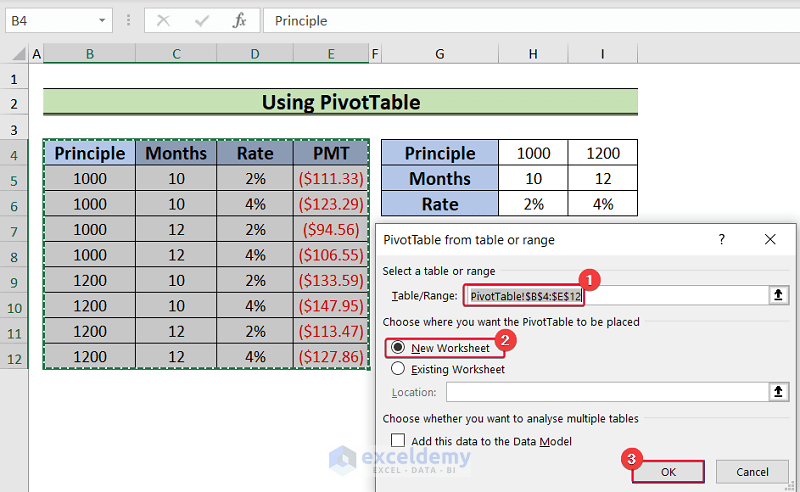
- Firstly, write down all the combinations of Principle, Months, and Rates possible in the range B5:D12.
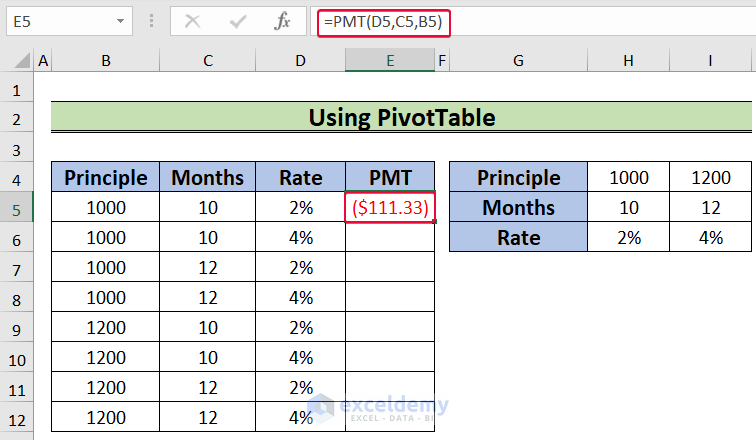
- Then, click on the E5 cell and type the following formula.
=PMT(D5,C5,B5)- Then, press Enter.
- As a result, we will get the payment value for the particular principle, month, and rate.
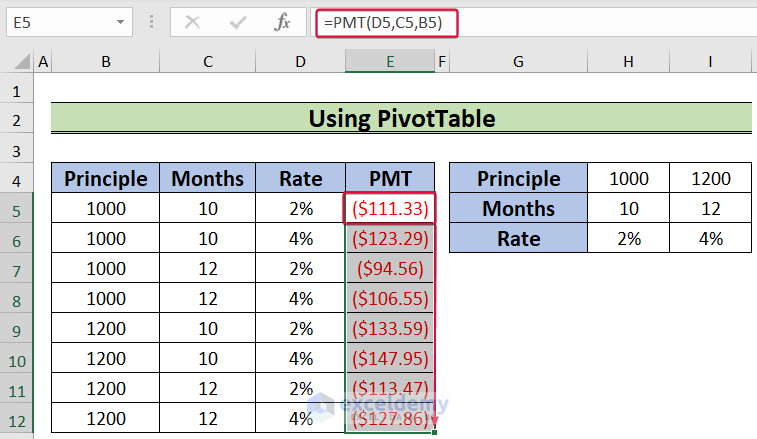
- Now, lower the cursor down to the last cell to autofill the formula.
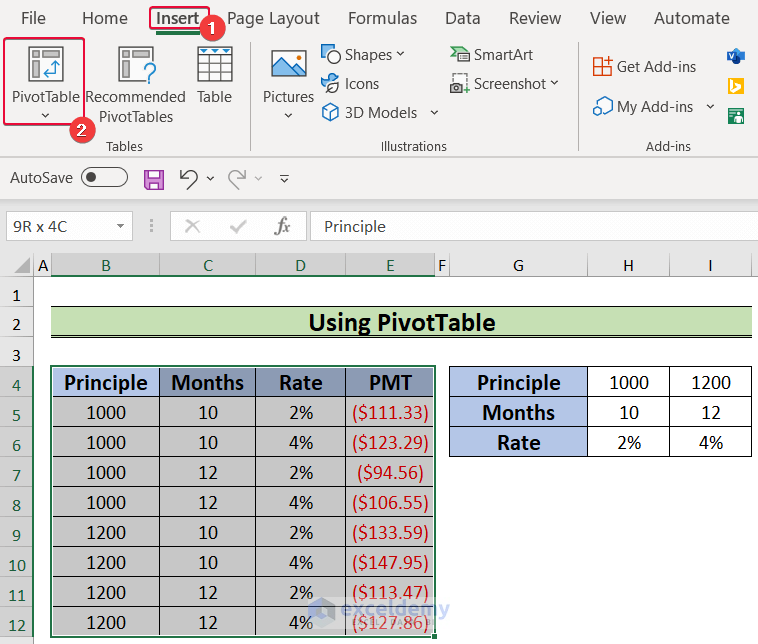
- After that, select range B5:E12.
- Thereafter, go to the Insert tab.
- From the Insert tab, select PivotTable.
- As a result, a prompt will be on the screen.
- From the prompt, select range B5:E12 as the Range/Table.
- Then, click on the oval beside the New Worksheet oval.
- Finally, click OK.
- As a result, a new sheet will be opened.
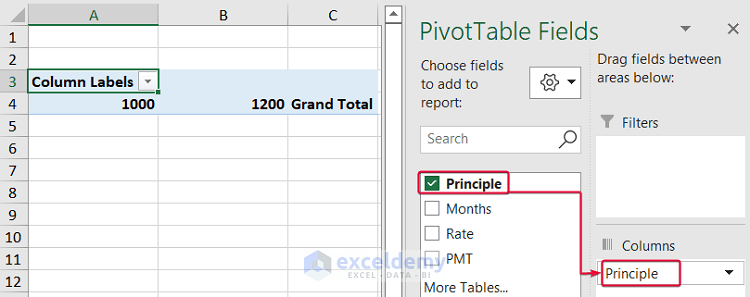
- In the new worksheet, drag the Principle field under the Columns area.
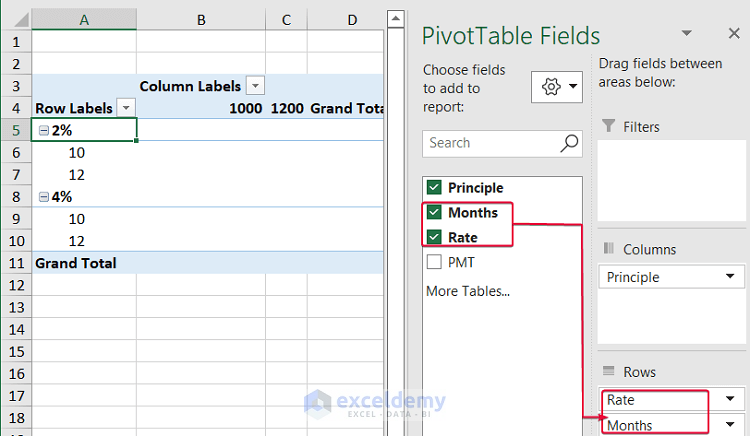
- Then, drag the Months and Rate fields under the Rows area.
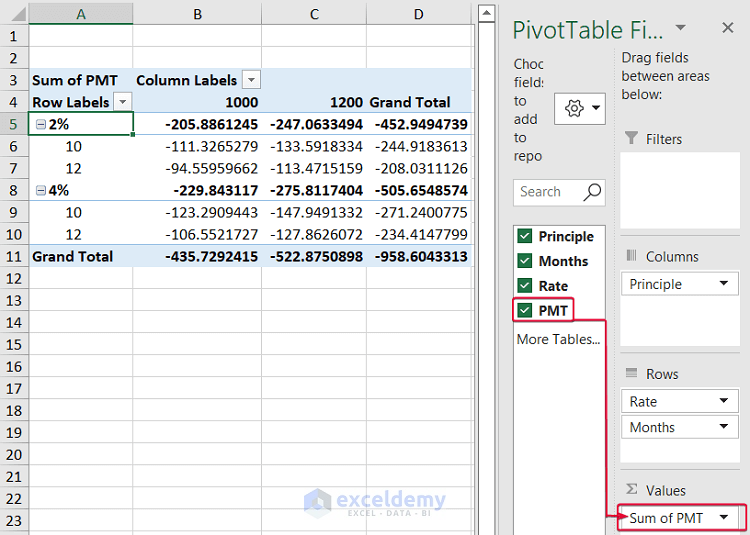
- Finally, drag the PMT field under the Values area.
- As a result, we will have a pivot table.
- Now, click on any of the cells on the pivot table.
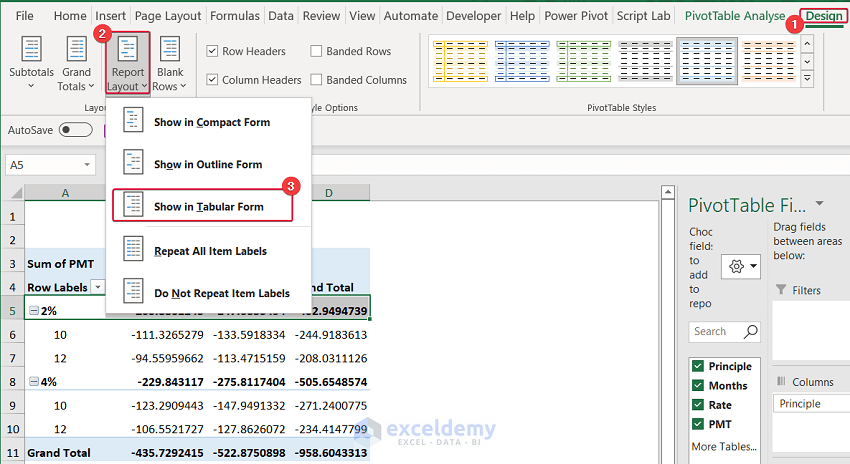
- Go to the Design tab.
- Then, select the Report Layout tab.
- From the drop-down list, select Show in Tabular Form.
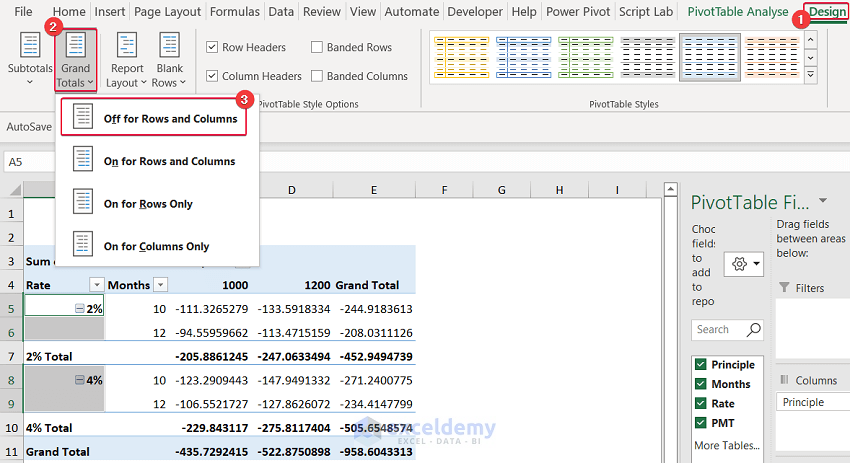
- After that, again click on any cell of the pivot table.
- Then, go to the Design tab.
- Select the Off for Rows and Columns command under the Grand Totals tab.
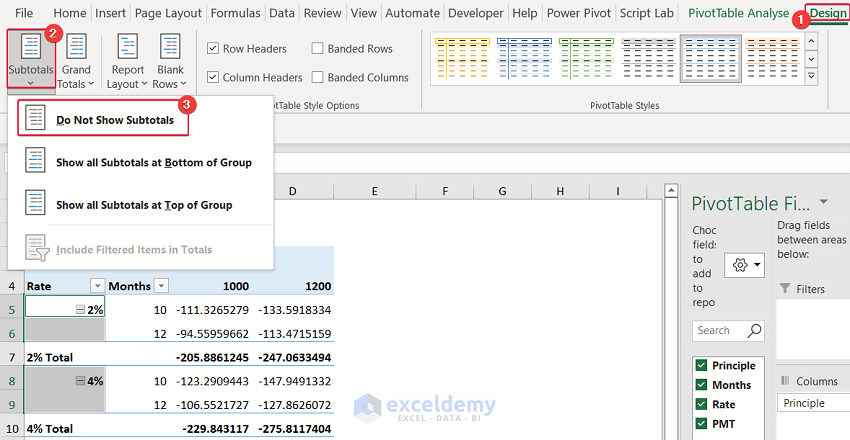
- Go to the Design tab again.
- Then, under Subtotal, select Do Not Show Subtotals.
- As a result, all the subtotals will be removed.
- Finally, we will have a data table with 3 variables.
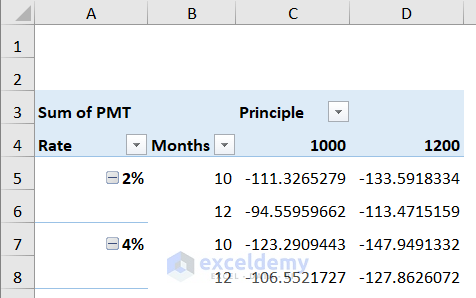
In this way, we will get a data table with 3 variables by using the PivotTable.
Read More: How to Create One Variable Data Table in Excel
2. Using Data Table Command
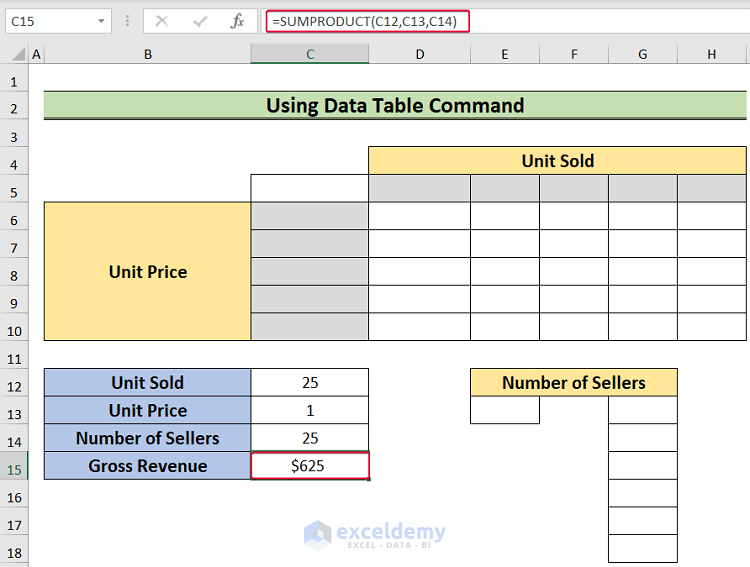
In this instance, we will use the Data Table command to make a data table with 3 variables. Here, we will first create a regular 2-way data table. Then, we will connect the data table with the 3rd variable. Here, we will calculate the gross revenue for changing units sold, unit price, and number of sellers using the SUMPRODUCT function.
Steps:
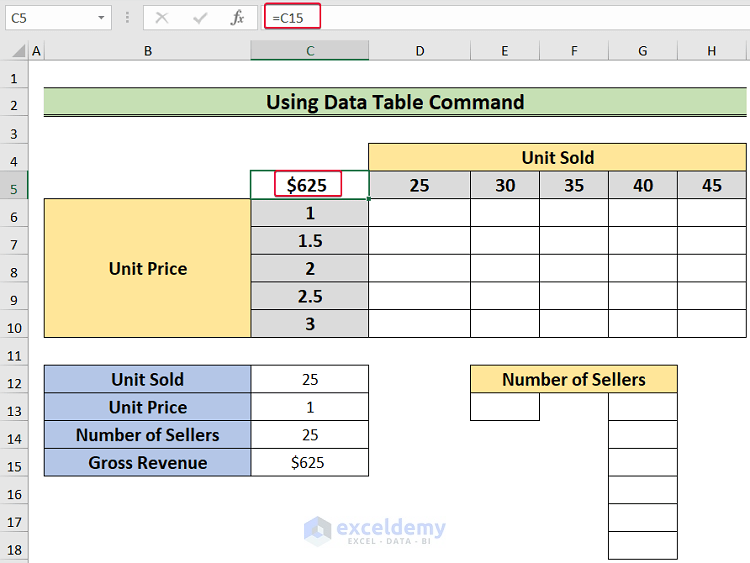
- Firstly, select cell C15 and write the formula below.
=SUMPRODUCT(C12,C13,C14)- Then, hit Enter.
- As a result, we will get the gross revenue for that particular unit sold, unit price, and number of sellers.
- Now, click on the D5 cell and type:
=C12- Then, hit Enter.

- After that, select cell E5 and enter the formula below.
=D5+5- Next, press Enter.
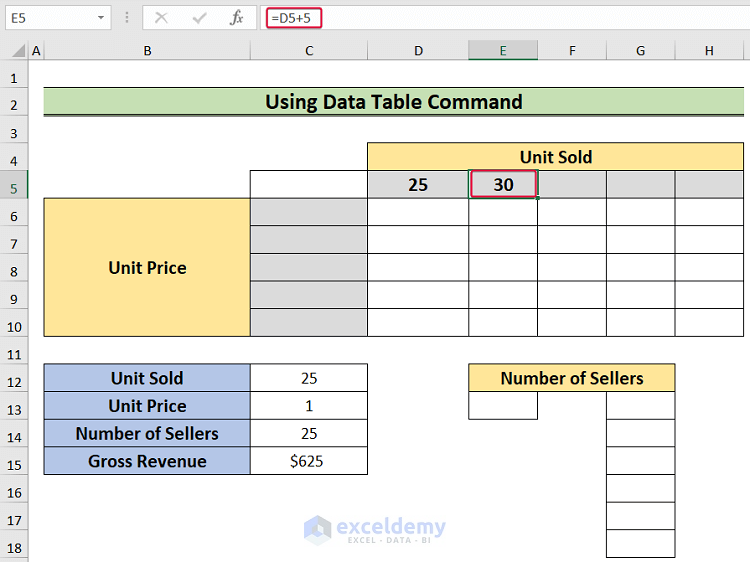
- Finally, move the cursor to cell H5 to autofill.
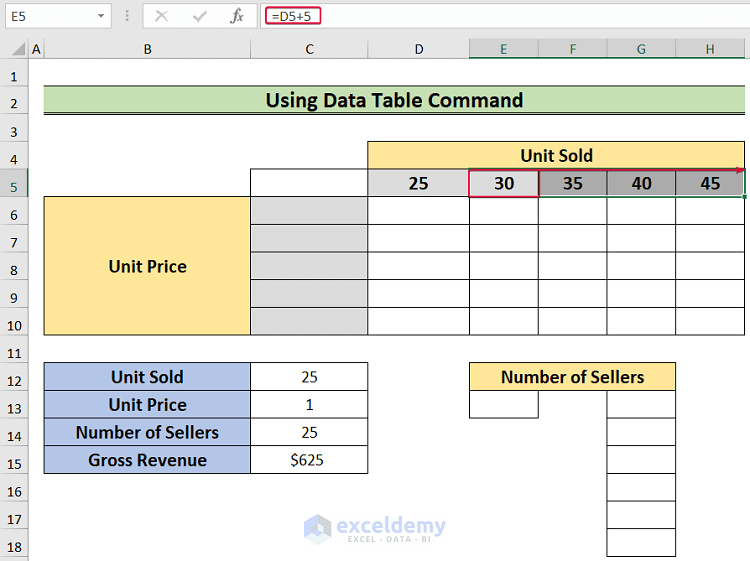
- Next, choose cell C6 and enter the following formula.
=C13- Then, press Enter.

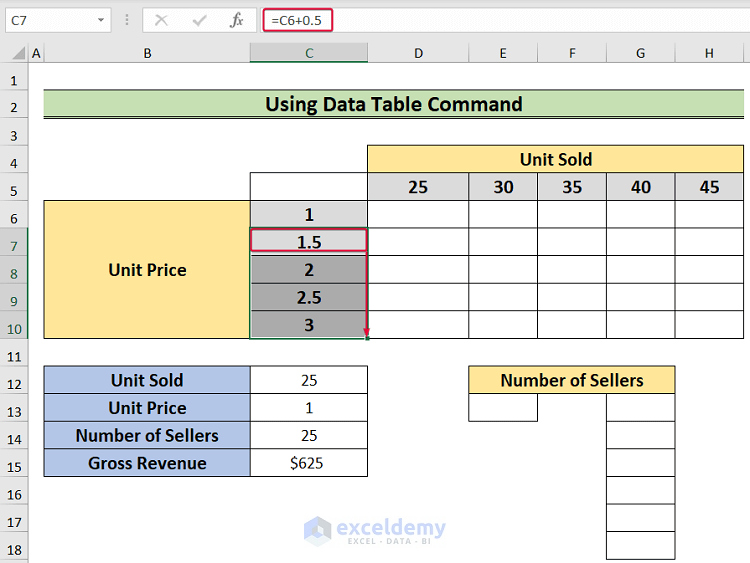
- After that, type the following formula on cell C7.
=C6+0.5- Next, press the Enter button.

- Finally, lower the cursor to cell C10 to autofill.
- After that, choose the C5 cell and write:
=C15- Hit Enter.
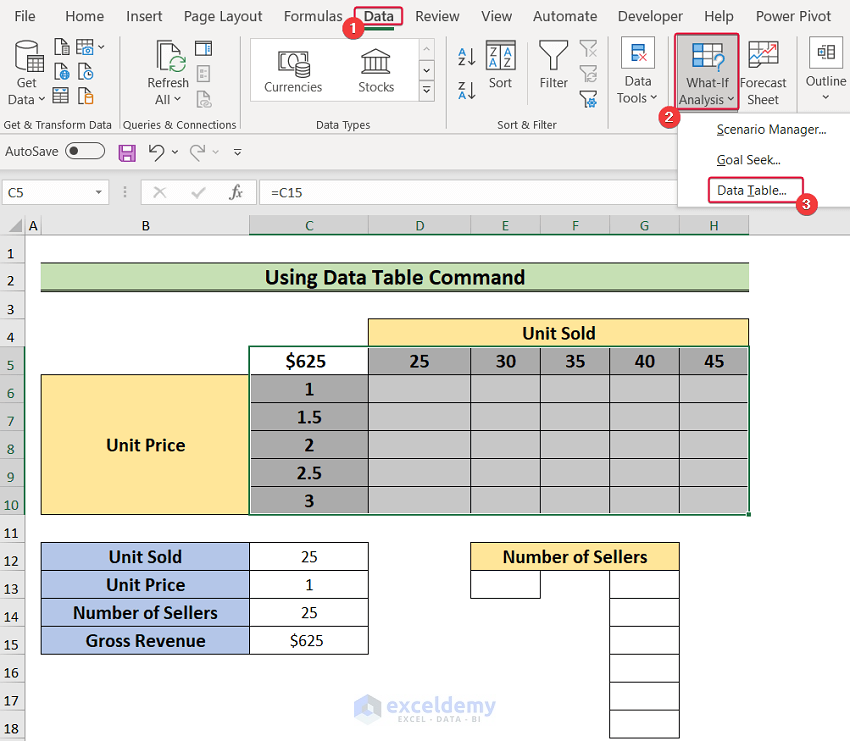
- Next, select range C5:H10.
- Then, go to the Data tab.
- From the Data tab, select the Data Table from the What-If Analysis drop-down options.
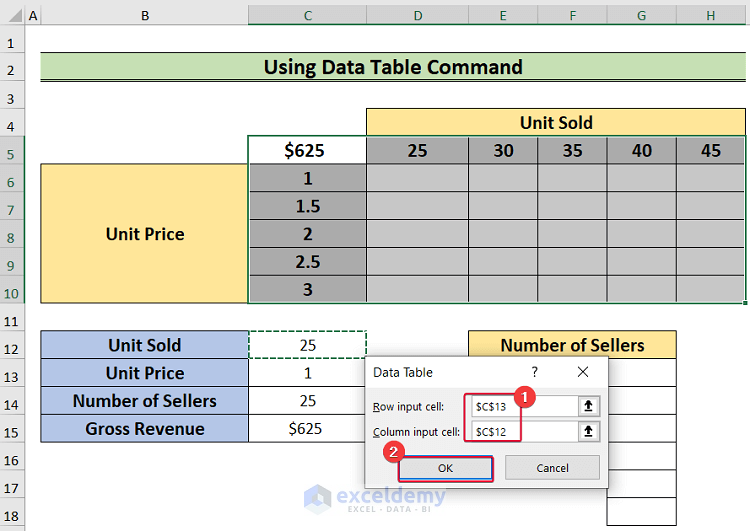
- As a result, a prompt will appear on the screen.
- In the prompt, select C13 as the Row input cell and C12 as the Column input cell.
- Finally, click OK.
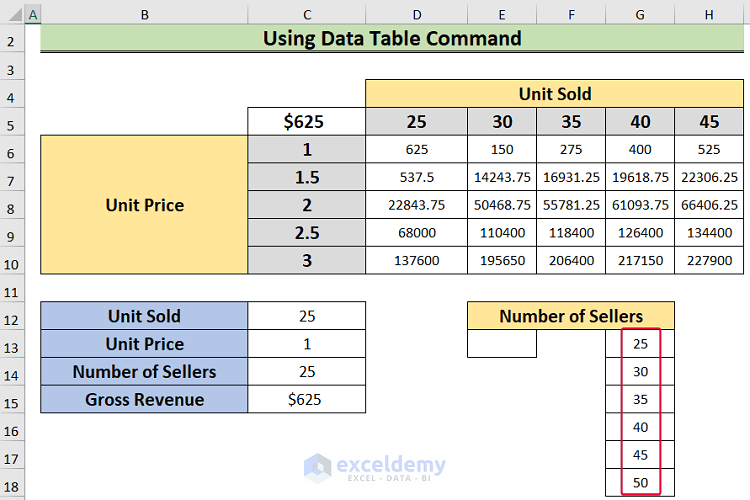
- Then, write down the list of the number of sellers in the range G13:G18.
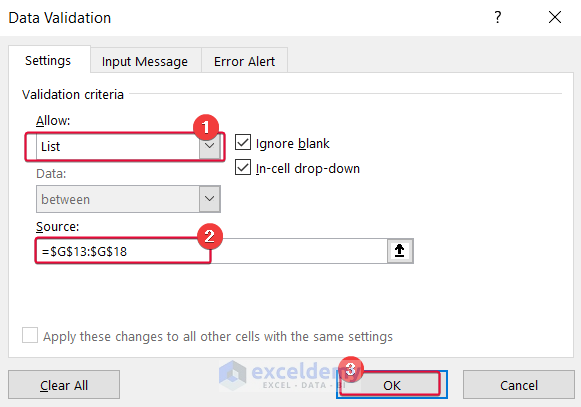
- Afterward, select cell E13 and go to the Data tab.
- From the Data Tools group, select Data Validation.
- Consequently, a prompt will be on the screen.

- From the prompt, first select List under the Allow option.
- Then, select range G13:G18 as the Source.
- Finally, click OK.
- Select cell C14 and enter:
=E13- Then, press Enter.

- As a result, as you change the value of cell E13 from the drop-down list, the values within the data table will be changed accordingly.
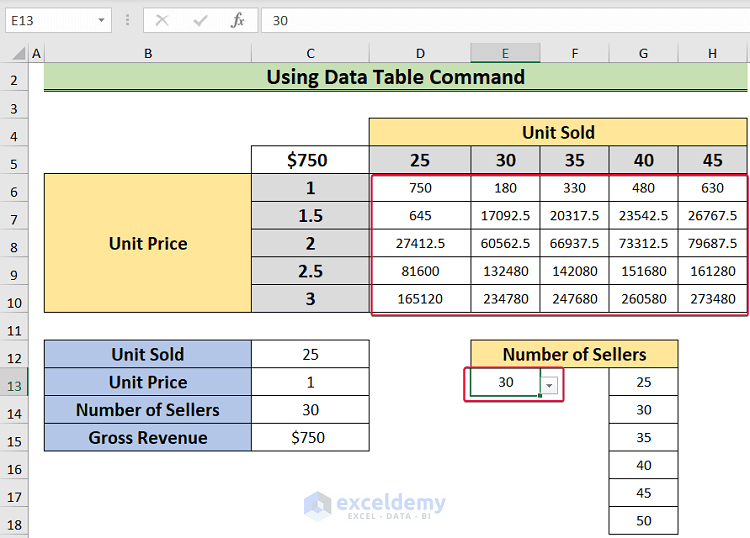
This is how we will create a data table with 3 variables by using the Data Table command.
Download Practice Workbook
You can download the practice workbook here.
Conclusion
In this article, we have discussed 2 handy methods to create a data table with 3 variables. These methods will allow users to create tables to analyze complicated calculations easily. If you have any questions regarding this essay, feel free to let us know in the comments. Also, if you want to see more Excel content like this, please visit our website and unlock a great resource for Excel-related content.
Related Articles
- How to Create One Variable Data Table Using What-If Analysis
- How to Create a 4-Variable Data Table in Excel
<< Go Back to Data Table in Excel | What-If Analysis in Excel | Learn Excel
Get FREE Advanced Excel Exercises with Solutions!
