Data Visualization in Excel
May 28, 2024
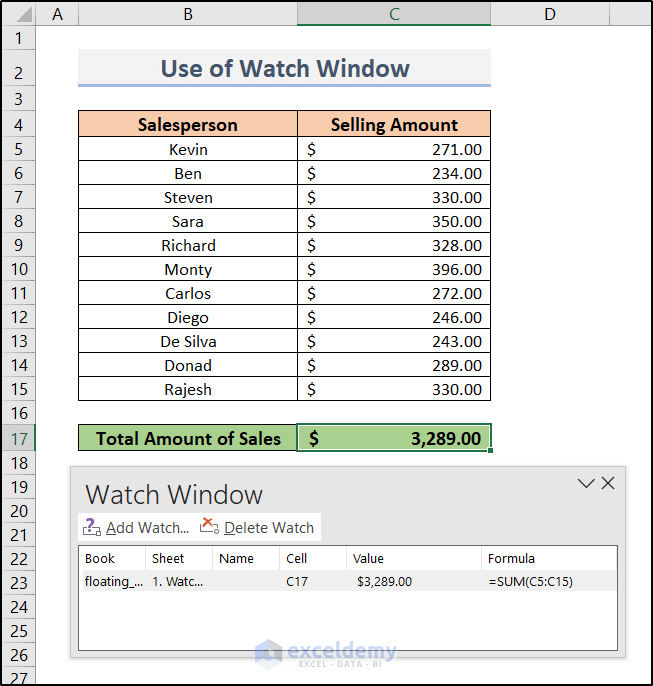
Method 1 - Using Watch Window to Create Floating Cells
To make particular info available all the time while scrolling through big data in Excel, ...
Jul 10, 2024
What Is a Heatmap?
A heat map visually represents data using colors in a two-dimensional or geographic area.
Each data point corresponds to a ...
Nov 11, 2025
Progress Bar in Excel: Knowledge Hub
Create a Progress Bar in Excel
Show Percentage Progress Bar in Excel
Progress Bar Based on Another ...
Aug 2, 2024
Example 1 - Column Chart
The sample dataset showcases 3 people's leisure activities.
To create a chart:
Steps:
Select the entire ...
Nov 11, 2025
In any business or in the corporate sector, data visualisation is a crucial factor. For assessing the performance, or to take any decision based on ...
Aug 11, 2024
What Is a Word Cloud?
Word clouds are groups of words that are visually displayed in Excel.
This is a sample word cloud of Marine Life:
...