Prepare a Budget in Excel
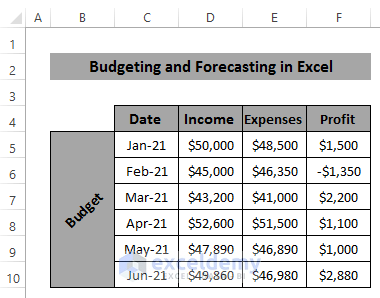
We need to consider past and present values. For example, if we make a budget for the year 2021, we need to include all the income, expenses, and profit of that year. If we want to make a budget for two previous years and a running year to compare one another, we can easily do it through Excel.
Method 1 – Forecasting Using the FORECAST.ETS Function in Excel
Steps
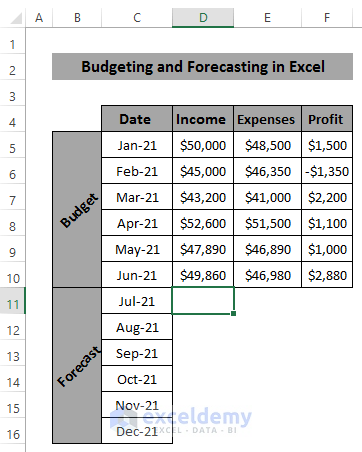
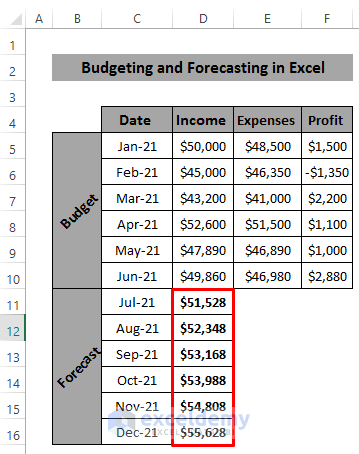
- Create a budget with income, expenses, and profit for six months. We need to find out the budget for the next six months.
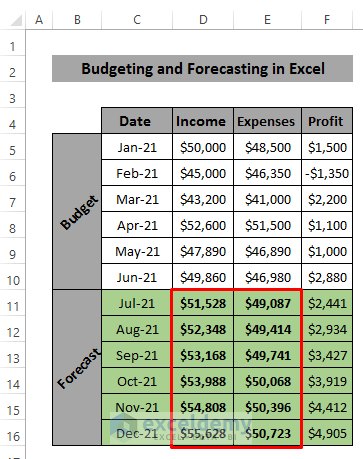
- Select cell D11 where you want to apply the forecast formula.
- Insert the following formula in the formula box
=FORECAST.ETS(C11,$D$5:$D$10,$C$5:$C$10)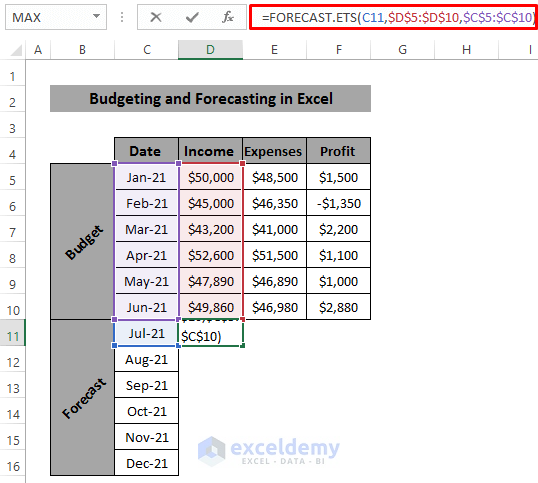
- Press Enter to apply the formula.
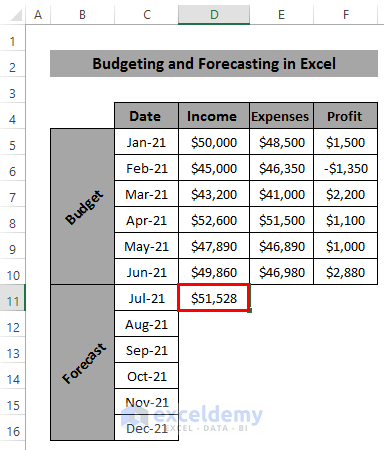
- Drag the Fill handle icon or double-click on it to apply the formula down the column.
- In the Expenses column, select cell E11.
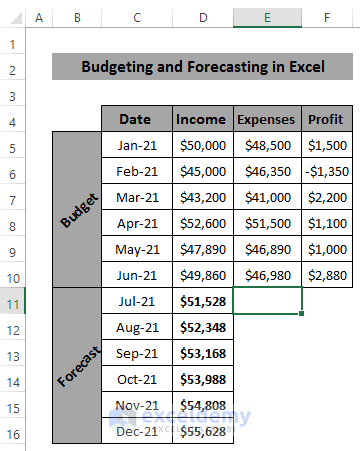
- Use the following formula in the formula box
=FORECAST.ETS(C11,$E$5:$E$10,$C$5:$C$10)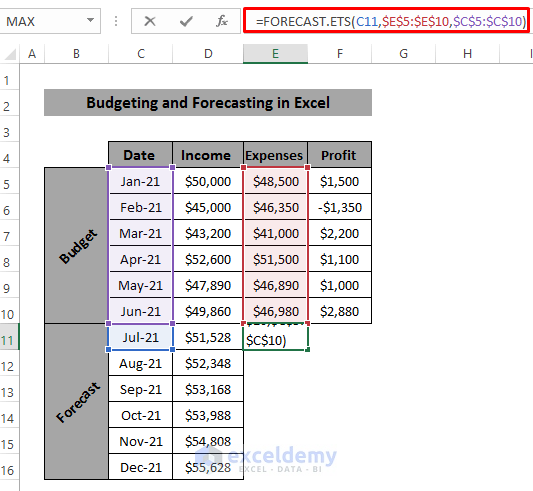
- Press Enter to apply the formula.
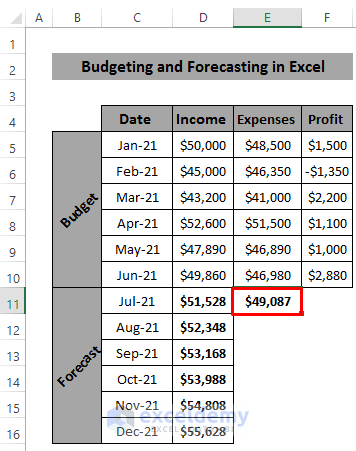
- Drag the Fill handle icon or double-click on it to apply the formula down the column.
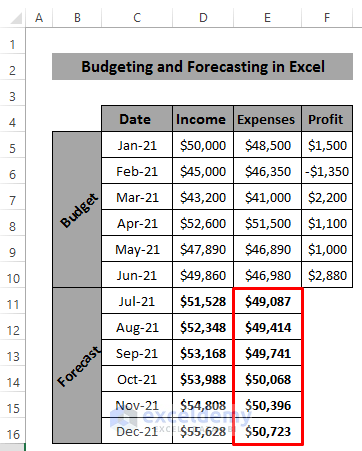
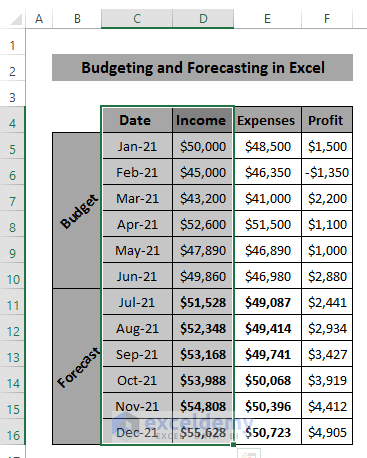
- We have the forecasting for the future six months.
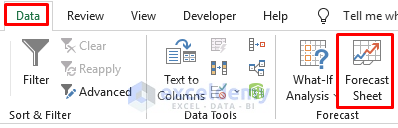
- To make a chart between the date and income or the date and expenses, we can use the Forecast Sheet command in Excel.
- Select the date and income column.
- Go to the Data tab in the ribbon and select the Forecast Sheet from the Forecast group.
- A new dialog box will appear containing the required chart. Click on Create to make the chart.
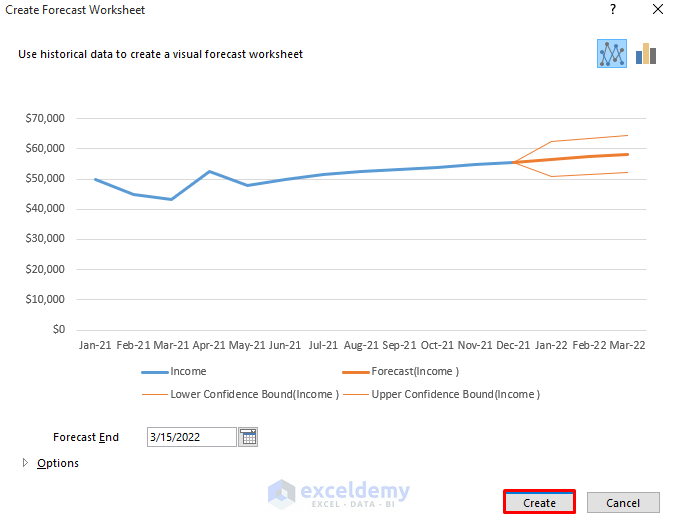
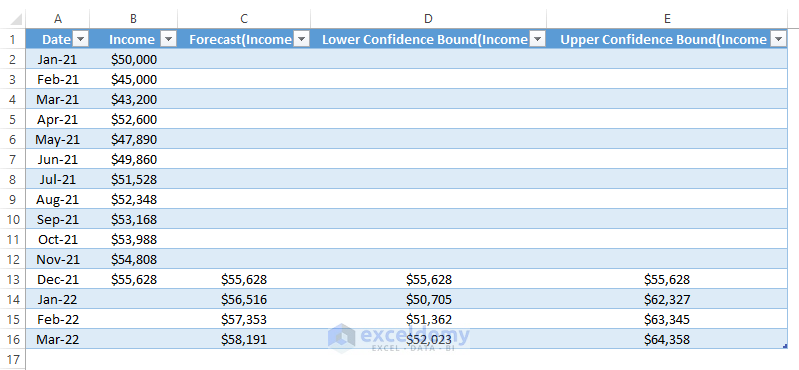
- It will create a dataset including Lower Confidence Bound(Income) and Upper Confidence Bound(Income). The Forecast Sheet can predict the lower and upper income and show them in the chart.
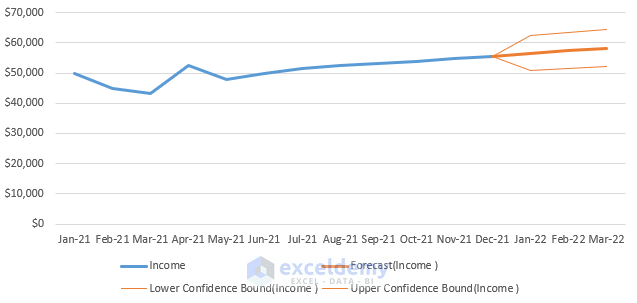
- It will create the following chart.
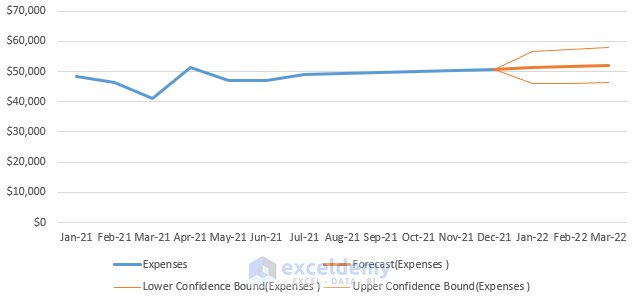
- We can make the same chart for expenses.
Method 2 – Forecasting Using Seasonality in Excel
Steps
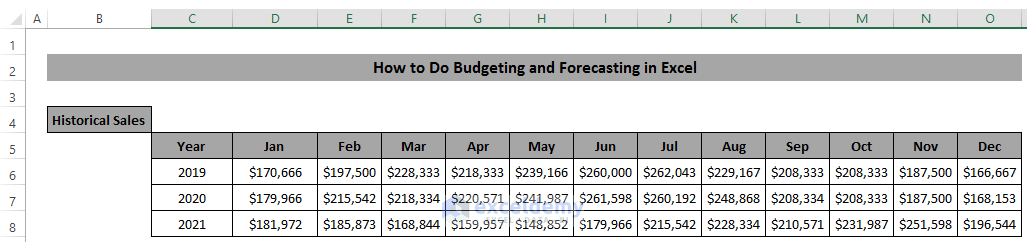
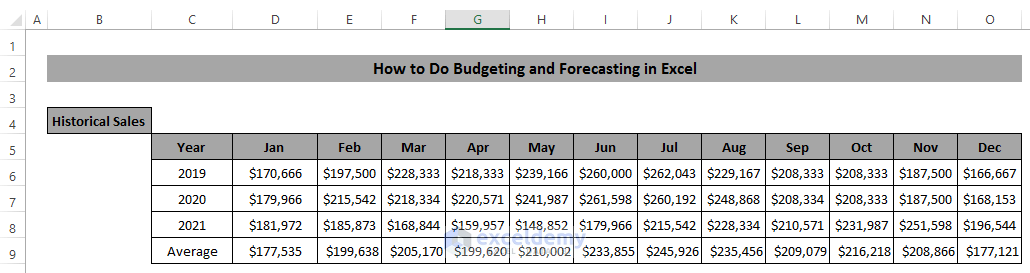
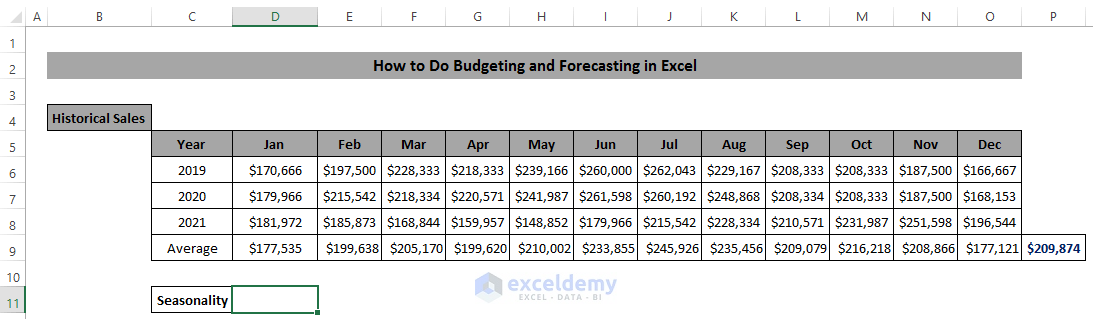
- Create three years sales budget for each month.
- Calculate the average sales for each month. Select cell D9.
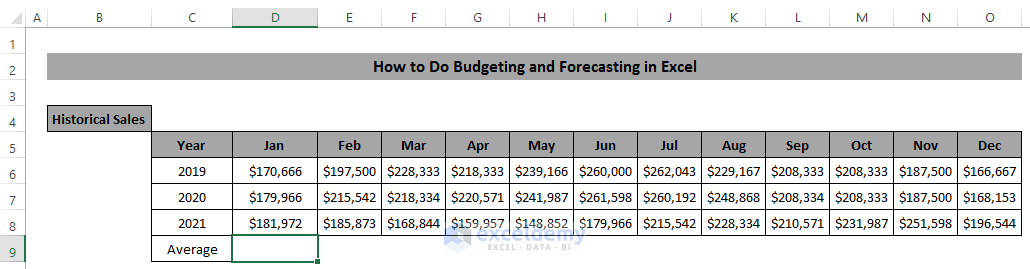
- Use the following formula to get the average for January of those 3 years.
=AVERAGE(D6:D8)
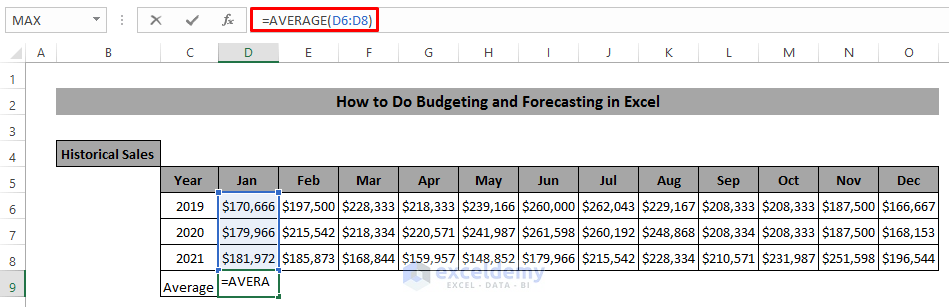
- Press Enter to apply the formula. It will provide the average for January.
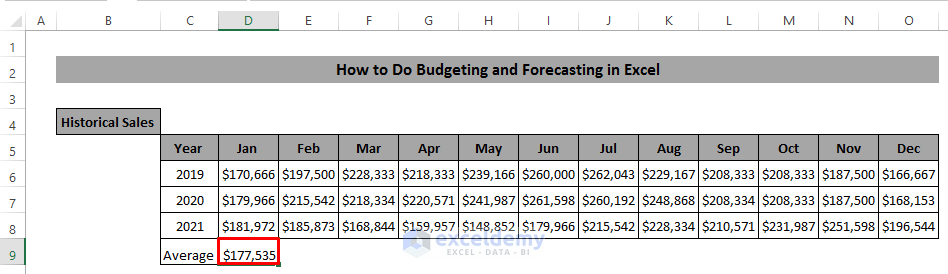
- Drag the Fill handle to the right.
- Select cell P9.
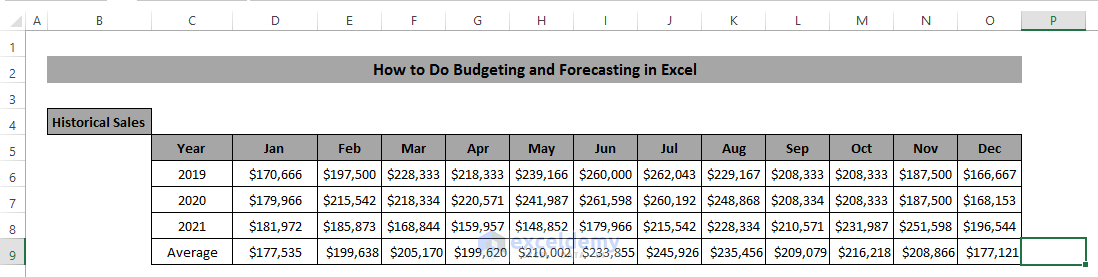
- Use the following formula in the formula box
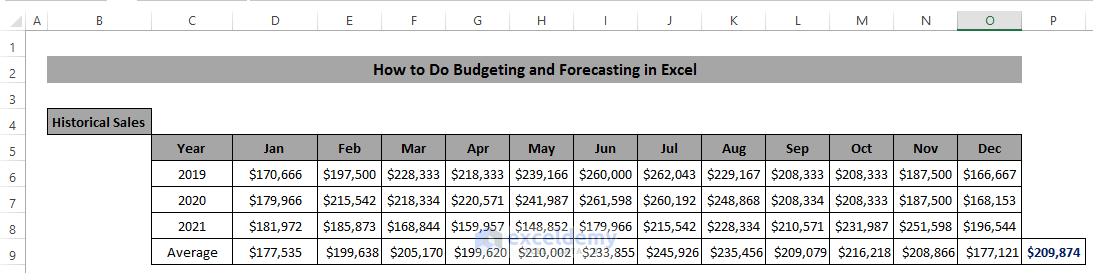
=AVERAGE(D9:O9)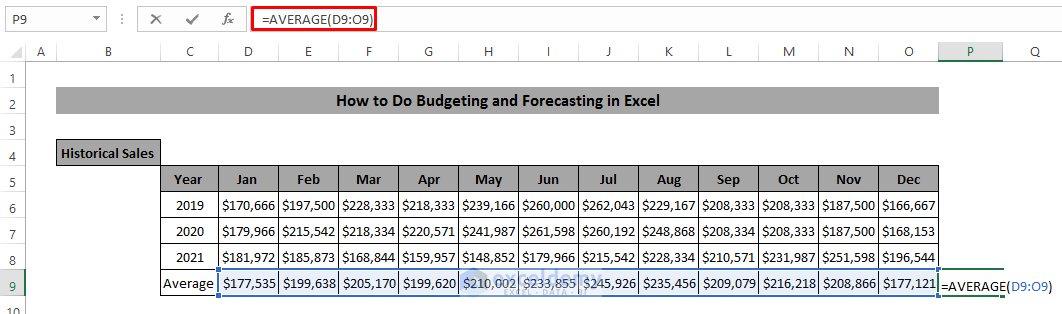
- Press Enter to apply the formula. It will give the average of those three years.
- Select cell D11.
- Use the following formula in the formula box. Here, use the ($) sign to fix cell P9 because we need to use it throughout the row.
=D9/$P$9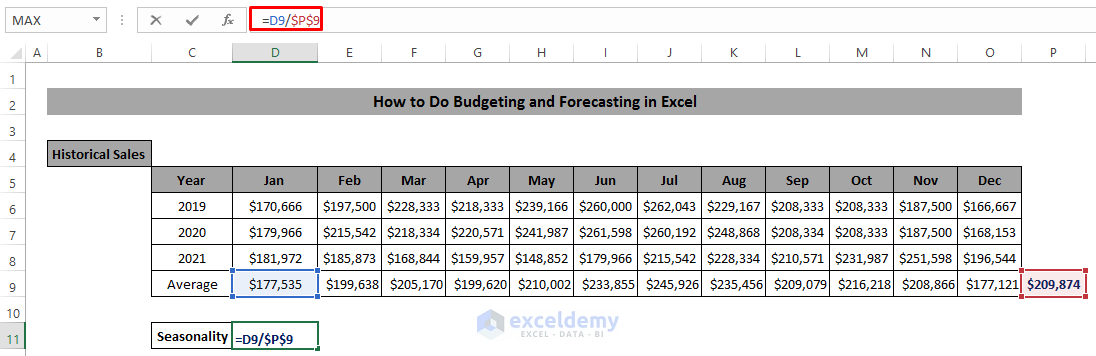
- Press Enter to apply the formula.
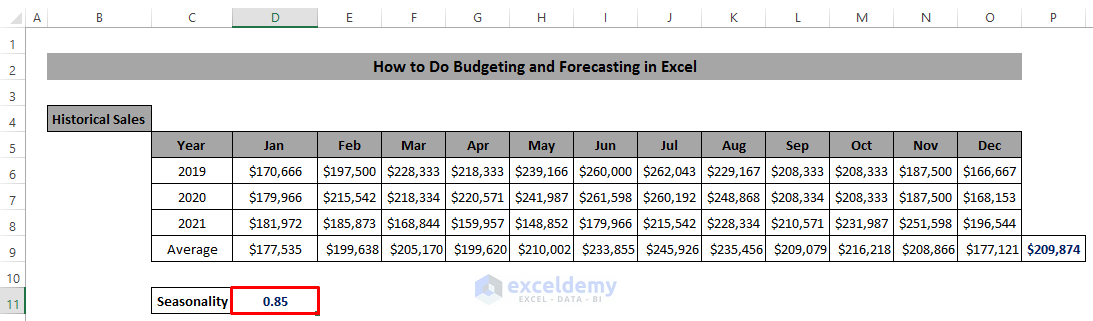
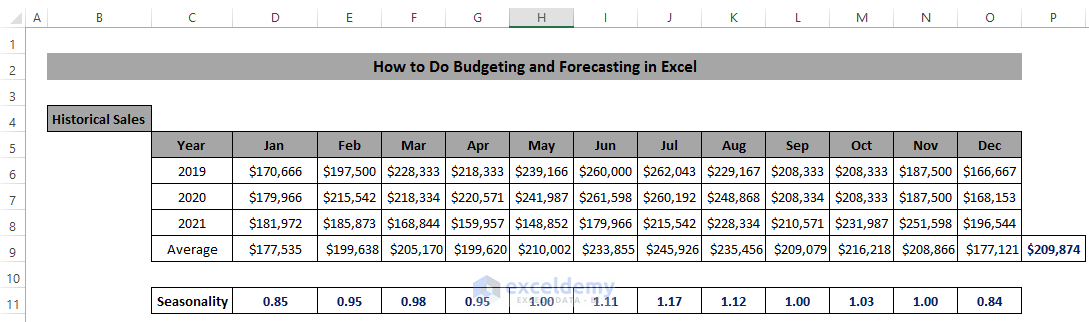
- Drag the Fill handle icon to the desired position, and we will get the seasonality for each month.
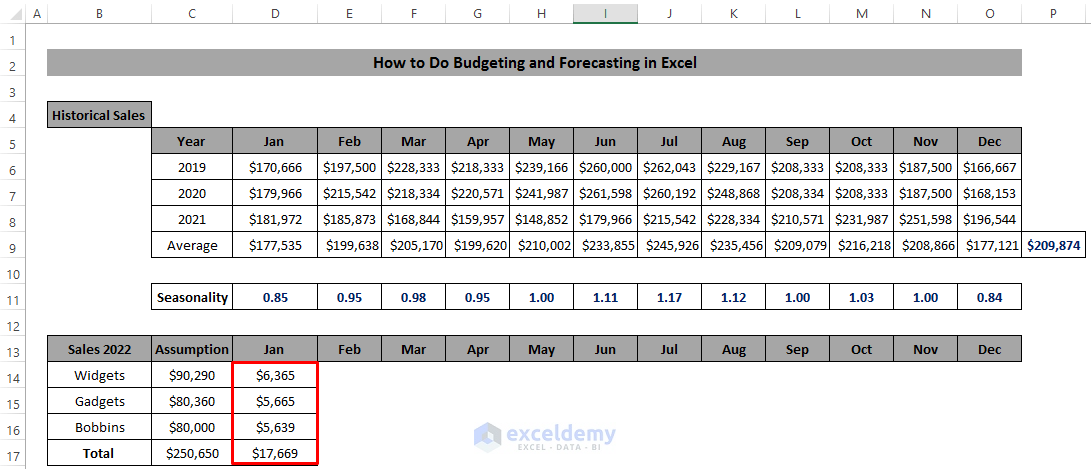
- We need to predict the forecast for future sales. We need to assume the sales for some specific product.
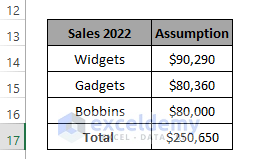
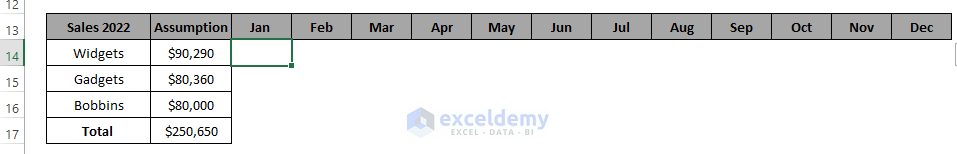
- Using seasonality, we need to calculate the sales for each month for the specific product. Select cell D14.
- Use the following formula in the formula box. Here, we need to fix the seasonality cell that’s why we use the ($) sign.
=($C14/12)*$D$11
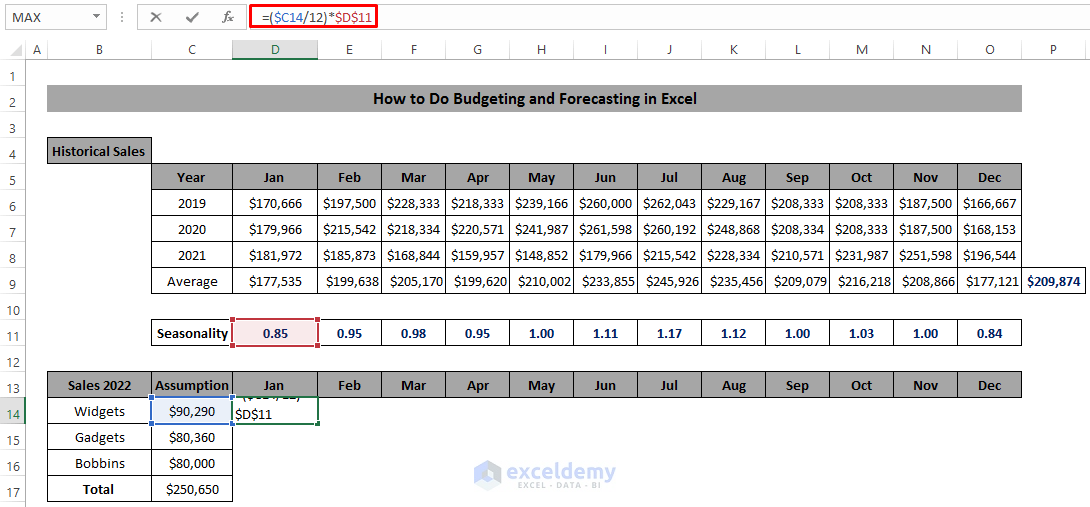
- Press Enter to apply the formula.
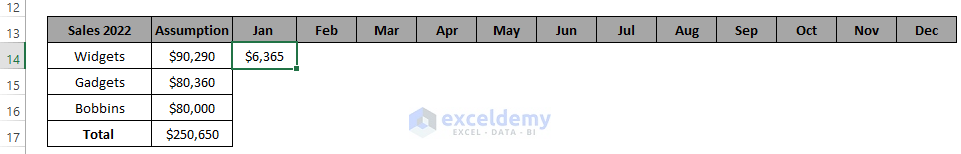
- Drag the Fill handle icon down the column.
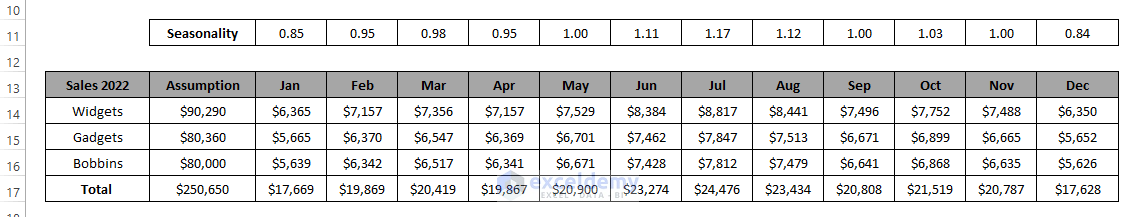
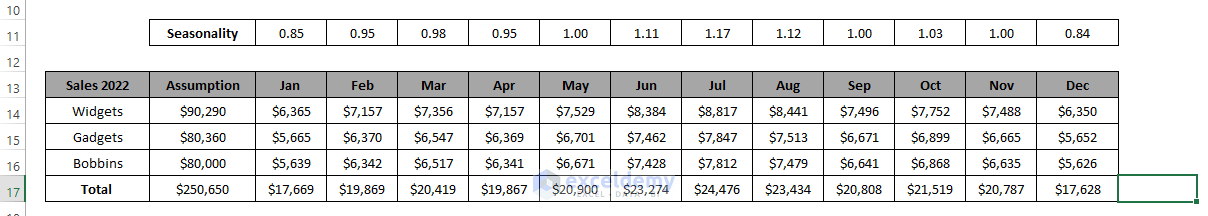
- Apply the same procedure for the other 11 months. It will give the sales of a specific product for a specific month.
- To find out the total sales for the year 2022, we need to add all the month’s cell values using the SUM function. Select cell P17.
- Use the following formula in the formula box.
=SUM(D17:O17)
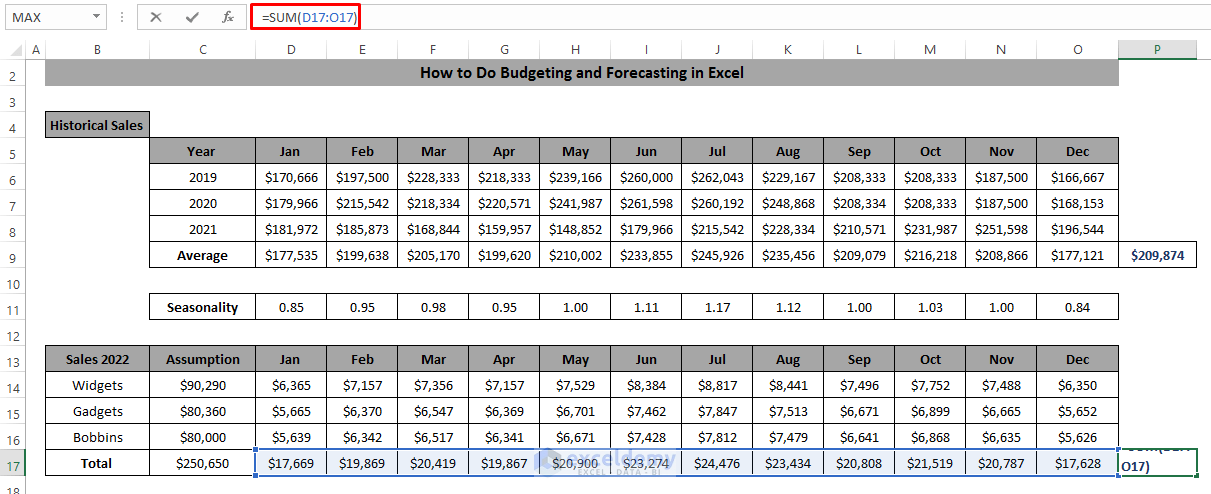
- Press Enter to apply the formula.
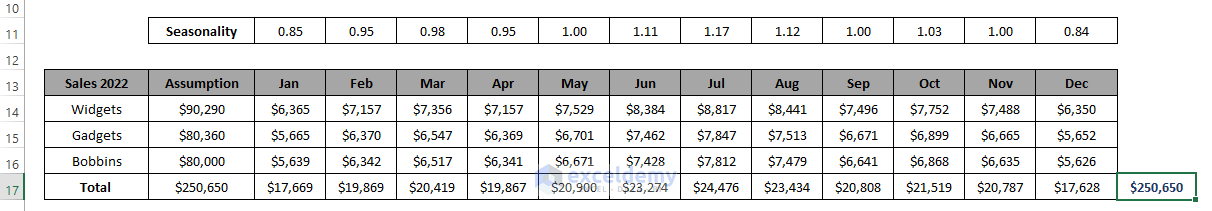
- That is our required forecasting for the year 2022, which is predicted from three different years of sales data and seasonality.
Download the Practice Workbook
Related Articles
- Time Series Forecasting Methods in Excel
- How to Calculate Forecast Accuracy Percentage in Excel
- How to Calculate Accuracy and Precision in Excel
- How to Forecast Sales Using Regression Analysis in Excel
- How to Forecast Call Volume in Excel
<< Go Back to Excel for Finance | Learn Excel
Get FREE Advanced Excel Exercises with Solutions!

