Definition of Regression Analysis
Regression analysis is a powerful statistical method used to analyze the relationship between two or more variables in a dataset. Specifically, it examines how one or more independent variables influence a dependent variable and how these factors are interconnected. This analysis helps us decide which factors to include or ignore when creating a mathematical model.
The simple linear regression equation is:
y = b*x+ a
Where:
- (y) represents the dependent variable.
- (x) represents the independent variable.
- (a) is the intercept of the Y-axis for the regression line.
- (b) is the slope of the regression line.
Dataset Overview
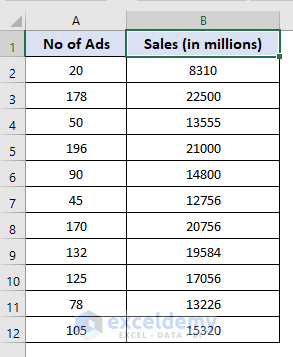
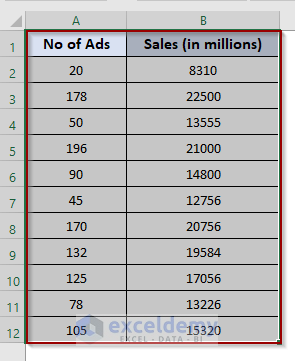
For this article, to show sales prediction we’ll use the following sample dataset that represents the sales amount with the number of advertisements.
Method 1 – Using Excel’s Data Analysis Tool
Step 1 – Active the Data Analysis Tool
By default, the Analysis toolbox in the Data tab is disabled. To enabled it:
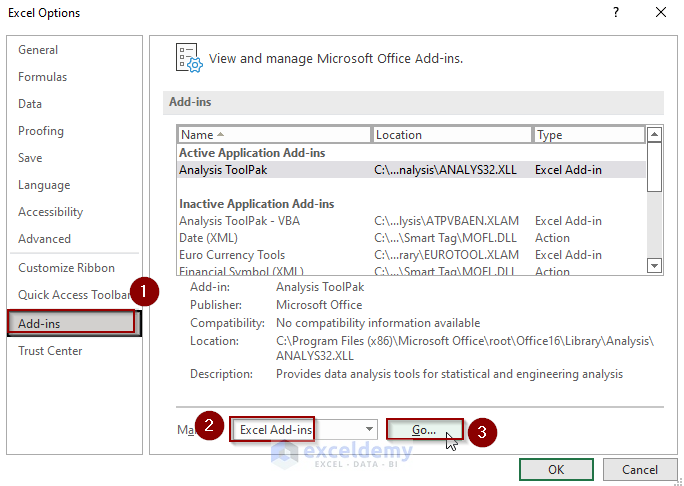
- Go to the Options from the File menu in Excel.
- Open the Add–ins tab.
- Select Excel Add-ins and click Go.
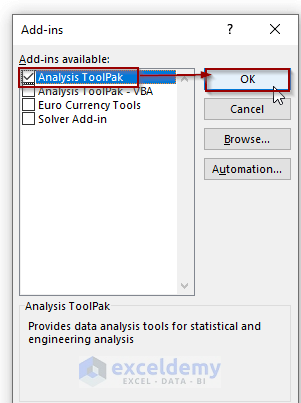
- In the Add-ins window, check the Analysis ToolPak option and hit OK.
Step 2 – Regression Analysis of the Dataset
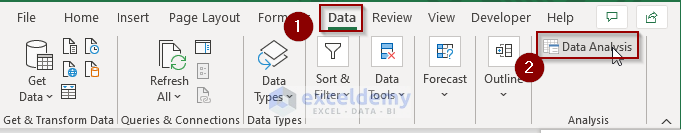
- Go to the Data tab in the Excel ribbon.
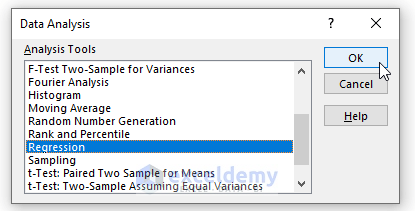
- Click on Data Analysis.
- In the Data Analysis window, choose Regression and click OK.
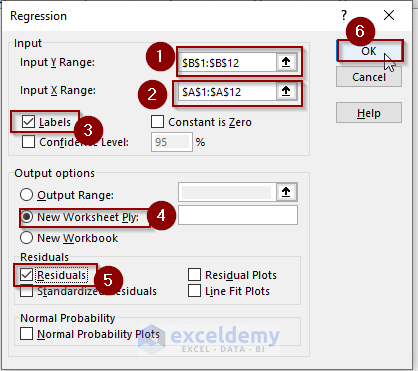
- Configure the following settings:
- Input Y Range: Choose the Sales column.
- Input X Range: Choose the No of Adds column.
- Check the Labels checkbox.
- Click New Worksheet Ply.
- Check the Residuals option.
- Click OK.
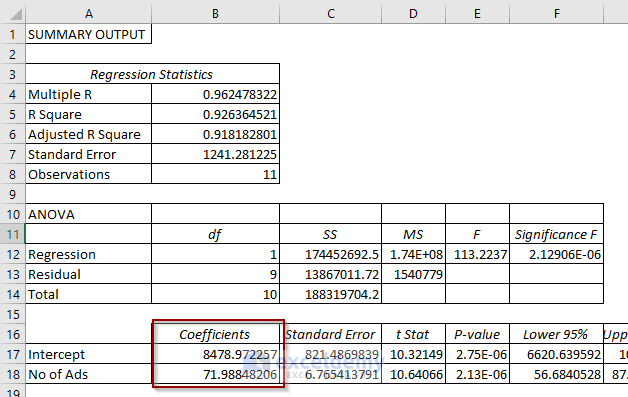
Step 3 – Build the Linear Regression Equation
Use the coefficients Intercept and No of Ads from the analysis result to write the linear regression equation:
y= 71.98 * x + 8478.92
- Where:
- (y) represents sales.
- (x) represents the number of ads.
Now, with the regression equation, we can predict sales for a given no of ads.
Read More: How to Forecast Sales in Excel
Method 2 – Applying Formulas to Forecast Sales Using Regression Analysis in Excel
2.1 Use of LINEST Function
The LINEST function in Excel employs the least-squares regression method to analyze a dataset and calculate the best-fit straight line. It returns an array that describes this straight line. The syntax of the function is:
LINEST(known_y’s, [known_x’s], [const], [stats])
Task: we want to find the coefficients for the linear regression equation y = b*x + a to forecast sales using the LINEST function.
Solution:
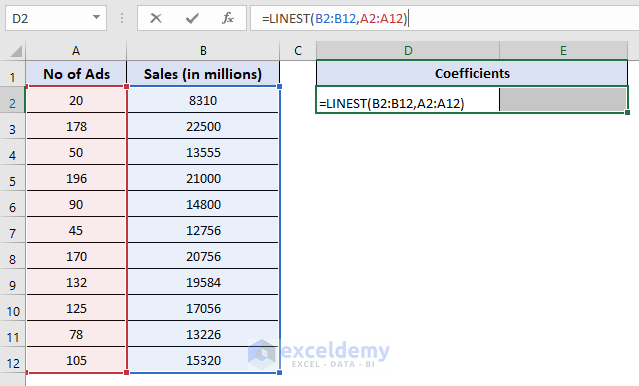
- Select two adjacent cells and enter the following formula:
=LINEST(B2:B12,A2:A12)- Press Ctrl + Shift + Enter.
Formula Explanation: Since the INTERCEPT function returns an array of values, we use Ctrl + Shift + Enter to execute it.
Output: We obtain the coefficients for the linear regression equation:
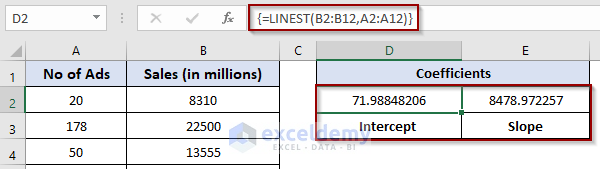
y= 71.98 * x + 8478.92
Where:
- (y) represents sales.
- (x) represents the number of ads.
2.2 Combination of INTERCEPT and SLOPE Functions
- The INTERCEPT function provides the y-axis intercept value for the linear regression line based on given x-values and y-values (syntax: INTERCEPT(known_y’s, known_x’s)).
- The SLOPE function returns the slope of the linear regression line using the same x-values and y-values (syntax: SLOPE(known_y’s, known_x’s)).
Task: We want to find the coefficients for the linear regression equation y = b*x + a b the INTERCEPT and SLOPE functions.
Solution:
- In cell D2, insert the following formula:
=INTERCEPT(B2:B12,A2:A12)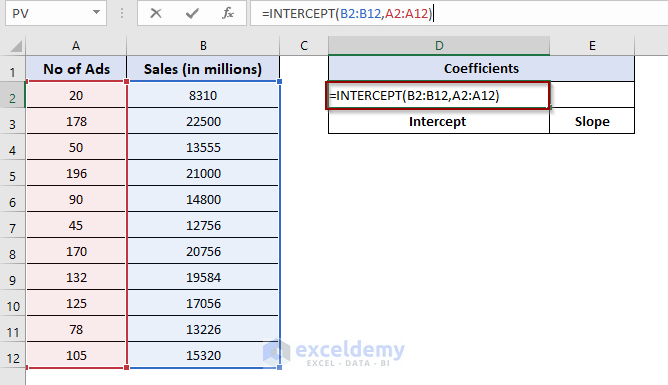
- In cell E2, enter the following formula:
=SLOPE(B2:B12,A2:A12)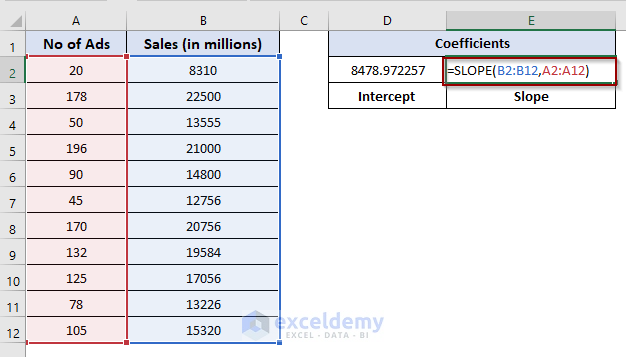
Output: We obtain the coefficients for the linear regression equation:
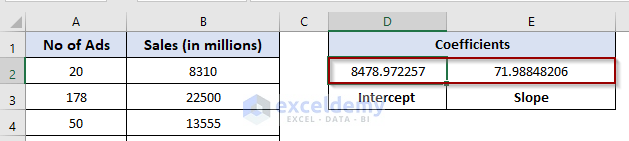 y= 71.98 * x + 8478.92
Where:
- (y) represents sales.
- (x) represents the number of ads.
Read More: How to Forecast Sales Using Historical Data in Excel
Method 3 – Drawing a Linear Regression Graph to Forecast Sales in Excel
Task: Create a graph to determine the linear regression line equation for sales forecasting.
Solution:
- Select the entire dataset.
- Go to the Insert tab.
- Click on the Scatter plot.
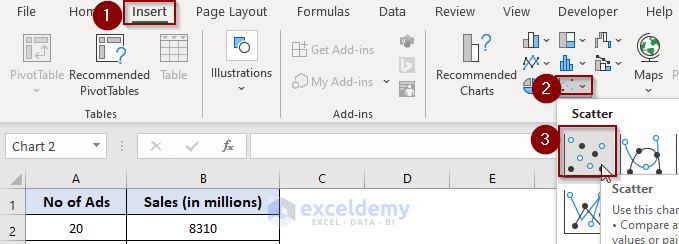
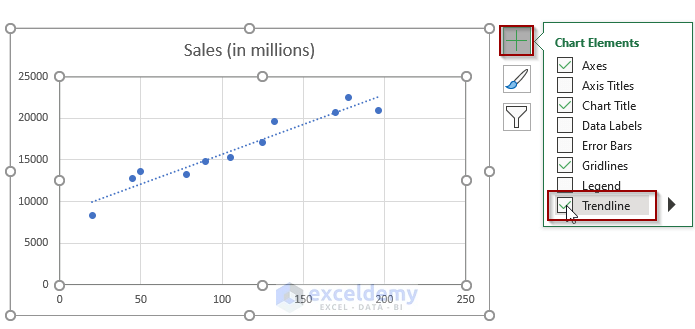
- This adds a graph to the worksheet.
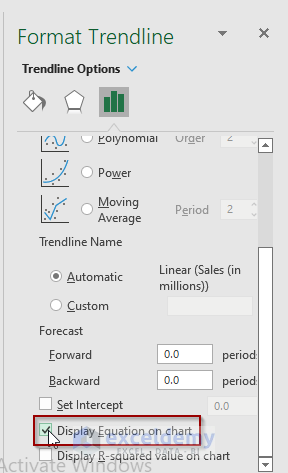
- Choose the Trendline option from Chart Elements.
- Right-click the trendline and select Format Trendline.
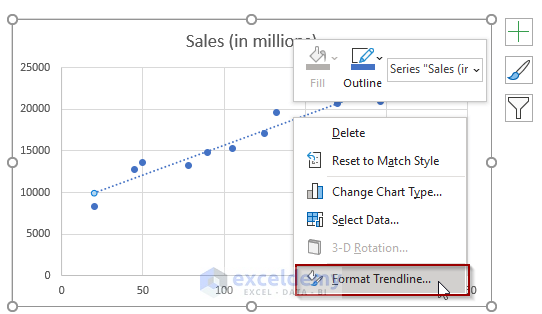
- Check the Display Equation on chart option.
Output: The linear regression line equation is displayed on the plotted graph:
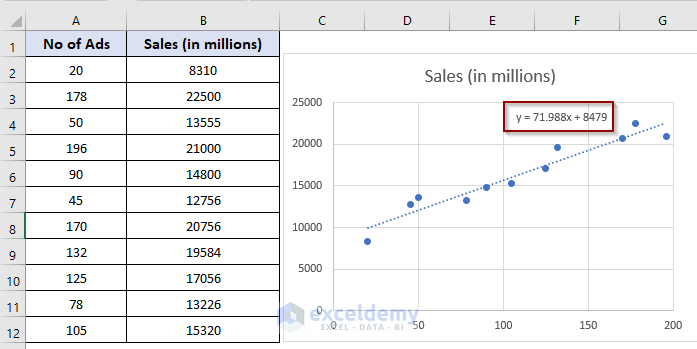
And the equation is-
y= 17.988 x + 8479
Where:
- (y) represents sales.
- (x) represents the number of ads.
Read More: How to Forecast Sales Growth Rate in Excel
Download Practice Workbook
You can download the practice workbook from here:
Related Articles
- How to Calculate Forecast Accuracy Percentage in Excel
- How to Calculate Accuracy and Precision in Excel
- Time Series Forecasting Methods in Excel
- How to Forecast Call Volume in Excel
- How to Do Budgeting and Forecasting in Excel
<< Go Back to Excel for Finance | Learn Excel
Get FREE Advanced Excel Exercises with Solutions!
