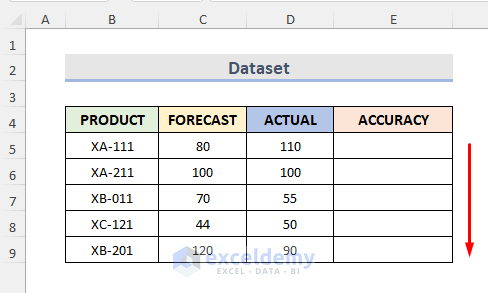
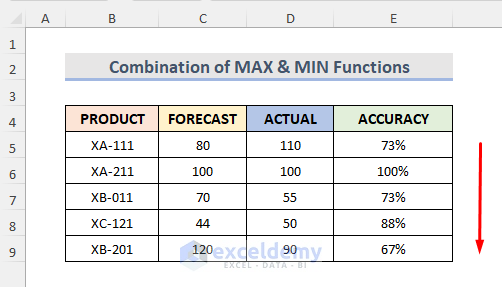
The proximity of experimental values to the true value is known as accuracy. Suppose we have a PRODUCT dataset (B4:E9) with forecasted demand in column C and actual demand in column D. We are going to calculate the accuracy of the forecast.
Method 1 – Apply the IF Function to Calculate Accuracy in Excel
Steps:
- Select cell E5.
- Insert the following formula:
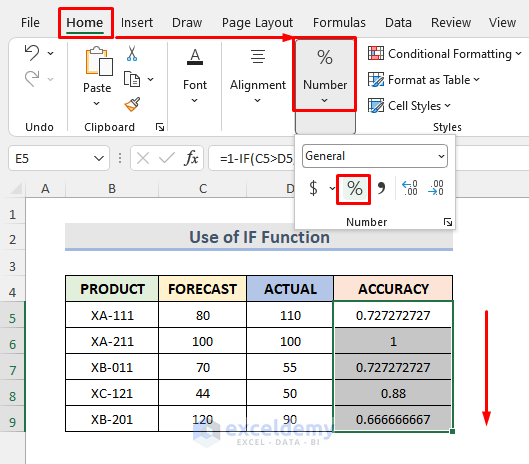
=1-IF(C5>D5,(C5-D5)/D5,(D5-C5)/D5)
- Hit Enter.
- Use the Fill Handle tool to autofill the rest of the column.
- Select the range and go to the Home tab.
- Select ‘%’ from the Number section.
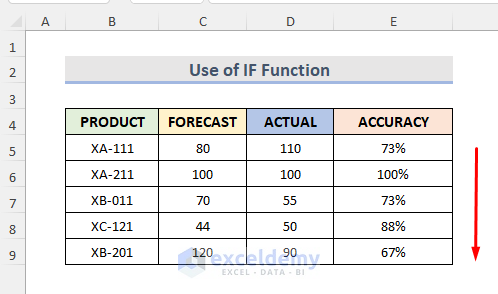
- We can see the accuracy percentages in Excel.
Read More: How to Calculate Forecast Accuracy Percentage in Excel
Method 2 – Calculate Accuracy with the Excel ABS Function
Steps:
- Select Cell E5.
- Insert the following code:
=1-ABS(C5/D5-1)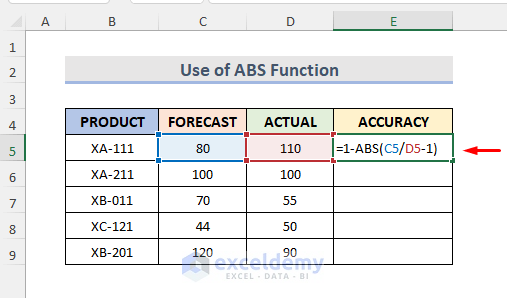
- Press Enter.
- Use the Fill Handle tool for the other cells.
- Select the results and go to the Home tab.
- Select the ‘%’ icon from the Number section.
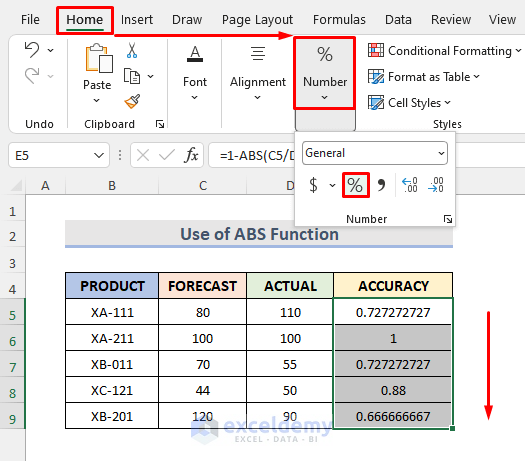
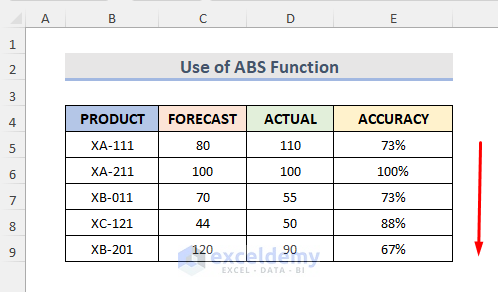
- The accuracy is now displayed in percentages.
Read More: How to Forecast Revenue in Excel
Method 3 – Combine Excel MAX and MIN Functions to Get Accuracy
Steps:
- Select Cell E5.
- Insert the following code:
=1-(MAX(C5:D5)-MIN(C5:D5))/D5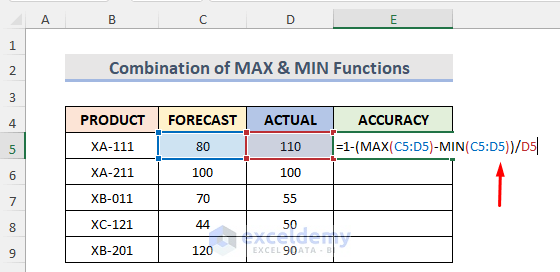
- Press the Enter key.
- Use the Fill Handle tool to apply the formula to the other cells.
- Select the result range.
- Go to the Home tab.
- Select the ‘%’ icon from the Number section.
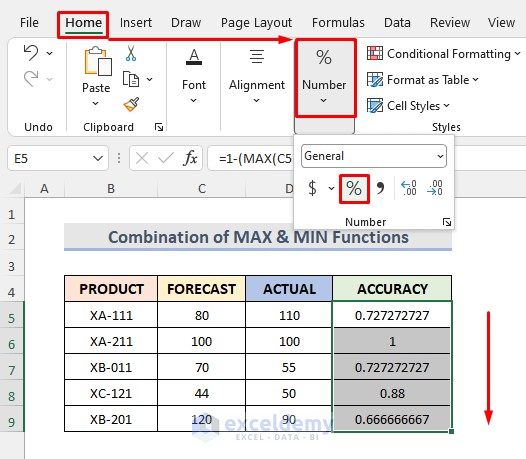
- We can see the result in the column.
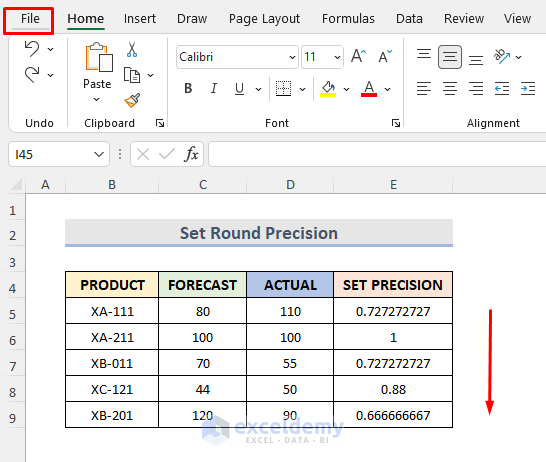
How to Round the Precision After Calculating Accuracy in Excel
Steps:
- Go to the File tab.
- Select Options.
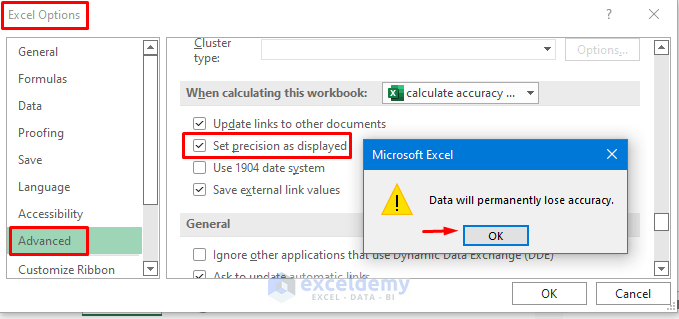
- An Excel Options window will pop out.
- Go to the Advanced group.
- Check the ‘Set precision as displayed’ option from the ‘When calculating this workbook’ section.
- A Microsoft Excel warning message shows up. Click OK to continue the process.
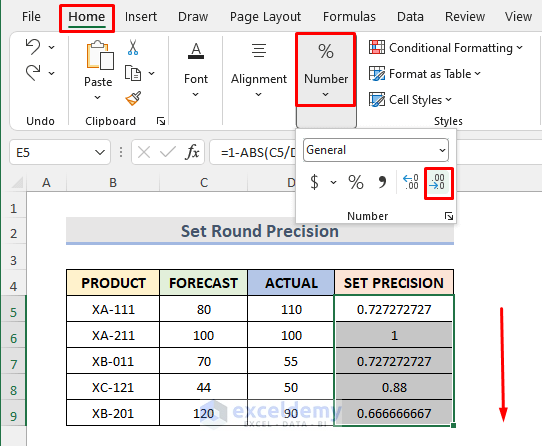
- We will decrease the decimal to set rounding precision.
- Select the cell range E5:E9.
- Go to the Home tab.
- From the Number section, select the Decrease Decimal option.
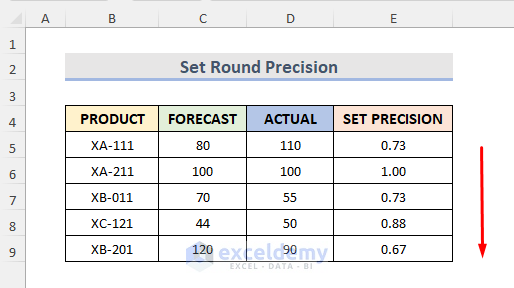
- We will see the result below. The selected cells are rounded with precision.
Read More: How to Forecast Sales Using Regression Analysis in Excel
Things to Remember
- If the Actual value is much lower than the Demand value, the function will return a negative or zero accuracy.
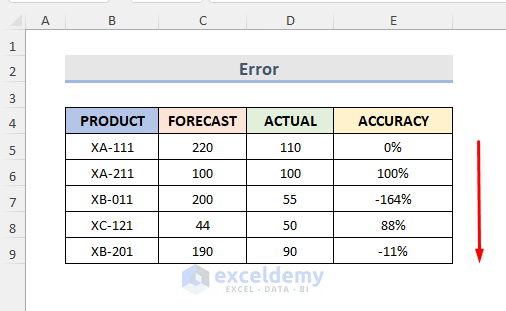
- To calculate the Error percentage instead of the accuracy percentage in the case of a huge gap between the Actual & Demand values, use the following formula:
=ABS(C5/D5-1)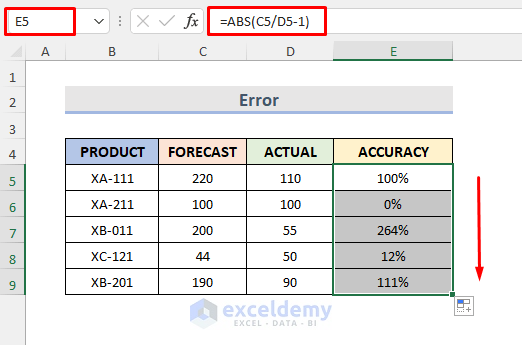
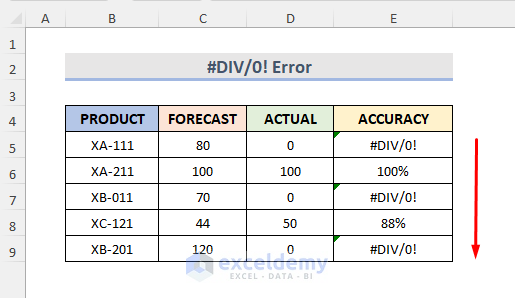
- The #DIV/0! Error occurs when the Actual value is 0 like in the screenshot below.
- We may lose accuracy when the value is set to round with precision as it deletes extra data permanently.
- Press Alt + T + O keys to open the Excel Options feature directly.
Practice Workbook
Related Articles
- Time Series Forecasting Methods in Excel
- How to Forecast Call Volume in Excel
- How to Do Budgeting and Forecasting in Excel
<< Go Back to Excel for Finance | Learn Excel
Get FREE Advanced Excel Exercises with Solutions!
