Method 1 – Using the GROWTH Function
We can use the GROWTH function to forecast any kind of growth rate in Excel.
The GROWTH function predicts an exponential growth rate which follows the formula below:
y = b*m^xThe function will return a “y” value based on the “x” values.
Function syntax:
GROWTH(known_y’s, [known_x’s], [new_x’s], [const])
Function Arguments:
- Known_y’s: This field is mandatory. Insert a set of past y values according to the formula y = b*m^x.
- Known_x’s: Optional. The set of past x values from the formula y=b*m^x.
- New_x’s: Optional. Insert a new value of x for which you want to get the value of y.
- const: Optional. If const is TRUE, b is calculated normally. But if const is FALSE, b is set to 1. Thus, y = b*m^x becomes y=m*x.
1.1 – Forecast Sales Growth Rate
To forecast the sales growth rate, you will need historical time-based data, one date or time entry for creating the timeline and another column for their corresponding values.
We’ll use a table of two columns to demonstrate. The first column is the Year column that depicts the chronological timeline. The second column contains year-based corresponding Sales in dollars.
Based on these data, we will predict the sales amount for the year 2014 in dollars.
Steps:
- Click on cell C14 and insert the following formula:
=GROWTH(C5:C13,B5:B13,B14)Here, C5:C13 is the Known_y’s, B5:B13 is the Known_x’s and B14 is the New_x’s.
- Press ENTER.
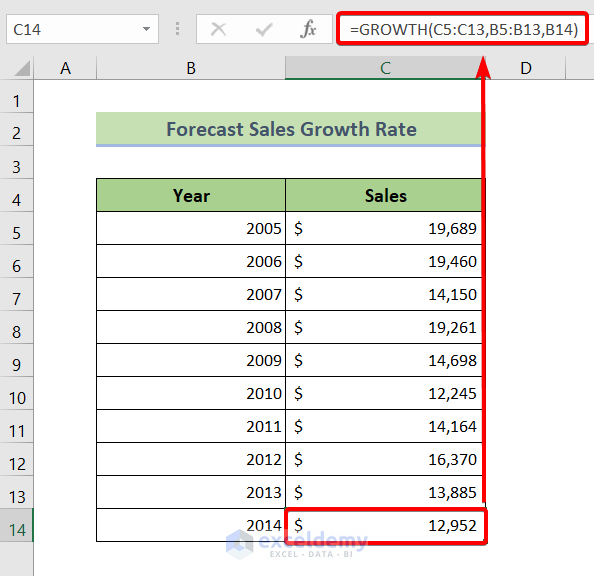
The sales amount for the year 2014 will be $12,952.
Read More: How to Forecast Sales Using Historical Data in Excel
1.2 – Forecast Revenue Growth Rate
Suppose we have a database of revenue growth rates in percentages from the year 2005 to 2013. Based on these data, we’ll forecast the revenue growth rate for the years 2014, 2015, and 2016.
Steps:
- Select cells C14, C15, and C16 to insert the following formula:
=GROWTH(C5:C13,B5:B13,B14:B16)Here,
- C5:C13 is the Known_y’s.
- B5:B13 is the Known_x’s.
- B14:B16 is the New_x’s.
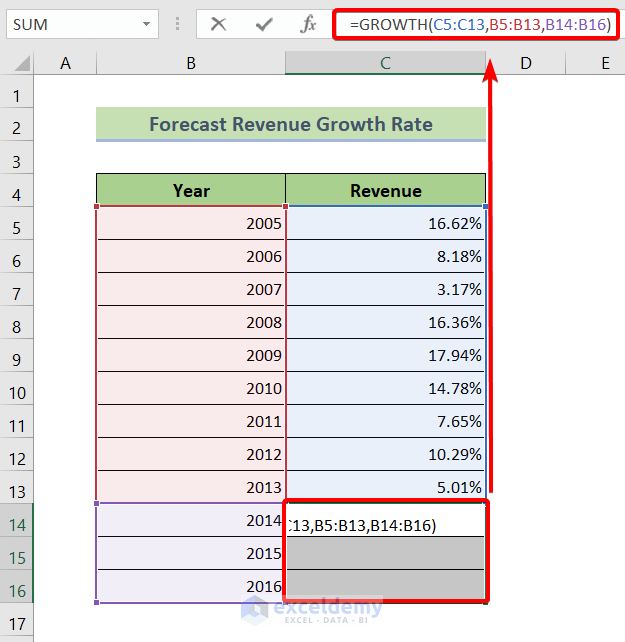
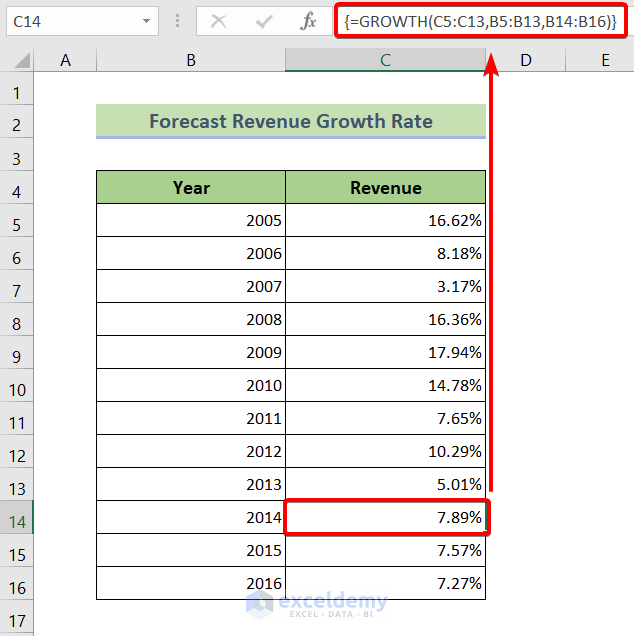
- Press CTRL + SHIFT + ENTER to insert the above formula as an array formula.
The revenue growth rates in percentage are forecast, namely 7.89%, 7.57%, and 7.27% respectively.
Read More: How to Forecast Revenue Growth in Excel
1.3 – Calculate and Forecast Annual Sales Growth Rate
Now we will forecast the annual sales growth rate for the next 10 years based on past history.
Steps:
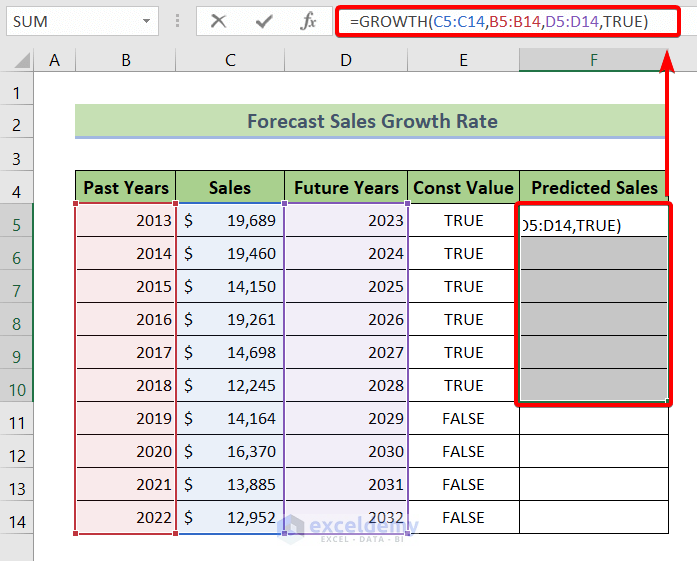
- Select cells F5 to F10 to insert the following formula:
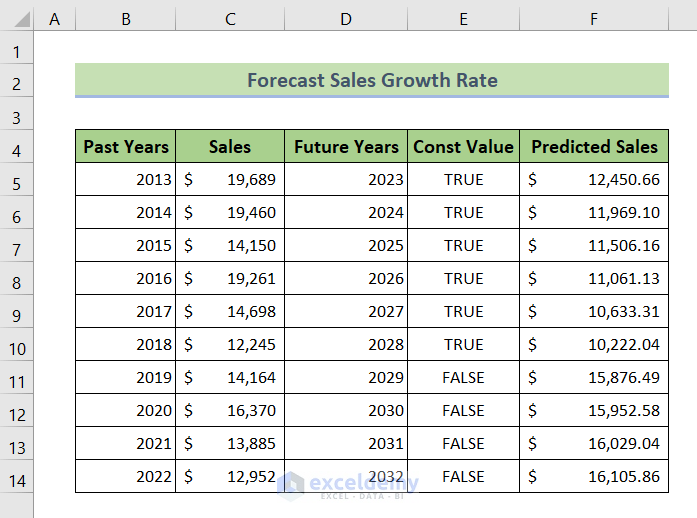
=GROWTH(C5:C14,B5:B14,D5:D14,TRUE)In the above formula:
- C5:C14 is the Known_y’s.
- B5:B14 is the Known_x’s.
- D5:D14 is the New_x’s.
- TRUE is the const.
- Press CTRL + SHIFT + ENTER to insert the above formula as an array formula.
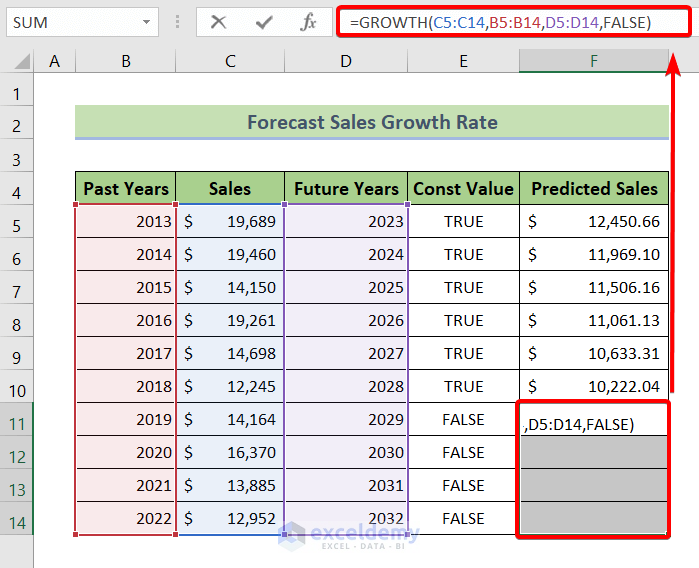
- Select cell F11 to F14 to insert the following formula:
=GROWTH(C5:C14,B5:B14,D5:D14,FALSE)- C5:C14 is the Known_y’s.
- B5:B14 is the Known_x’s.
- D5:D14 is the New_x’s.
- FALSE is the const.
- Press CTRL + SHIFT + ENTER to insert the above formula as an array formula.
The forecast result of the annual sales growth rate for the next 10 years is returned:
Read More: How to Forecast Sales in Excel
Method 2 – Using the Forecast Sheet to Forecast the Annual Revenue Growth Rate
Excel has embedded an amazing feature that can forecast annual growth rates using graphs.
Steps:
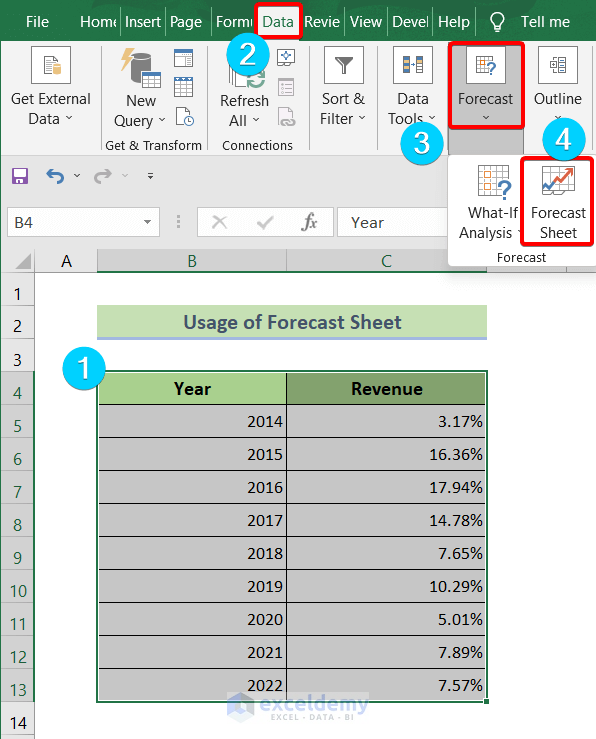
- Create a set of data that represents data or a time-based timeline. We will use the Year column for this purpose.
- Take a set of corresponding values for the data or time-based timeline. For this purpose, we have created the Revenue column as in the image below.
- Select the whole data table.
- Go to the Data tab from the main ribbon.
- From the Forecast group, choose Forecast Sheet.
The Create Forecast Worksheet dialog box will appear.
- Select line graph or column chart as you prefer.
- From the Forecast End box, select a timeline to limit the prediction period.
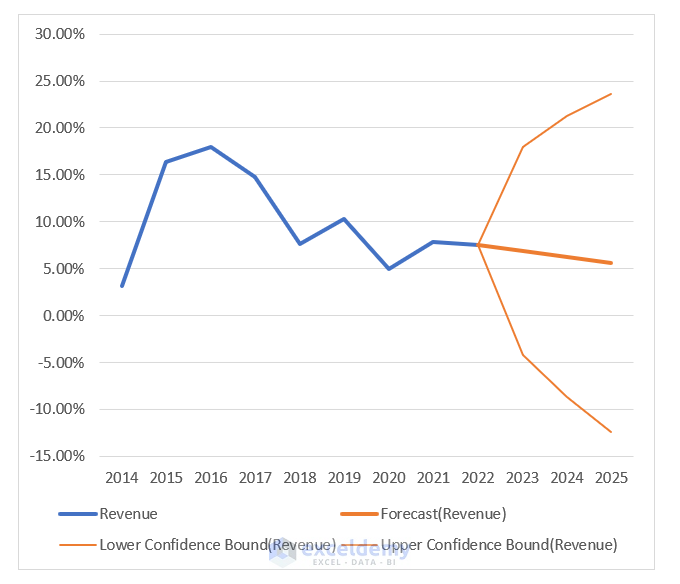
- Click the Create button to generate a forecast growth rate graph.
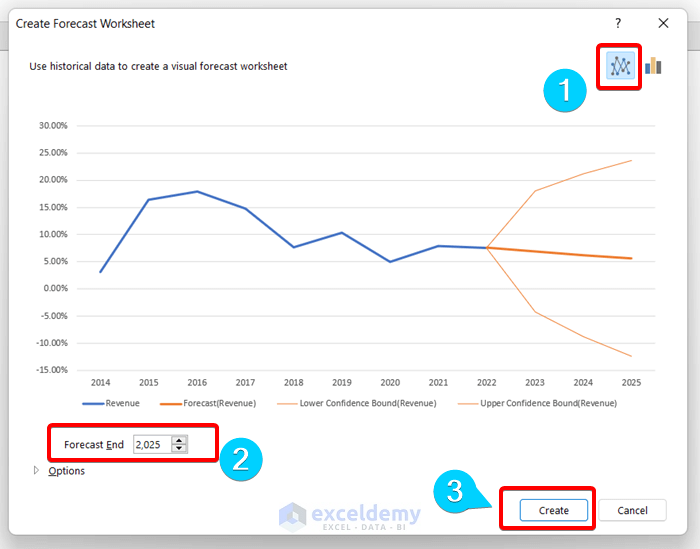
A forecasting line graph is returned as in the picture below:
Read More: How to Forecast Revenue in Excel
Things to Remember
- Press CTRL + SHIFT + ENTER to insert an array formula.
Download Practice Workbook
Related Articles
<< Go Back to Excel for Finance | Learn Excel
Get FREE Advanced Excel Exercises with Solutions!
