Dataset Overview
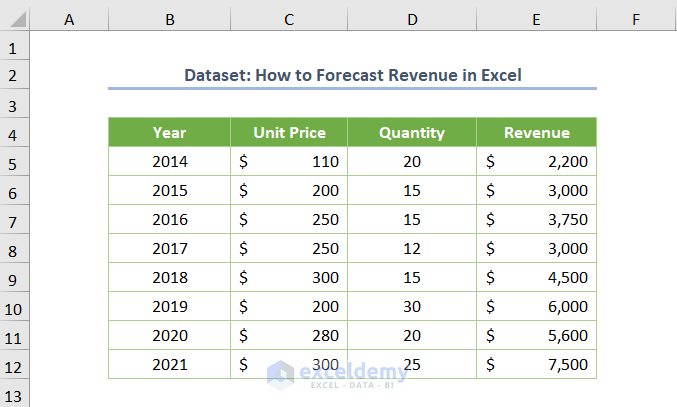
Revenue simply refers to the earnings of an organization or company. For instance, consider the revenue (in cells E5:E14) of a company from 2014 to 2021. In this case, revenue is calculated by multiplying the unit price and quantity.
Now, let’s explore methods for forecasting revenue based on the given data. We’ll cover three methods for yearly revenue forecasting, followed by two methods for monthly forecasting, and one method for date-wise forecasting.
Method 1 – Using TREND Function for Yearly Revenue Forecasting
Suppose you want to forecast revenue for 2022, 2023, and 2024 based on historical revenue data from 2014 to 2021.
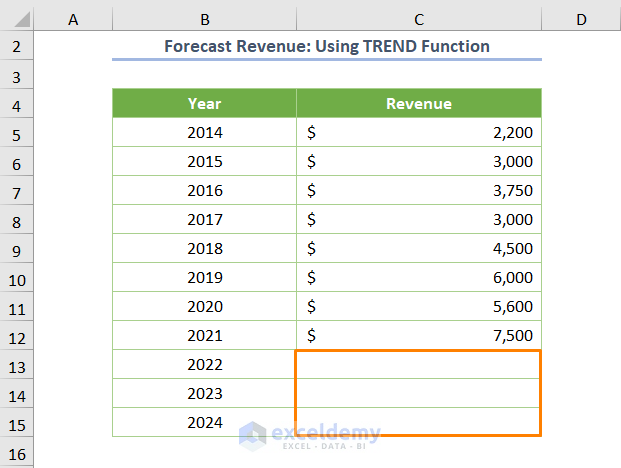
Apply the TREND function:
The syntax of the TREND function is:
=TREND(known_y’s, [known_x’s], [new_x’s], [const])
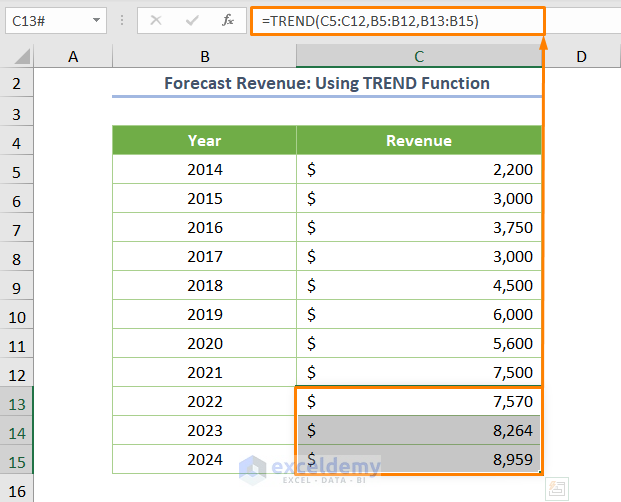
For this dataset, the formula would be:
=TREND(C5:C12,B5:B12,B13:B15)
Here:
- C5:C12 represents historical revenue (known_y’s argument).
- B5:B12 corresponds to the corresponding years (known_x’s).
- B13:B15 represents the years for which you want to forecast revenue (new_x’s).
Read More: How to Forecast Revenue Growth in Excel
Method 2 – Applying the FORECAST Function
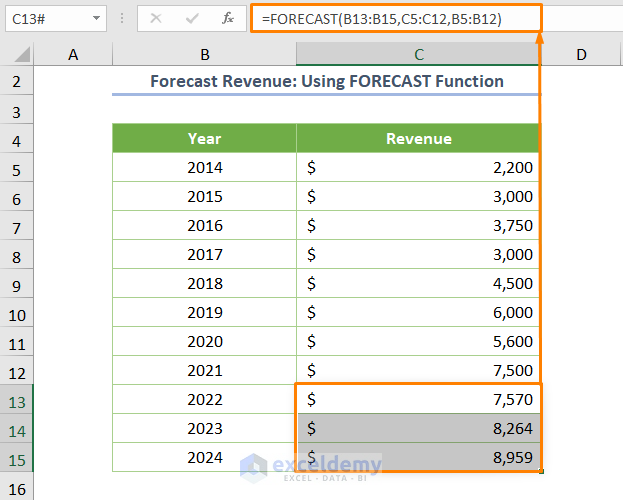
Similarly, you can use the FORECAST function or the FORECAST.LINEAR function to forecast revenue for the upcoming year. The formula is as follows:
=FORECAST(B13:B15,C5:C12,B5:B12)
Here:
- new_x’s argument is located at the first position, where it was in the last position in the TREND function.
Though there is a slight difference in the case of placing the arguments, the output remains the same.
Note: The order of arguments is slightly different from the TREND function, but the output remains the same. The key difference is that the TREND function can predict new values and determine current trends based on historical data, while the FORECAST function predicts only new values.
Read More: How to Forecast in Excel Based on Historical Data
Method 3 – Using the GROWTH Function for Yearly Revenue Forecasting
The function allows you to forecast revenue based on an exponential relationship. The formula for this dataset would be:
=GROWTH(C5:C12,B5:B12,B13:B15)
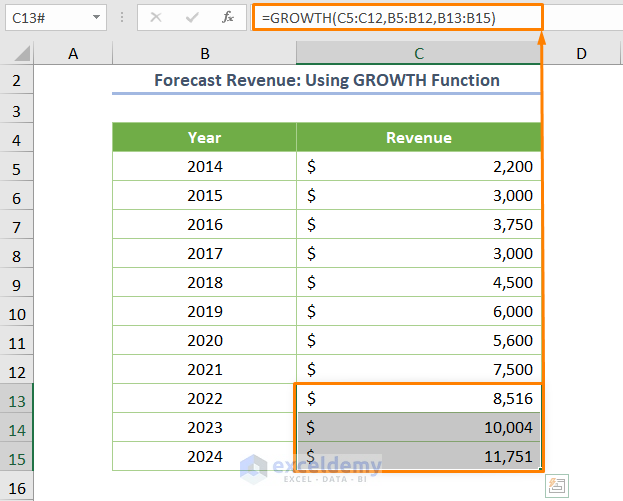
The output will differ from the TREND function because GROWTH considers exponential relationships.
Read More: Time Series Forecasting Methods in Excel
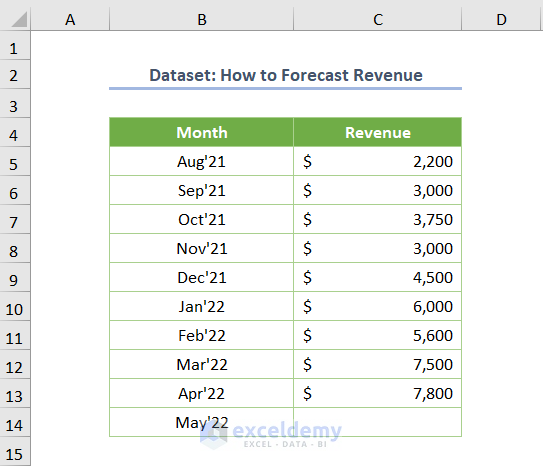
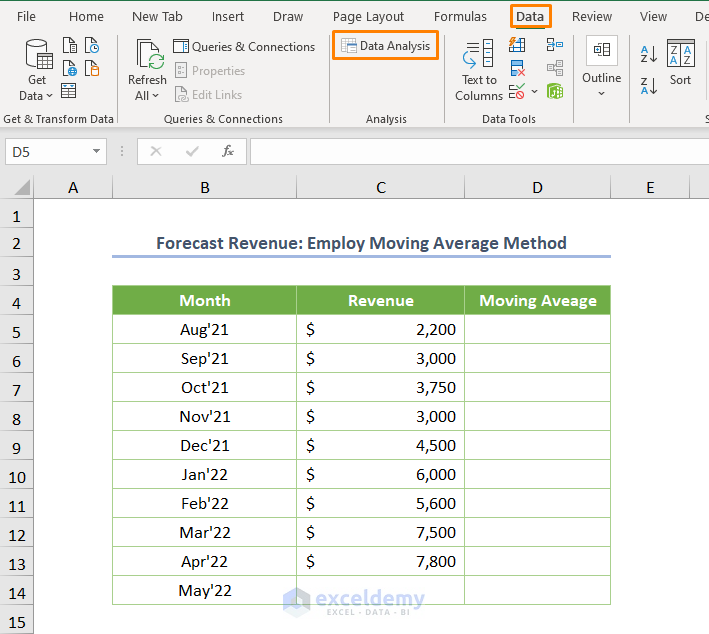
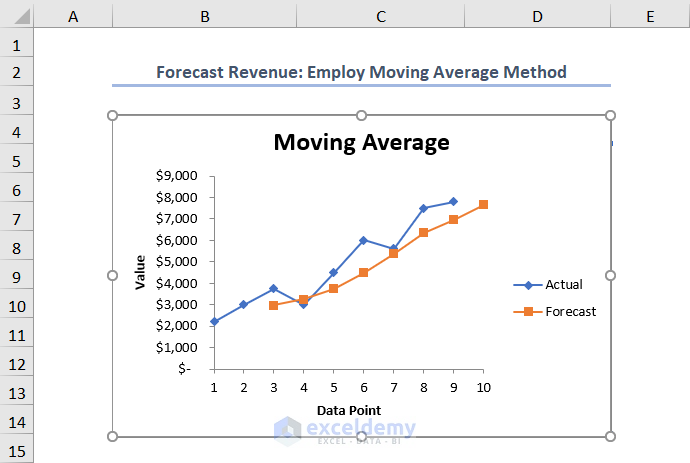
Method 4 – Simple Moving Average Method for Monthly Revenue Forecasting
If you have historical revenue data on a monthly basis, you cannot directly use the TREND, FORECAST, or GROWTH functions. Instead, consider the Moving Average method:
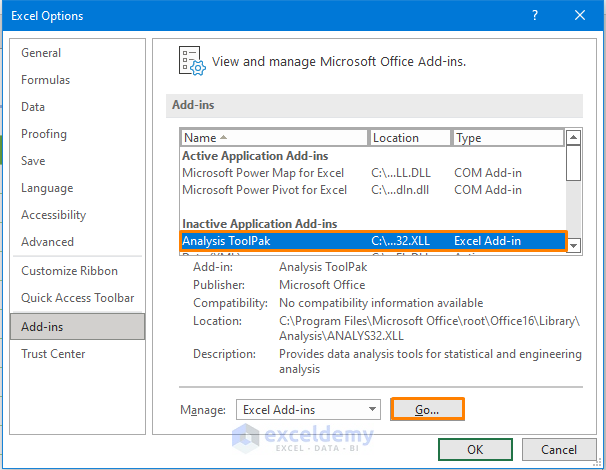
- Go to File and select Options to open the Excel Options dialog box.
- Hover over Add-ins, select Analysis ToolPak, and click Go.
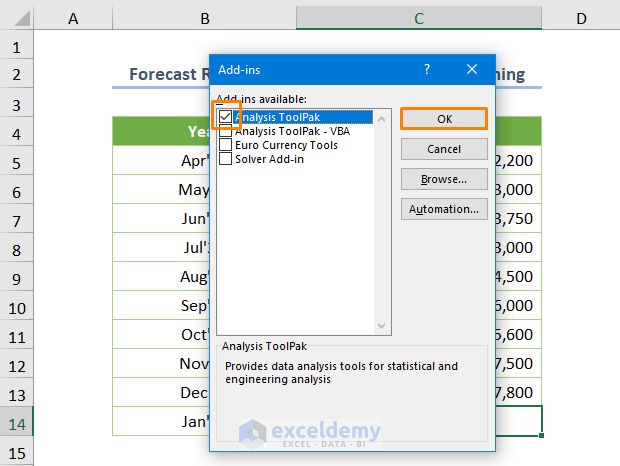
- Check the box next to the Analysis ToolPak add-in and press OK.
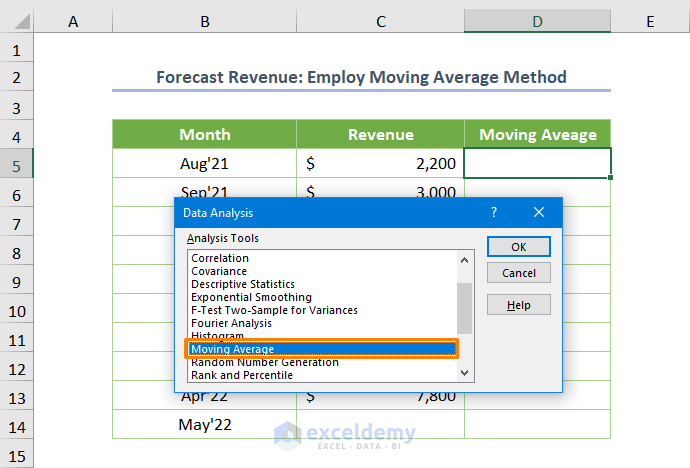
- Go to the Data tab and click on Data Analysis from the Analysis ribbon.
- Choose the Moving Average tool and click OK.
- Specify the Input Range as $C$5:$C$14, set the Interval to 3, and define the Output Range as $D$5:$D$14.
- Check the box for Chart Output and press OK.
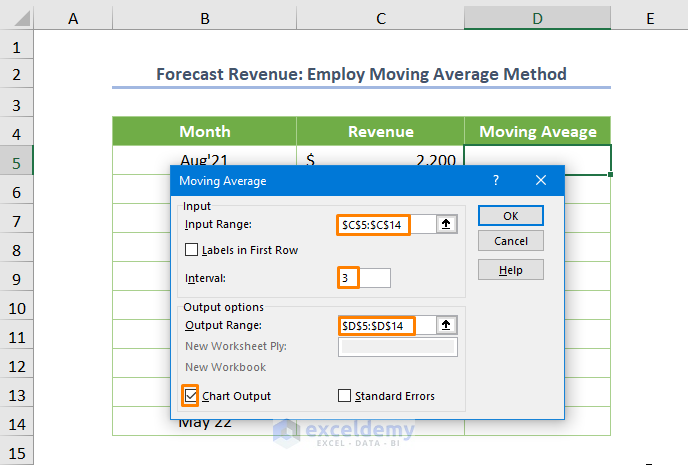
Note: The interval of 3 means calculating the Moving Average over 3 months. For example, if you want to calculate the Moving Average for 5 months, input the value 5.
You’ll get the predicted revenue for May ’22 in cell D14.
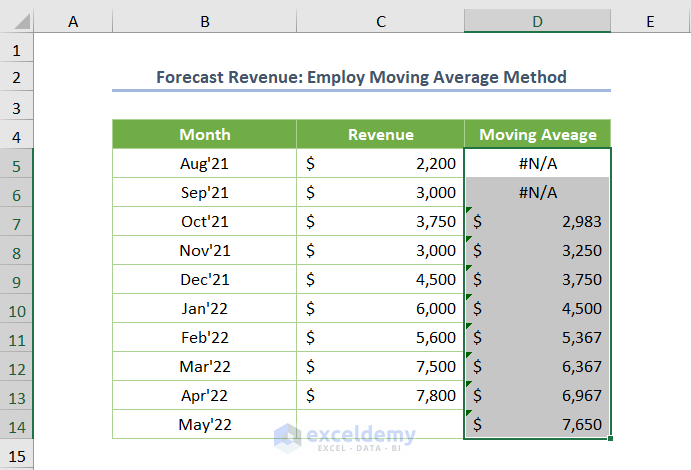
For better visualization, create a chart.
Read More: How to Forecast Sales Using Regression Analysis in Excel
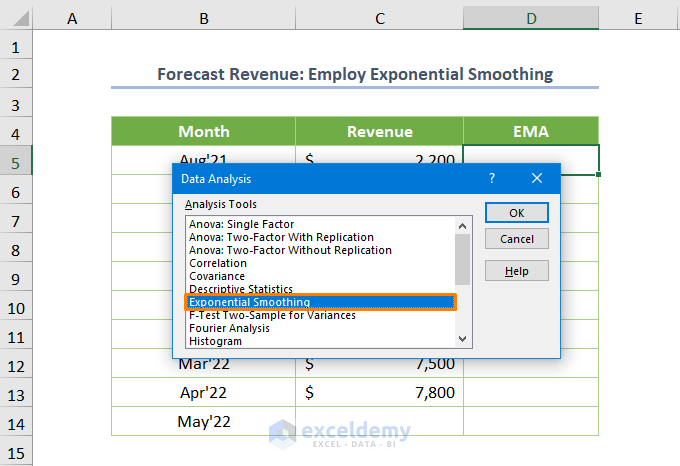
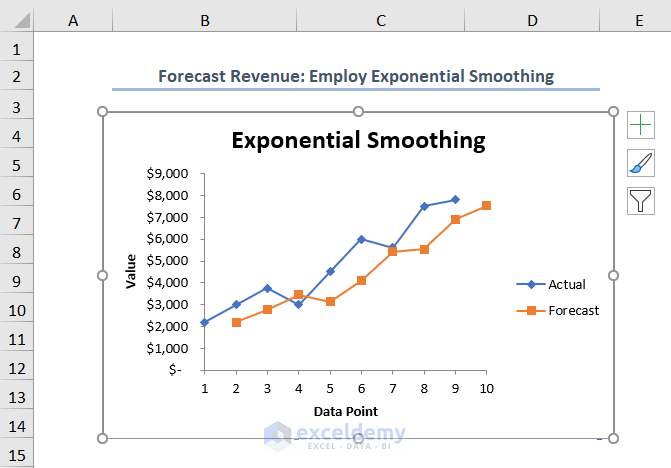
Method 5 – Exponential Smoothing for Monthly Revenue Forecasting
To achieve more accurate revenue forecasts, consider using the Exponential Smoothing or Exponential Moving Average (EMA) method. Follow these steps:
- Select the Exponential Smoothing tool from the Data Analysis pop-up and click OK.
- Define the Input Range as $C$5:$C$14, set the Damping factor to 0.3, and specify the Output Range as $D$5:$D$14.
- Check the box for Chart Output and click OK.
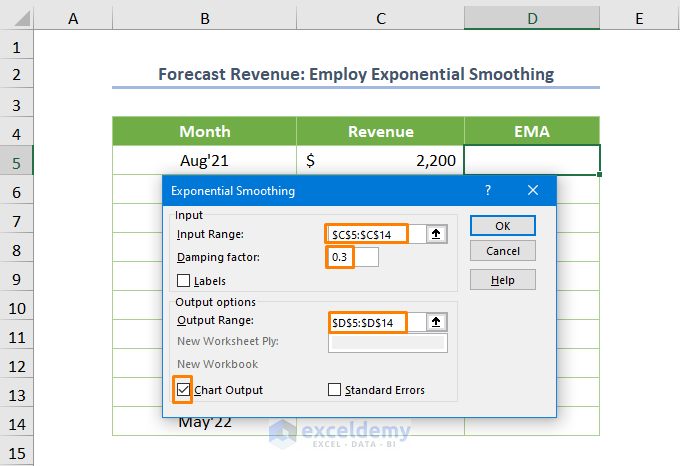
Note: The default damping factor is 0.3, but for more reliable output, you can calculate a specific damping factor.
- The resulting EMA values will appear in cells D5:D14, with the last cell showing the upcoming revenue.
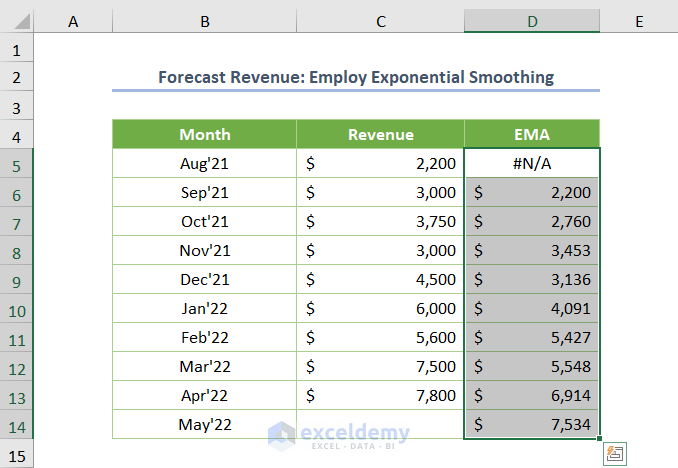
- Visualize the EMA using the chart.
Read More: How to Do Budgeting and Forecasting in Excel
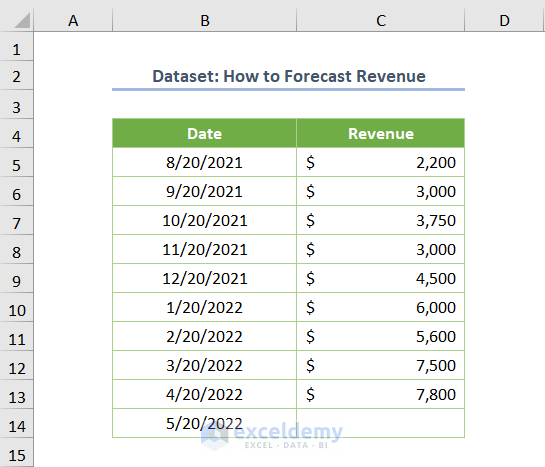
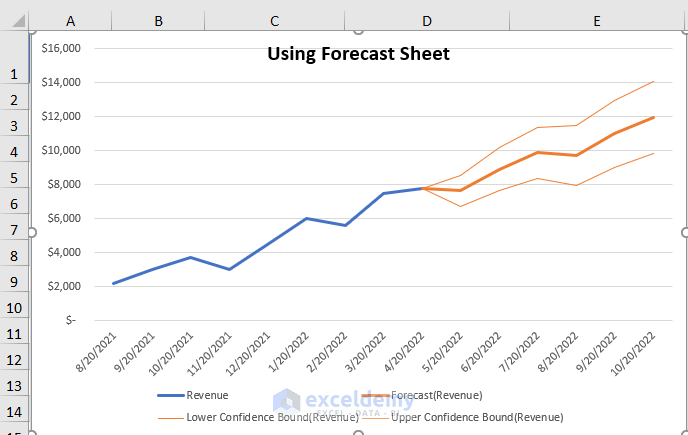
Method 6 – Forecast Sheet for Date-Wise Revenue Forecasting
If your historical revenue data is provided on a date-wise basis (as shown in the dataset), Excel offers an excellent Forecast Sheet feature:
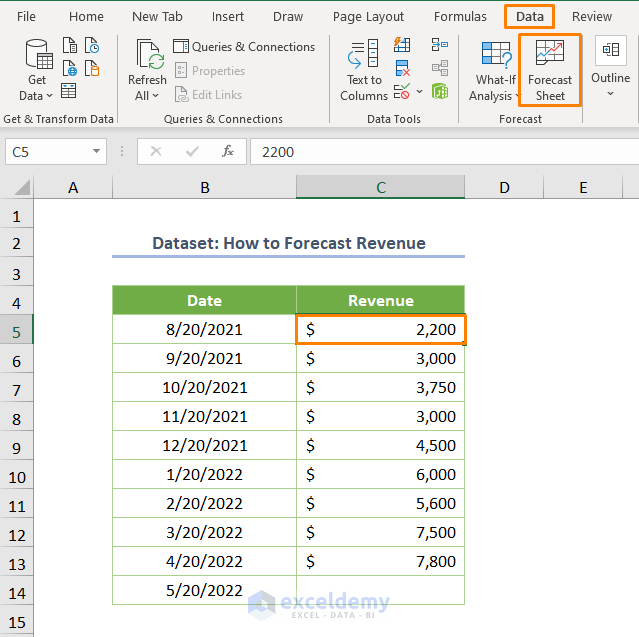
- Hover over any cell within the dataset.
- Go to the Data tab and choose Forecast Sheet from the Forecast ribbon.
- In the dialog box that appears, specify the Forecast End timeline.
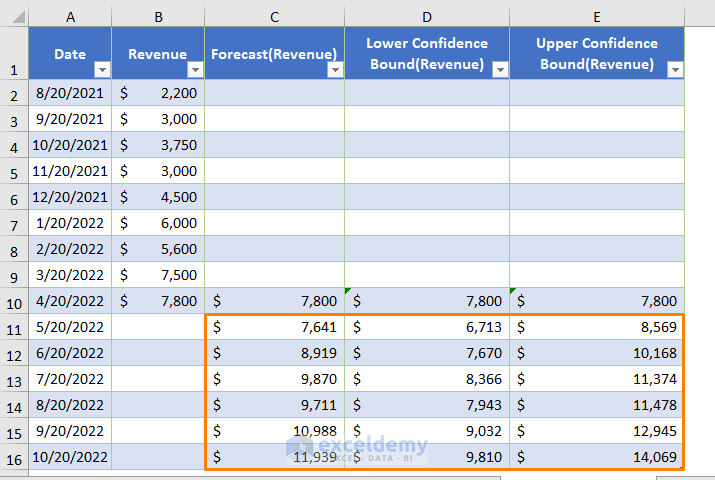
- Set the Timeline Range to $B$4:$B$14 and the Value Range to $C$4:$C$14.
- Choose the Aggregate Duplicate Using method (e.g., Average).
- By default, the Confidence Interval is 95%, meaning that 95% of the forecasted revenues will fall within the range.
- Click Create.
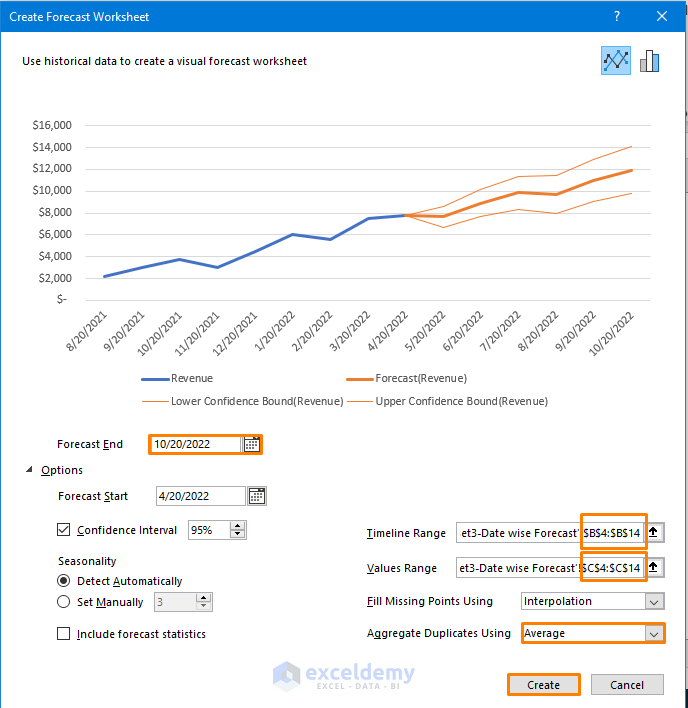
The resulting chart will display the forecasted revenue for the upcoming days.
Additionally, you will get the following table including the Forecast (Revenue).
Things to Remember
- If you’re not a Microsoft 365 user, use CTRL + SHIFT + ENTER when using an array formula (e.g., GROWTH function).
Download Practice Workbook
You can download the practice workbook from here:
Related Articles
- How to Forecast Growth Rate in Excel
- How to Forecast Sales in Excel
- How to Forecast Sales Using Historical Data in Excel
- How to Forecast Sales Growth Rate in Excel
<< Go Back to Excel for Finance | Learn Excel
Get FREE Advanced Excel Exercises with Solutions!
