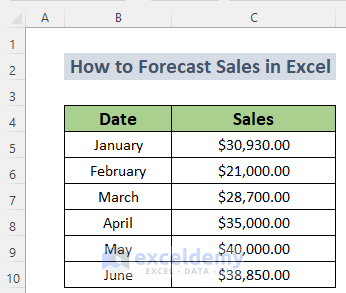
Dataset Overview
Our data set contains sales information about a company for the first 6 months of the year.
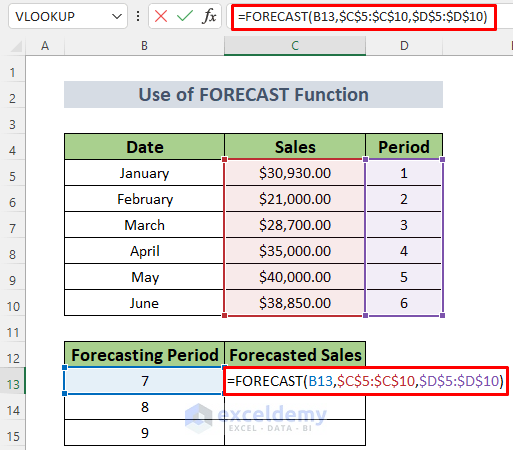
Method 1 – Using the FORECAST Function
- Create a column for forecasting sales (e.g., in cell C13).
- Enter the following formula in cell C13:
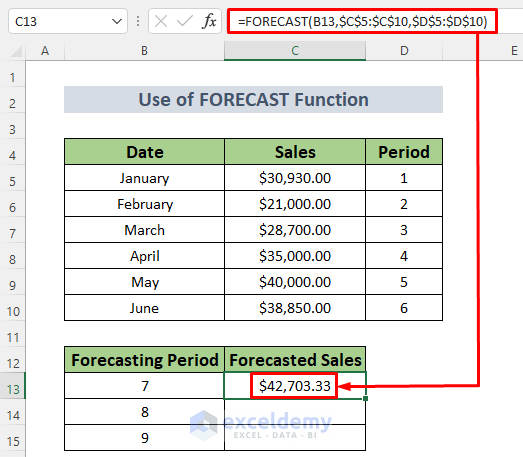
=FORECAST(B13,$C$5:$C$10,$D$5:$D$10)This function calculates the forecasted sales for the 7th month based on a linear relationship between sales and time periods.
- Press ENTER to see the forecasted sales for the 7th month.
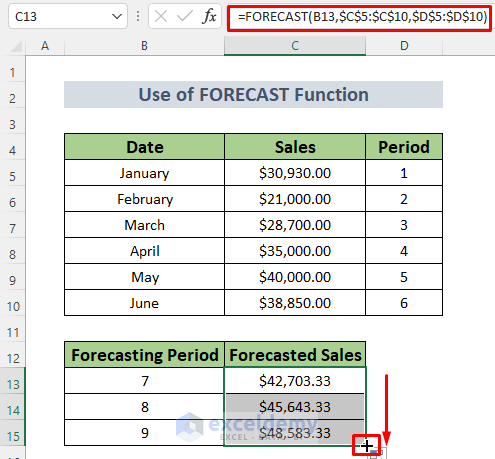
- Use the Fill Handle to AutoFill the formula for subsequent months.
Alternatively, you can use the FORECAST.ETS function, which considers exponential changes in sales.
- Insert the formula below in cell C13.
=FORECAST.ETS(B13,$C$5:$C$10,$D$5:$D$10)- Press ENTER.
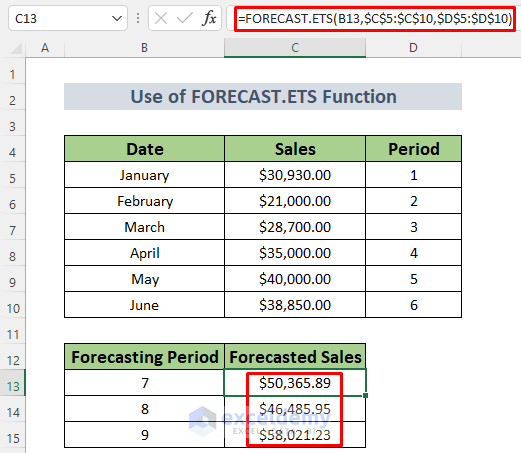
Here, the FORECAST.ETS function returns the forecasted sales for the next 3 months by taking an exponential relation between sales and periods.
Read More: How to Forecast Sales Using Historical Data in Excel
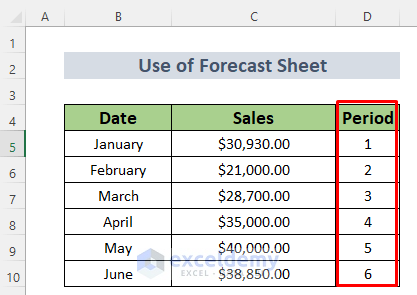
Method 2 – Using Excel’s Forecast Sheet Feature
- Define the months as numbers in the Period column.
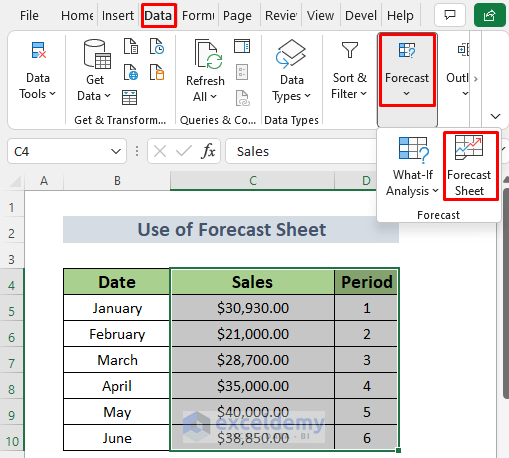
- Select the range C4:D10.
- Go to Data, select Forecast and click on Forecast Sheet.
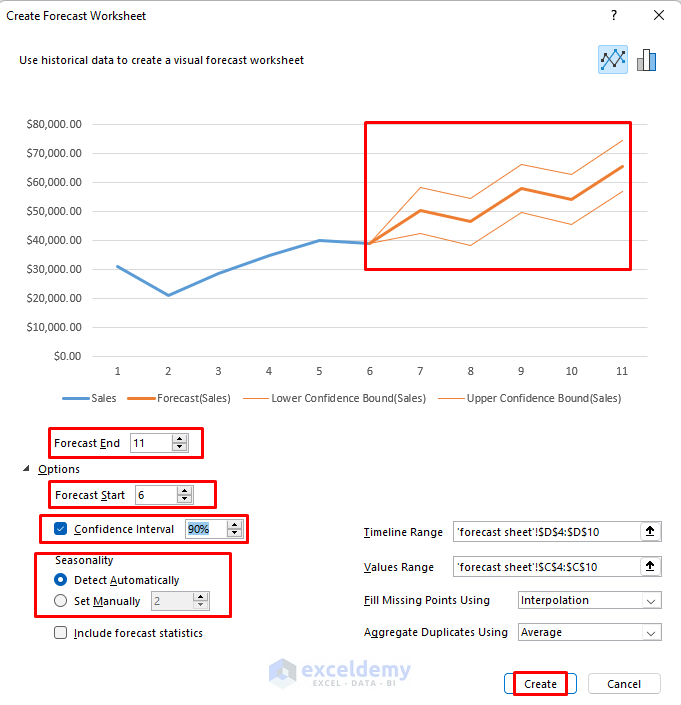
- The Create Forecast Worksheet Window will open, creating a default Forecast Sheet for the next 4 months.
- The sheet includes three forecast lines: Forecast (Sales), Lower Confidence Bound (Sales), and Upper Confidence Bound (Sales).
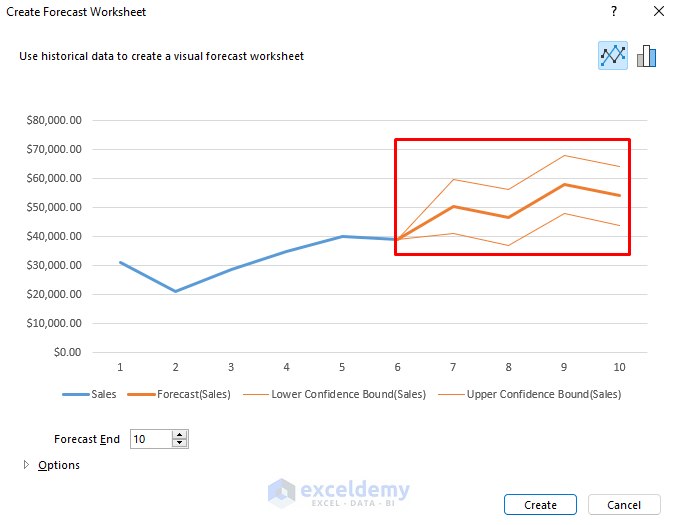
- Customize the Forecast Sheet options (e.g., Confidence Interval, Forecast Start, Forecast End).
- Click Create.
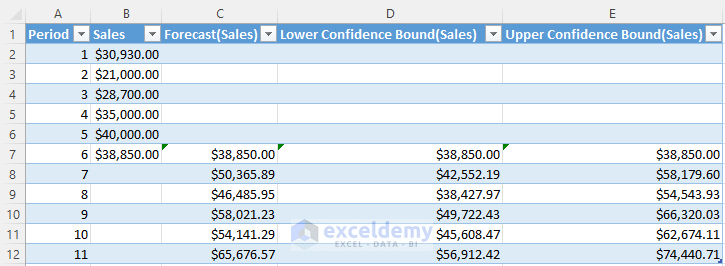
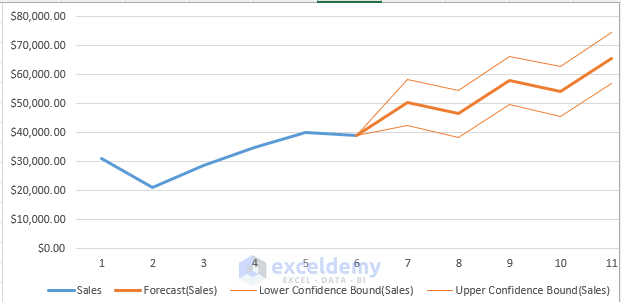
You’ll see the sales forecast in a table and a graph on a new sheet.
Read More: How to Forecast Sales Using Regression Analysis in Excel
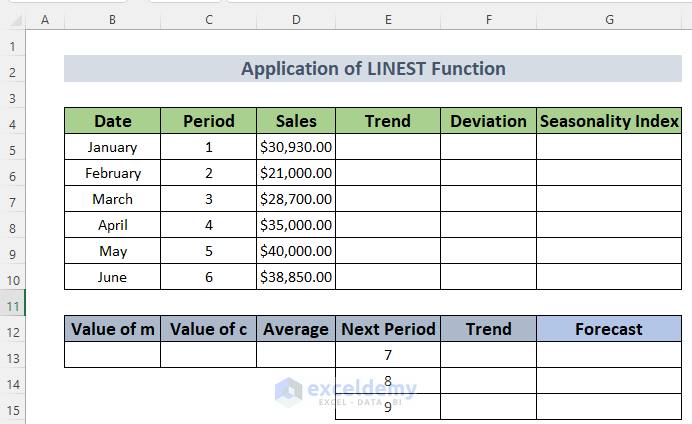
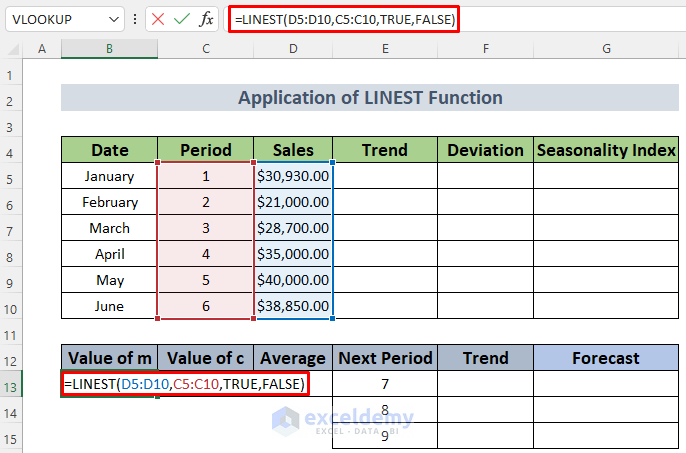
Method 3 – Applying the LINEST Function
To forecast sales using the LINEST function, follow these steps:
- Create the necessary columns in your dataset.
- In cell B13, enter the following formula:
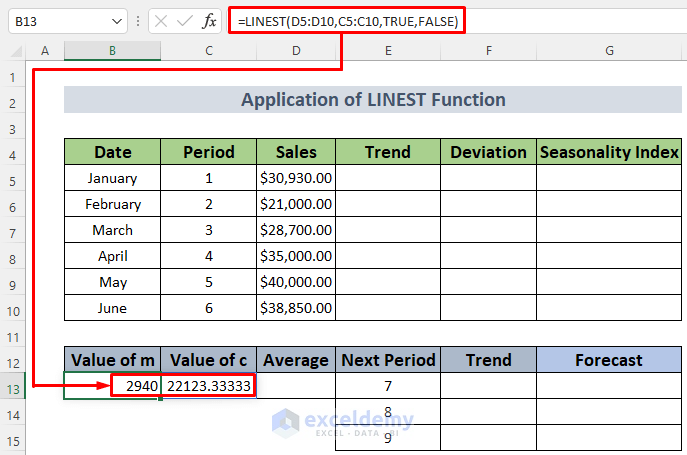
=LINEST(D5:D10,C5:C10,TRUE,FALSE)This function calculates the constant values (slope and intercept) for the linear regression between sales and time periods.
- Press ENTER to see the calculated constants.
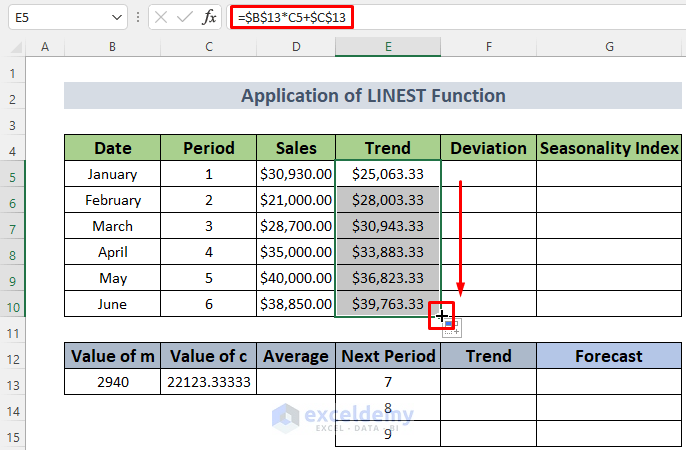
- To find trend values, enter this formula in cell E5:
=$B$13*C5+$C$13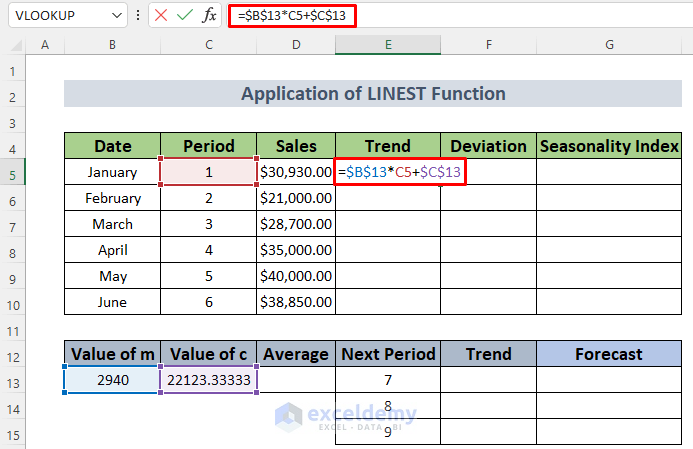
- Press ENTER to see the trend value for the first month.
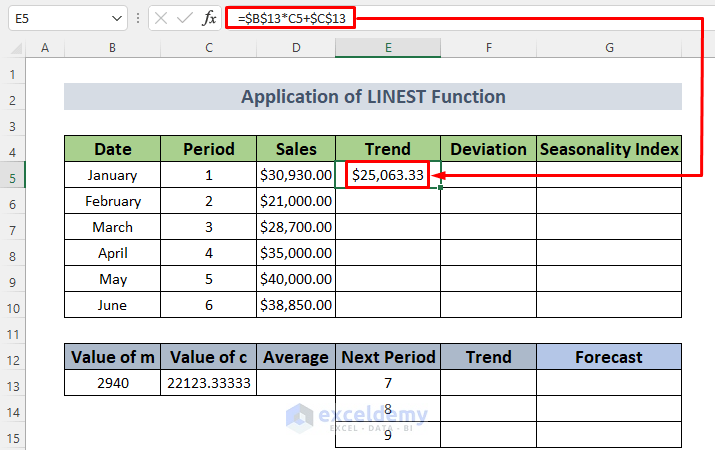
- Autofill the formula for the remaining months.
- Calculate the monthly deviation by dividing actual sales (D5) by the trend value (E5) in cell F5. Autofill this formula for the other months.
=D5/E5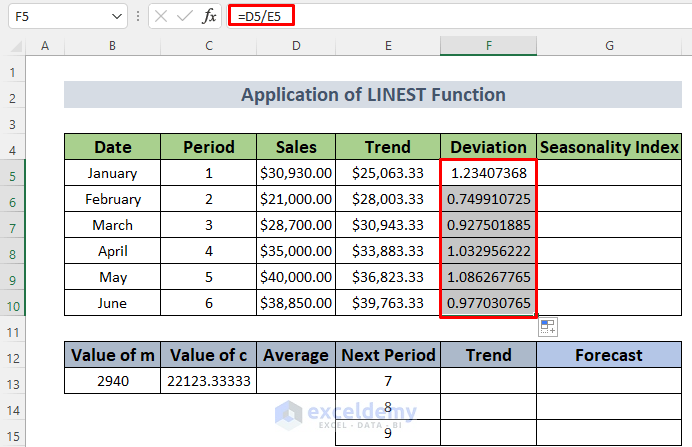
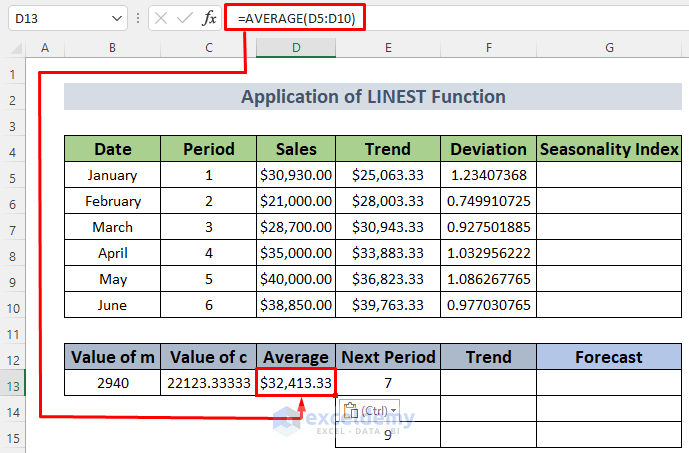
- Determine the Seasonality Index by calculating the average of sales:
=AVERAGE(D5:D10)- Press Enter and Autofill this formula for the other months.
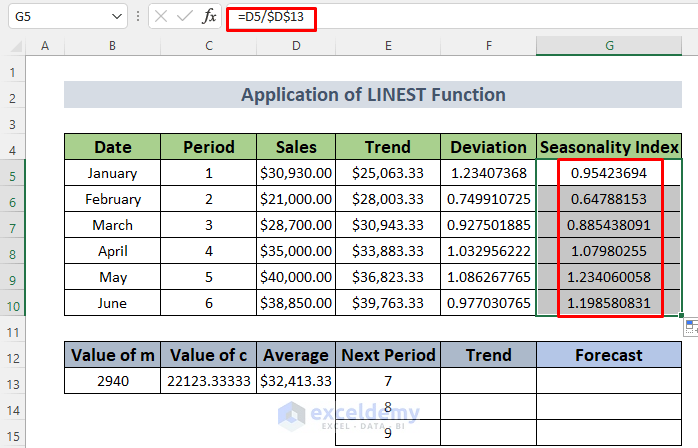
- In cell G5, enter:
=D5/$D$13- Press Enter and Autofill this formula for the other months.
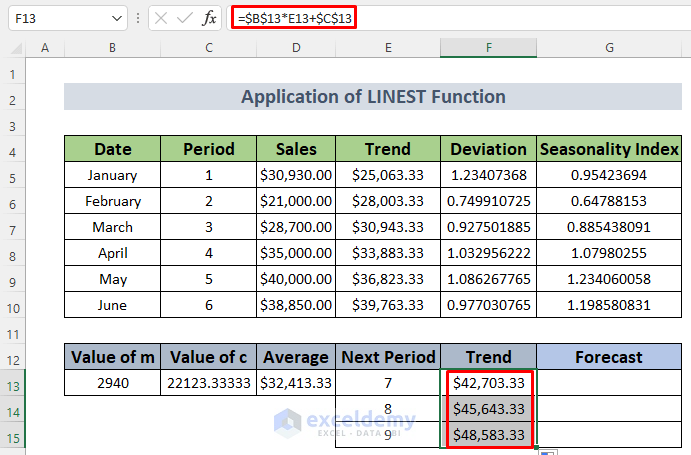
- For the next 3 months, find trend values using this formula in cell F13:
=$B$13*E13+$C$13- Press Enter and Autofill this formula for the other months.
- Calculate forecasted sales by multiplying the Seasonality Index (G5) with the trend value (F13) in cell G13.
=G5*F13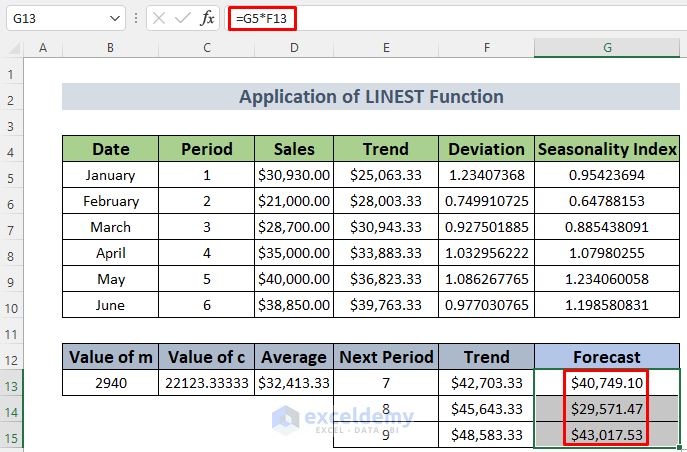
Read More: How to Forecast Sales Growth Rate in Excel
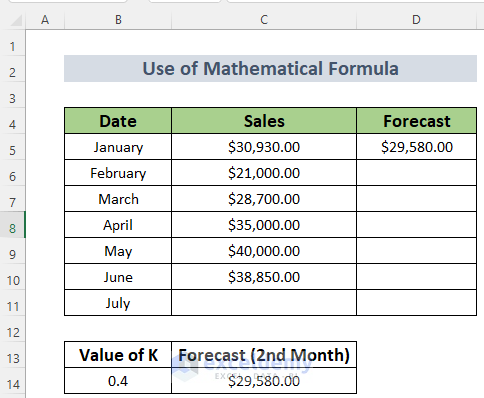
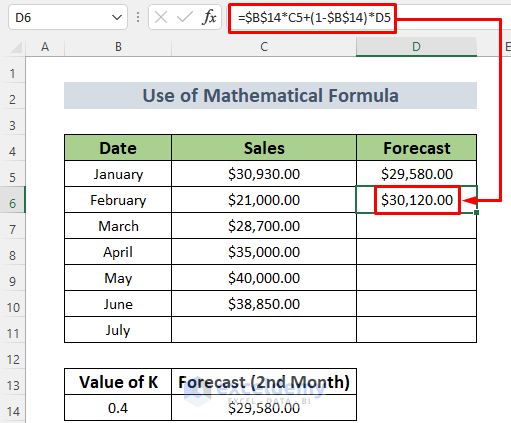
Method 4 – Using a Mathematical Excel Formula
- Assume the forecasted sales for the 2nd month (SForecast) is $29,580.
- Consider the smoothing constant (K) as 0.4.
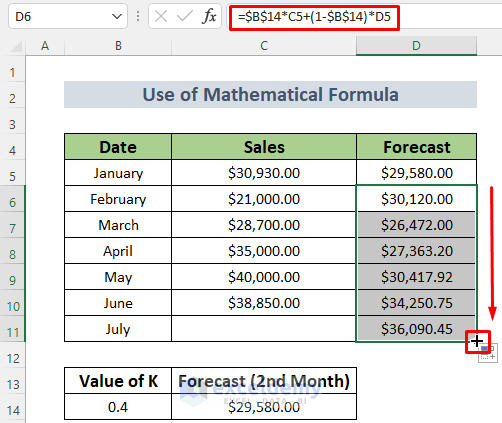
- Calculate the forecast for the next month (February) using this formula in cell D6:
=$B$14*C5+(1-$B$14)*D5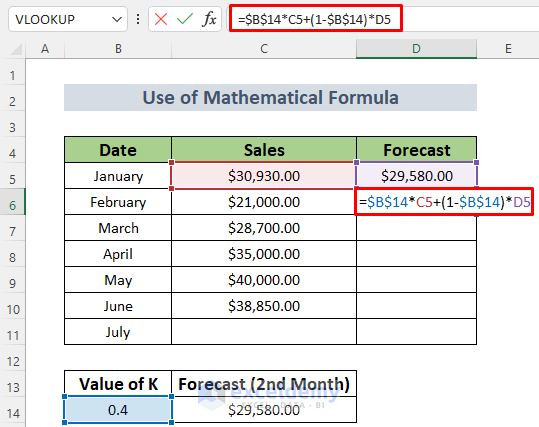
- Press ENTER and you will see the forecasted sales for February.
- Use the Fill Handle to AutoFill the lower cells.
Read More: How to Calculate Accuracy and Precision in Excel
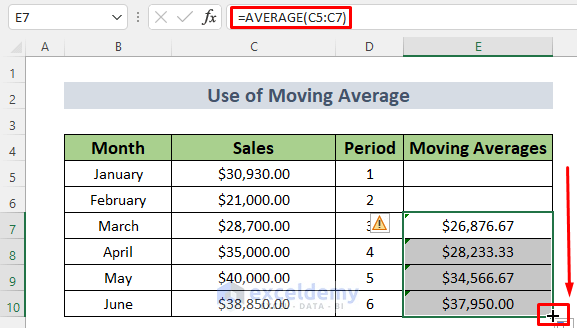
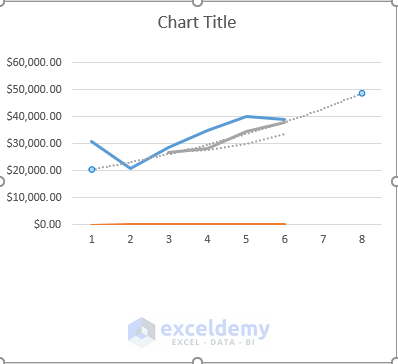
Method 5 – Forecasting Sales with Moving Average Trendline
- Create necessary columns and calculate the average of sales for the first 3 months using the AVERAGE function (cell E7):
=AVERAGE(C5:C7)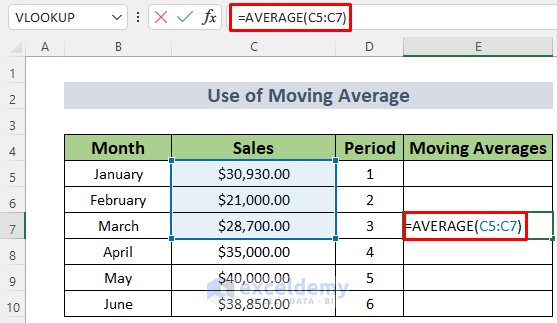
- Press ENTER and you will see the average for the first 3 months.
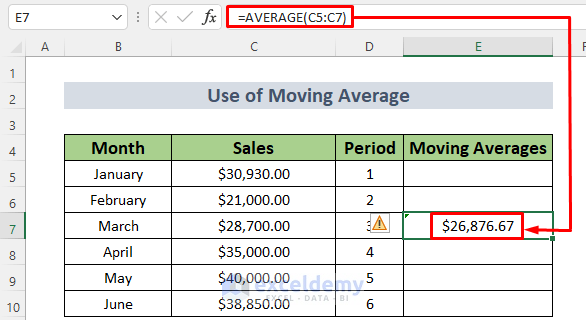
- Use the Fill Handle to AutoFill the lower cells.
- Select the range C4:E10 and insert a 2D Line Chart.
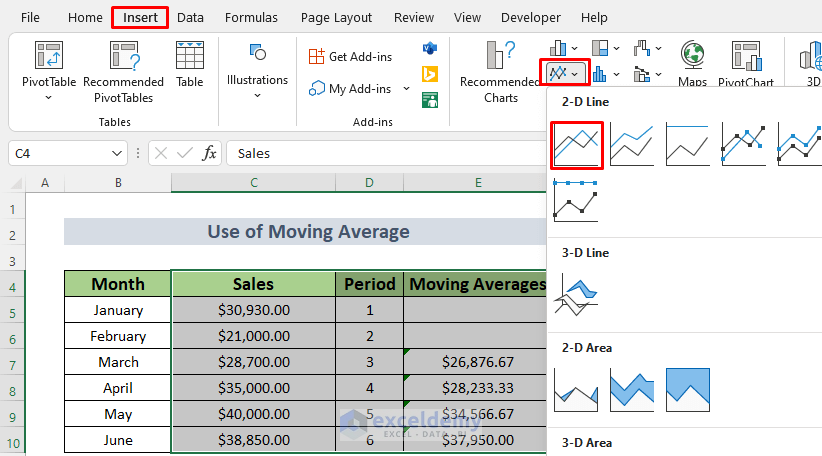
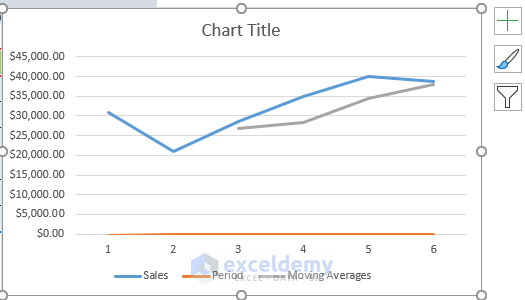
- A chart will appear
- Click the plus icon on the chart, select Trendline, and choose More Options.
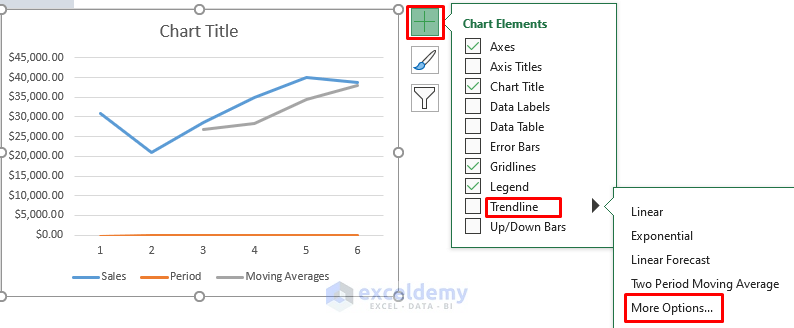
- A dialog box will appear.
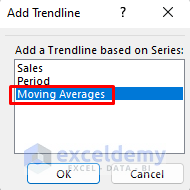
- In the dialog box, select Moving Averages and set the period to 3.
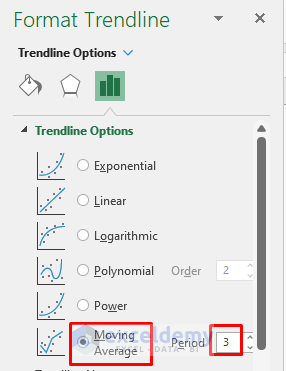
- The moving average trendline will show the forecasted sales.
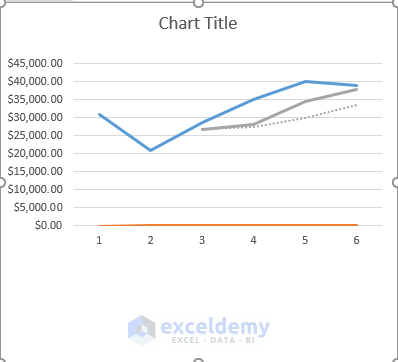
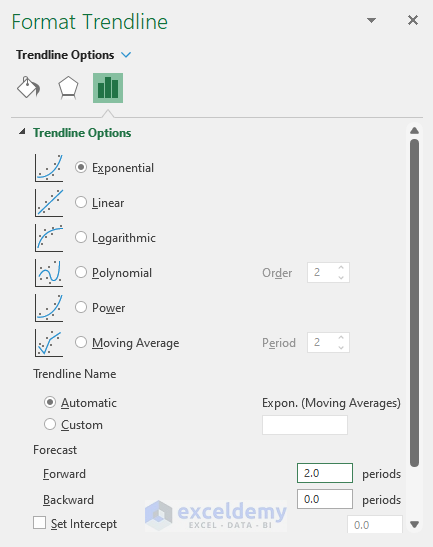
- To see the forecast for the next two months, adjust the trendline options (e.g., choose Exponential) and set the Forward Forecast to 2.
You will see the forecasted sales for the next 2 months in the chart.
Read More: How to Do Budgeting and Forecasting in Excel
Download Practice Workbook
You can download the practice workbook from here:
Related Articles
- How to Forecast in Excel Based on Historical Data
- How to Forecast Growth Rate in Excel
- How to Forecast Revenue in Excel
- How to Forecast Revenue Growth in Excel
<< Go Back to Excel for Finance | Learn Excel

