What Is Forecasting?
Forecasting is an essential approach that leverages historical data to make educated predictions about future trends. Businesses often use forecasting to allocate resources effectively or plan for anticipated expenses.
Imagine you’re starting a business with a specific product. One of your key concerns would be understanding the current and future demand for that product in the market. This involves prediction, estimation, and educated guessing—essentially “foretelling” the future. While no prediction can be 100% accurate, analyzing past and present data allows you to make informed projections. Remember to validate your results and consider other relevant factors before making final decisions.
Dataset Overview
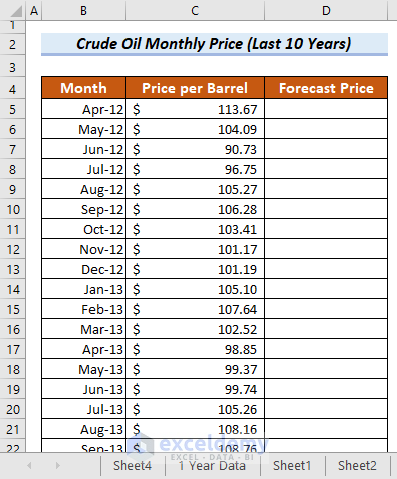
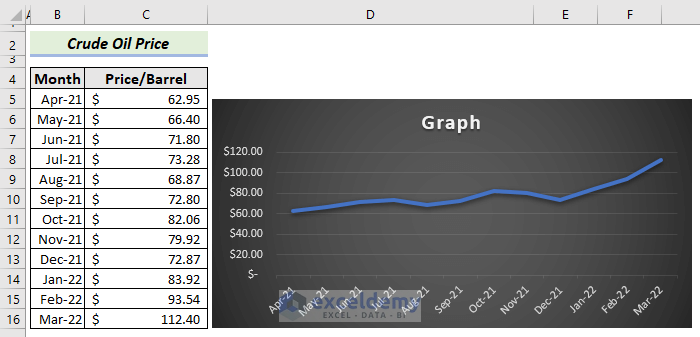
In this article, we have collected price data for Crude Oil (Petroleum) from the World Bank’s website covering the last 10 years (from April 2012 to March 2022). The partial list is depicted in the following image:
Method 1 – Using the ‘Forecast Sheet’ Button in Excel 2016, 2019, 2021 and 365
- Arrange Data with Time Series and Corresponding Values
- Organize your data. In the left column, list the time values in ascending order (e.g., daily, weekly, monthly, or yearly intervals).
- In the right column, enter the corresponding prices.
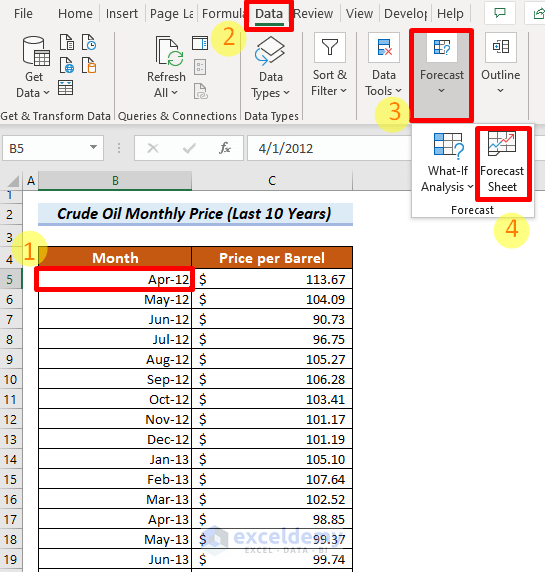
- Create a Forecast Worksheet
- Navigate to the Data tab in Excel.
- Click on the Forecast Sheet button within the Forecast group.
-
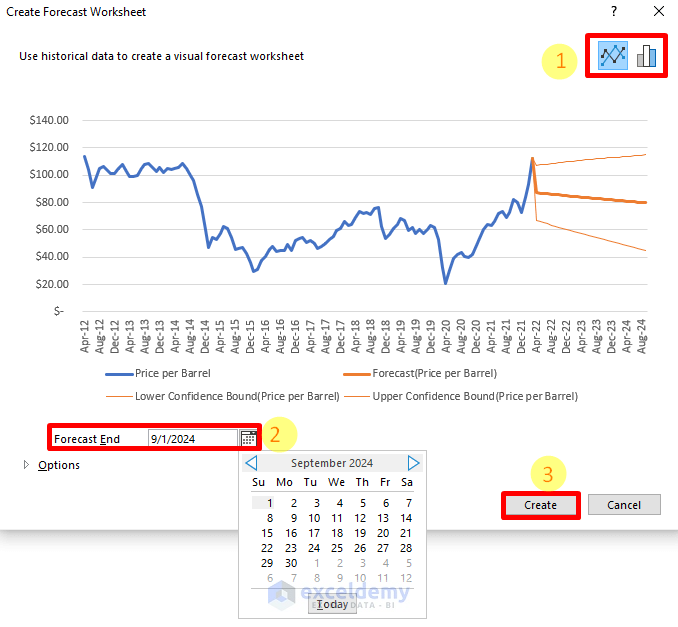
- The Create Forecast Worksheet window will appear.
- Choose the desired graph type.
- Optionally, specify the end date for the forecast.
-
- Click the Create button.
- View the Forecast Results
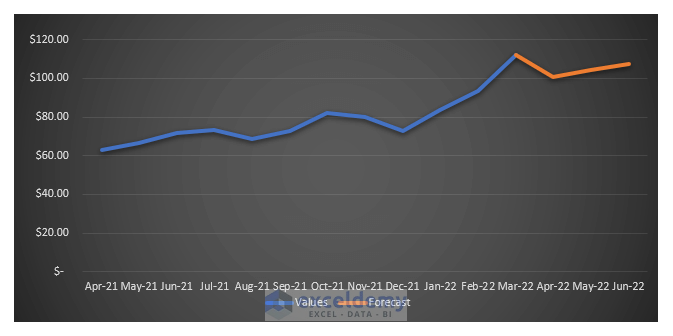
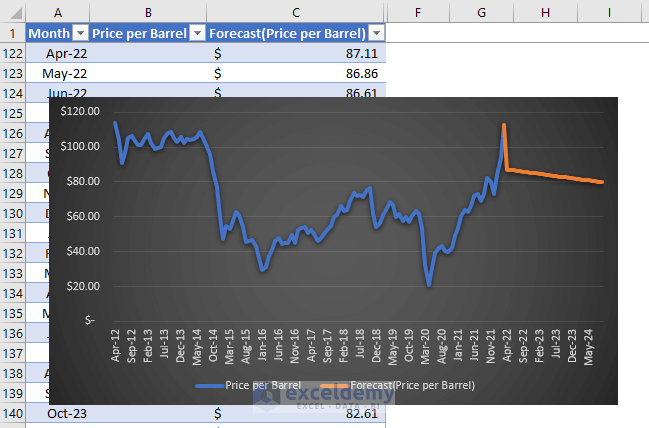
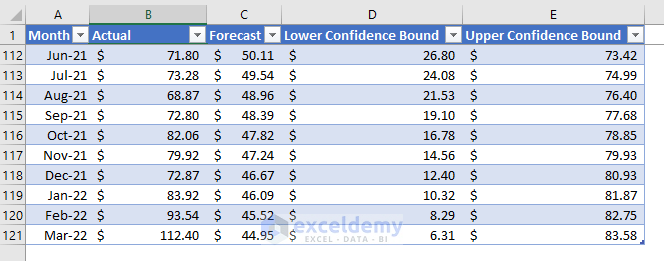
- A new worksheet will open in Excel, containing both your original data and the anticipated values.
- The graph visually represents the original and predicted data.
Customizing the Forecast Graph
You can further customize the forecast graph using the following options (as shown in the image):
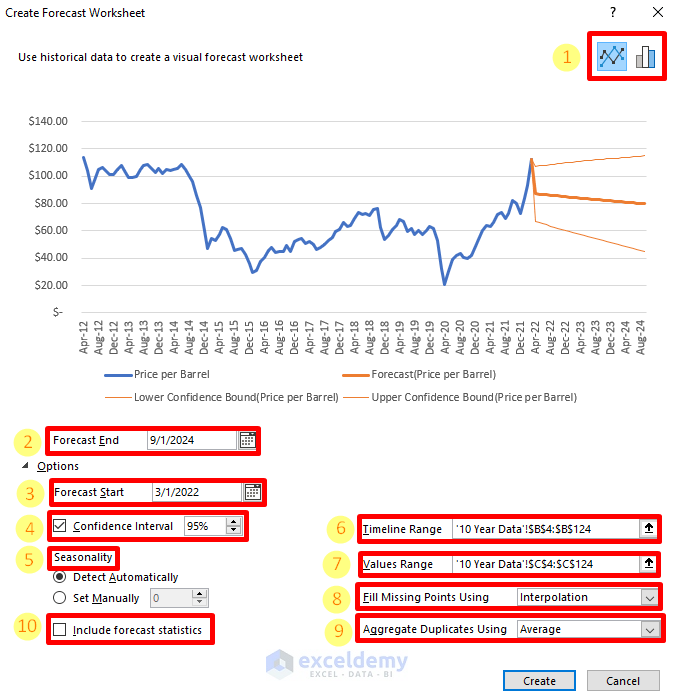
1. Chart Type
- Choose between creating a column chart or a line chart based on your preference.
2. Forecast End
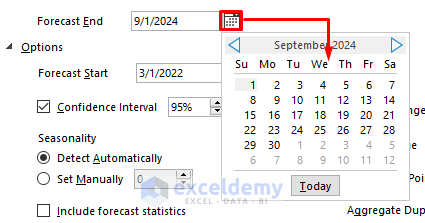
- Specify the date when you want the forecast to end.
3. Forecast Start
- Set the forecast’s starting date.
4. Confidence Interval
- By default, the confidence interval is 95%. Adjust this value as needed to indicate the confidence level of your forecast.
5. Seasonality
- Excel can automatically detect seasonality in your historical data. Alternatively, you can manually set the seasonality pattern.
6. Timeline Range
- Excel automatically sets the timeline range when you select any cell within the data. However, you can also adjust it as needed.
7. Values Range
- You can edit the values range similarly to how you adjust the timeline range.
8. Fill Missing Points Using
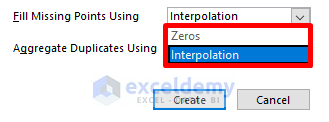
- Choose either interpolation or set missing points as zeros. If less than 30% of the total data is missing, Excel can interpolate the data for you.
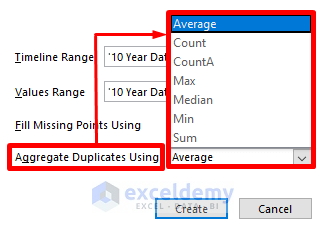
9. Aggregate Duplicates Using
When you have multiple values at the same timestamp, select an appropriate calculation method (Average, Median, Min, Max, Sum, CountA).
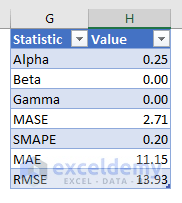
10. Include Forecast Statistics
- By selecting this checkbox, you can add a table with information on smoothing coefficients and error metrics.
Read More: How to Calculate Forecast Accuracy Percentage in Excel
Method 2 – Using Excel Functions for Forecasting Based on Previous Data
You can leverage Excel functions like FORECAST, TREND, and GROWTH to create forecasts based on historical records. Let’s explore each of these functions:
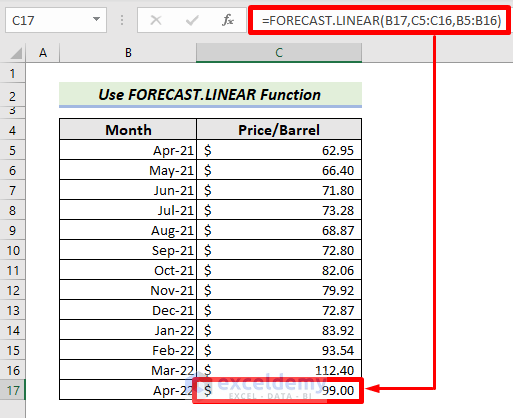
2.1 FORECAST.LINEAR Function
- In MS Excel 2016, the FORECAST function has been replaced by the FORECAST.LINEAR function. We recommend using the updated version for better compatibility with future Excel versions.
- Syntax:
=FORECAST.LINEAR(x, knows_ys, known_xs)
-
-
- Here:
- x: The target date you want to forecast.
- known_xs: The timeline (dates or periods) corresponding to known values.
- known_ys: The actual known values.
- Here:
-
- Steps:
- Insert the following formula in cell C17:
=FORECAST.LINEAR(B17,C5:C16,B5:B16)
-
- Press ENTER.
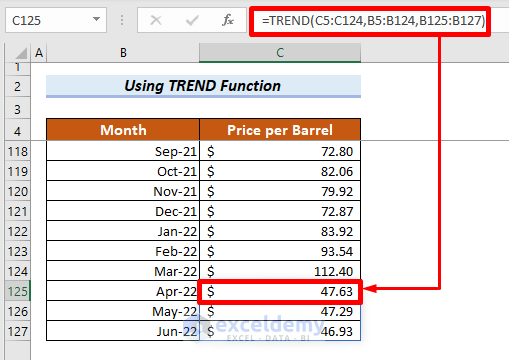
2.2 TREND Function
- The TREND function in MS Excel helps forecast future values based on historical data. It uses the Least Squares method.
- Syntax
=TREND(known_ys, [known_xs], [new_xs], [const])
-
- For your dataset, enter the following formula in cell C125 to get forecast values for April, May, and June 2022:
=TREND(C5:C124,B5:B124,B125:B127)-
- Press ENTER.
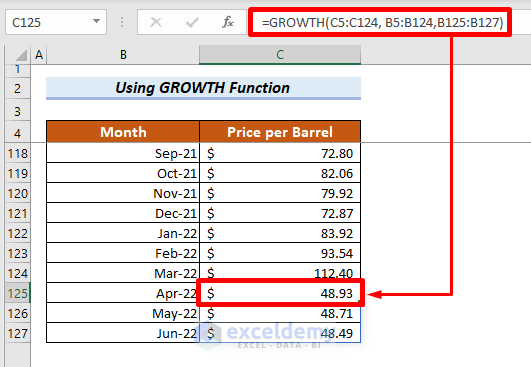
2.3 GROWTH Function
- The GROWTH function works with exponential relationships, whereas the TREND function (used in the previous method) operates with linear relationships.
- Both functions share similar arguments and application.
- To forecast values for April, May, and June 2022, insert the following formula in cell C125:
=GROWTH(C5:C124, B5:B124,B125:B127)-
- Press ENTER.
Read More: How to Forecast Growth Rate in Excel
Method 3 – Using Moving Average and Exponential Smoothing Tools
In statistical analysis, there are two types of Moving Averages: Simple Moving Average and Exponential Moving Average. Both can be employed to predict future values.
3.1 Using Simple Moving Average
- To apply the Moving Average technique, follow these steps:
- Add a new column named Moving Average.

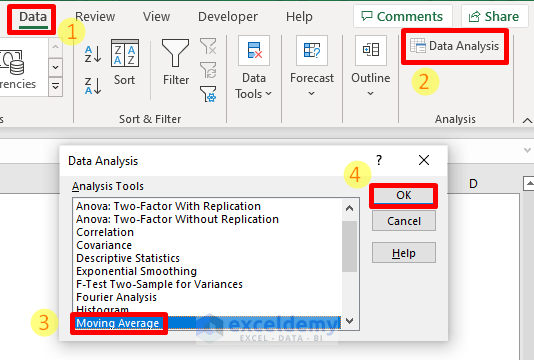
- Go to the Data tab and click on the Data Analysis button.
- Select Moving Average from the list and click OK.
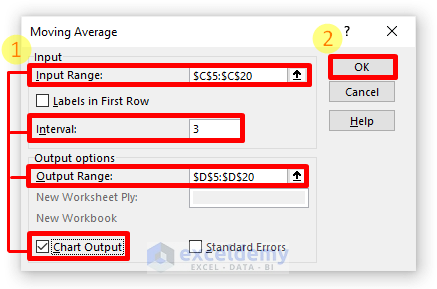
- In the Moving Average window:
- Set the Input Range as C5:C20.
- Specify an Interval of 3.
- Set the Output Range as D5:D20.
- Check the Chart Output checkbox.
- Press OK.
- The forecast value for April 2022 will appear in cell D20.
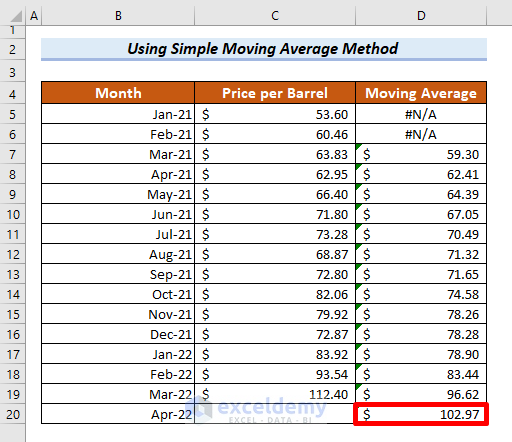
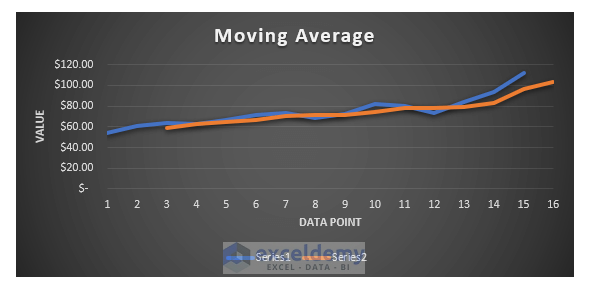
- Additionally, refer to the graphical representation of the forecast results.
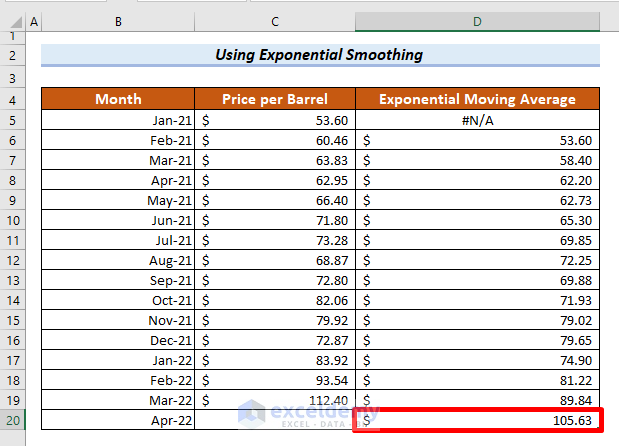
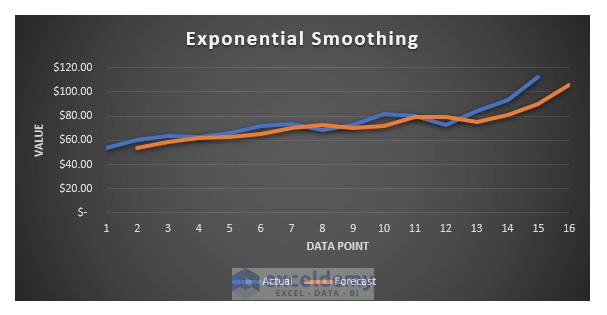
3.2 Applying Exponential Smoothing
For more accurate results, consider using the Exponential Smoothing Technique:
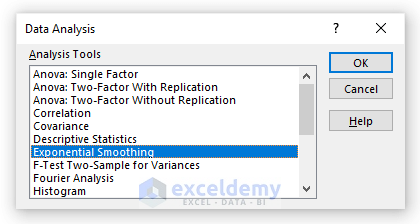
- Go to the Data tab and click on the Data Analysis button.
- Select Exponential Smoothing from the list and click OK.
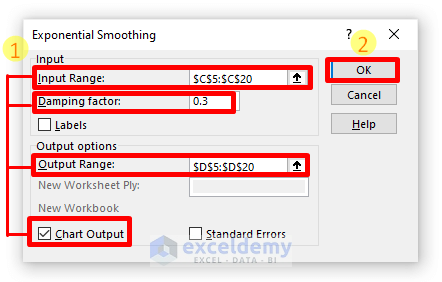
- In the Exponential Smoothing window:
- Set the Input Range as C5:C20 (or adjust based on your data).
- Specify a Damping factor (e.g., 0.3).
- Set the Output Range as D5:D20.
- Check the Chart Output checkbox.
- Press the OK button.
- The result will be displayed in cell D20.
- Refer to the graph for a visual understanding of the forecast.
Read More: How to Forecast Sales Using Historical Data in Excel
Method 4 – Applying the Fill Handle Tool
If your data exhibit a linear trend (either increasing or decreasing), you can use Excel’s Fill Handle tool to quickly generate a forecast. Let’s use the below data, that has a linear trend, and the corresponding graph to forecast for April, May and June 2022.
Here are the steps:
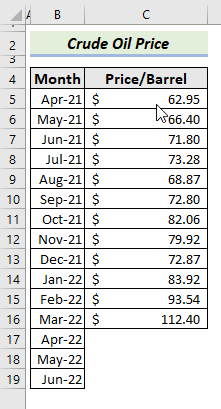
- Highlight the values in the range C5:C16.
- Hover your mouse cursor over the bottom right corner of cell C16. The Fill Handle tool will appear as a small square.
- Click and drag the Fill Handle down to cell C19.
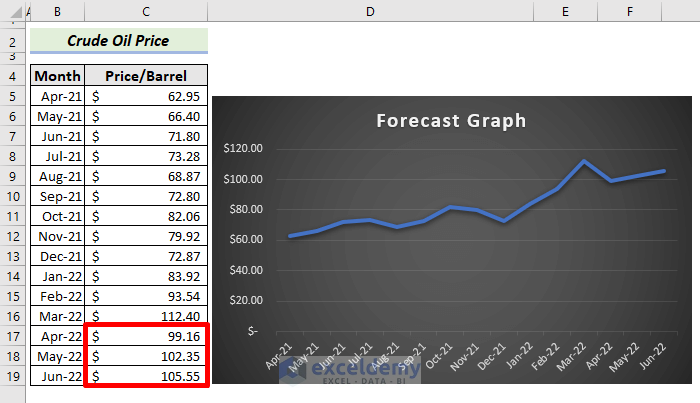
- Excel will automatically generate the forecasted values based on the linear trend observed in your data.
The visual representation indicates that Excel disregards irregular data points (such as the sudden hike in March 2022) and focuses on the more regular values when generating the forecast.
This approach helps maintain consistency in the forecasted trend. Remember to validate the results and consider other factors before making decisions based on the forecast.
Read More: How to Forecast Call Volume in Excel
How Accurately Can Excel Forecast?
Forecasting accuracy in Excel depends on several factors. While Excel provides tools and functions for forecasting, the precision of the results relies on the quality of the data and the chosen forecasting method. Here are some key points:
- Data Quality Matters:
- The accuracy of Excel’s forecasts hinges on the quality and consistency of your historical data. If your data follows a linear trend, Excel’s forecasting techniques can provide reasonable estimates.
- However, keep in mind that forecasting is based on probabilities and estimates, which can change over time. Unexpected events (such as geopolitical conflicts or economic shifts) can impact accuracy.
- User Expertise:
- How accurately you set up the data for forecasting matters. Understanding the context and selecting appropriate methods play a crucial role.
- For instance, consider the impact of external events (like the Ukraine-Russia war) on your data. Such events can disrupt trends and affect forecast accuracy.
- Validation and Comparison:
- To assess the reliability of your forecasts, compare them with known values. If you have data from April 2012 to March 2022, forecast the subsequent months and compare the results.
- This validation process helps gauge how confidently you can rely on Excel’s forecasts.
Remember that while Excel provides convenient tools, it’s essential to interpret results critically and consider external factors.
Download Practice Workbook
You can download the practice workbook from here:
Related Articles
- How to Forecast Revenue in Excel
- How to Forecast Sales in Excel
- How to Forecast Revenue Growth in Excel
- How to Forecast Sales Growth Rate in Excel
<< Go Back to Excel for Finance | Learn Excel
Get FREE Advanced Excel Exercises with Solutions!
