Introduction to Forecast Accuracy
Forecast Accuracy is the deviation between the forecast demand and the actual demand. It is also called Forecast Error.
Introduction to Demand Forecast to Calculate Forecast Accuracy Percentage
The formula to calculate the Demand Forecast is,
Demand Forecast = Average Sales X Seasonality X GrowthTo calculate the forecast accuracy:
Steps:
- Subtract the forecast from the demand to calculate the forecast error for each product.
- Use the ABS() function in an Excel formula to calculate the absolute value of the error.
- Divide the absolute value of the error by the demand and multiply it by 100 to calculate the percentage of the error at the product level.
This is the output for a 2-month sales horizon.
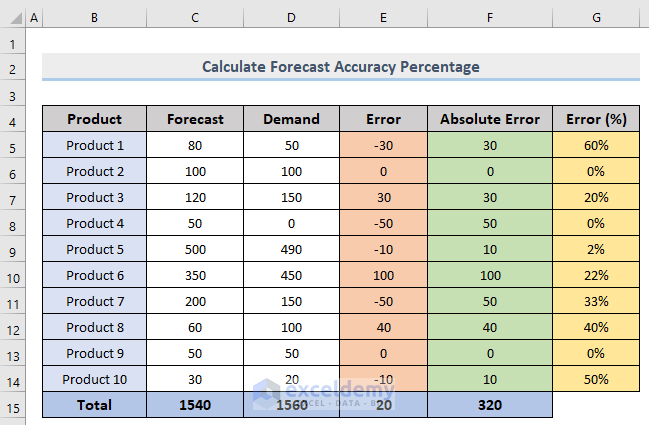
You can use the SUM() function to calculate the Total of all the attributes in calculating the forecasting accuracy percentage in Excel.
Method 1 – Using BIAS Forecast Accuracy/ Consistent Forecast Error to Calculate Forecast Accuracy Percentage
Prediction BIAS is the analytical deviation between the actual values and the estimated values.
- To calculate the forecast accuracy, divide the total error by the total demand.
BIAS Forecast Accuracy = Total Error/ Total Demand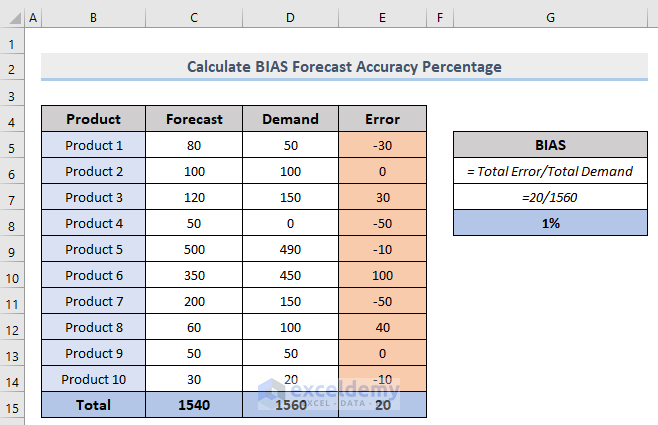
To check whether the prediction for all the products is overestimated (BIAS > 0) or underestimated (BIAS < 0), you can utilize this method.
Read More: How to Calculate Accuracy and Precision in Excel
Method 2- Using the Mean Absolute Percentage Error (MAPE) to Calculate Forecast Accuracy
MAPE is defined as the average of the Error percentages.
MAPE = Average of Error Percentage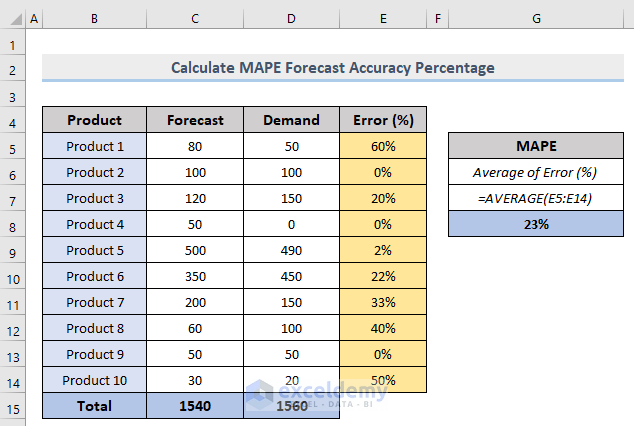
As MAPE is a calculation of errors, a high percentage means bad, and a low percentage means good.
As there is no weighting on quantities or on values, periods of high demand can easily be underestimated with this method.
Read More: How to Forecast in Excel Based on Historical Data
Method 3 – Using the Absolute Error (MAE) / Mean Absolute Deviation (MAD) / Weighted Absolute Percentage Error (WAPE)
Mean Absolute Error (MAE), Mean Absolute Deviation (MAD) or Weighted Absolute Percentage Error (WAPE) is the average of weighted absolute errors.
- To calculate the Mean Absolute Error (MAE), divide the total absolute error by the total demand.
MAE = Total Absolute Error/ Total Demand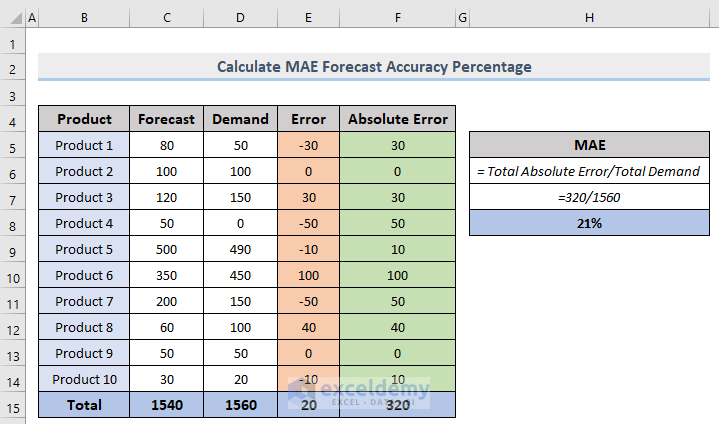
This method is weighted by quantity or value. It is highly recommended in demand planning for one product.
Method 4 – Root Mean Squared Error (RMSE) to Calcute Forecast Accuracy
Root Mean Squared Error (RMSE) is calculated from the square root of Mean Squared Error (MSE) or Mean Squared Deviation (MSD).
- The squared error (Error^2) for each product must be added. The Mean Squared Error (MSE) is the average squared error for each product.
MSE = Average of Squared ErrorWith the value of MSE, RMSE can be measured.
- To calculate the RMSE, divide the square root of MSE by the average of the demand.
RMSE = Square Root of MSE/ Average of Demand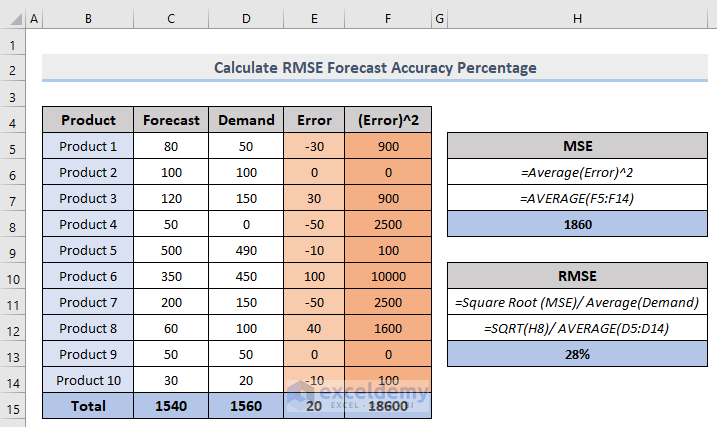
Read More: How to Forecast Sales Using Regression Analysis in Excel
Download Workbook
You can download the free practice Excel workbook here.
Related Articles
- Time Series Forecasting Methods in Excel
- How to Forecast Call Volume in Excel
- How to Do Budgeting and Forecasting in Excel
<< Go Back to Excel for Finance | Learn Excel
Get FREE Advanced Excel Exercises with Solutions!
