Creating graphs from data in Excel helps a lot with data analysis. Sometimes we want to add a text box to the graph which makes the graph and its element more comprehensible. In this article, I will show 2 simple ways to add a text box to an Excel graph.
We can add a text box to any graph in Excel in different ways. In this section, I will show 2 simple ways to add a text box to a graph in Excel.
1. Using Insert Tab to Add Text Box in Excel Graph
In the first method, I will use the Inset tab of the Excel ribbon to add a text box. For demonstration, I have used a dataset containing subjects and marks of a student’s test examination. Here, I have created a graph from the data on which I will add a text box.
Dataset:
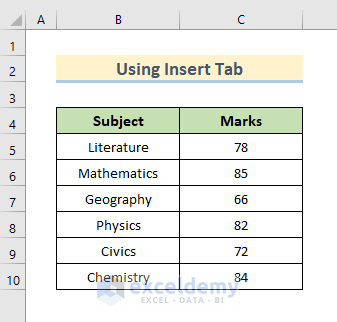
Graph:

Follow the stepwise procedures given below for adding a text box to the graph.
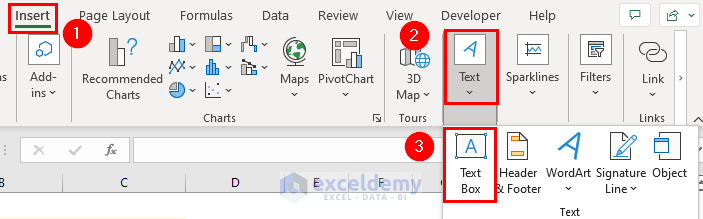
- Firstly, go to the Insert tab.
- Then, select Text. A drop-down menu will appear.
- Select Text Box from there
- After that, move your mouse cursor on the graph, and the cursor pointer will change into a plus (+) sign.
- Further, place the cursor on the desired palace of the graph.
- Furthermore, hold the left-click of the mouse and draw a box shape.
- Thus, the text box is created.

- Later on. Click on the text box and write the text that you want to add.
- Finally, we will see the text box is created with the desired text inside.

Read More: How to Add a Dynamic Text Box in Excel
2. Utilizing Format Tab for Adding Text Box in Excel Chart
In the previous method, we added a text box to a graph. But the text box was floating which means it won’t move if we move the graph. We can easily fix the problem by using the Format tab. In this section, I will show the way to add a text box to a graph in Excel using the Format tab. For demonstration, I have used a dataset containing Subjects and marks of a student’s test examination. Here, I have created a graph from the data on which I will add a text box.
Dataset:
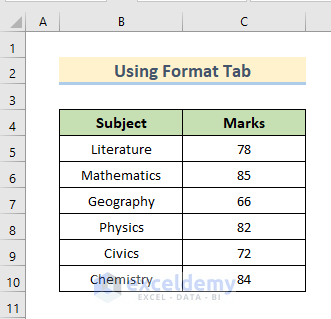
Graph:

Let’s walk through the procedures.
- Firstly, select the graph and go to the Format tab.
- Then, select Text Box from the ribbon.

- Consecutively, the mouse cursor pointer will change into a plus (+) sign.
- Further, place the cursor on the desired palace of the graph.
- After that, hold the left-click of the mouse and draw a rectangular box.
- Thus, the text box is created.

- Afterward, write the desired text in the box.
- Finally, we have successfully added a text box to the graph in Excel.

- In addition, we can do some formatting in the text box.
- For that, select and right-click on the text box.
- Also, select Format Object from the appeared list.

- Next, from the Format Shape pane, select Solid Line from the Line option.

- As a result, we will see a solid border around the text box.
- Obviously, we can do more formatting in this way.

Read More: How to Insert Scrolling Text Box in Excel
Importance of Adding Text Box to Excel Chart
- The Text Box helps to identify different elements of a graph.
- We can add special notes to the graph with the help of a text box.
- We can identify the chart type and other features later on by using a text box.
Download Practice Workbook
You can download the practice workbook from here.
Conclusion
A Text Box is quite helpful if we add it to a graph in Excel. Here, I have shown 2 simple ways to add a text box in an Excel graph. Moreover, we have added the practice book at the beginning of the article. You can download it to practice by yourself. Lastly, If you have any queries or suggestions, please leave a comment.
Related Articles
- How to Put Space in Text Box in Excel
- How to Convert Text Box to Cell in Excel
- How to Anchor Text Box in Excel
- How to Remove Text Box Border in Excel
<< Go Back to TextBox | Learn Excel
Get FREE Advanced Excel Exercises with Solutions!
