Step 1 – Prepare Your Dataset
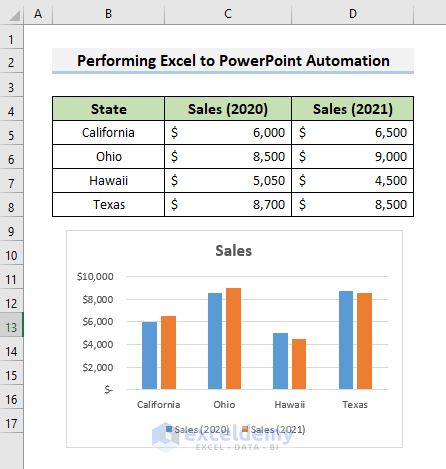
- Open an Excel sheet containing the relevant data.
- Create a chart based on the data. For example, we’ll use the range B4:D8 to represent sales information.
Read More: [Solved] Embedded Excel in PowerPoint Not Showing All Data
Step 2 – Access the Visual Basic Editor
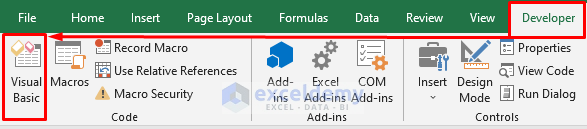
- In Excel, go to the Developer tab on the ribbon.
- Select “Visual Basic” to open the Visual Basic Editor.
- Alternatively, press Alt + F11 on your keyboard (Fn + Alt + F11 for laptop users).
Step 3 – Establish a Link Between Excel and PowerPoint
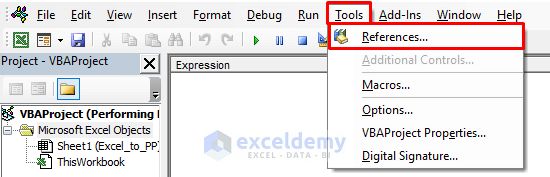
- To connect Excel with PowerPoint, enable the necessary reference:
- Click on Tools and choose References.
-
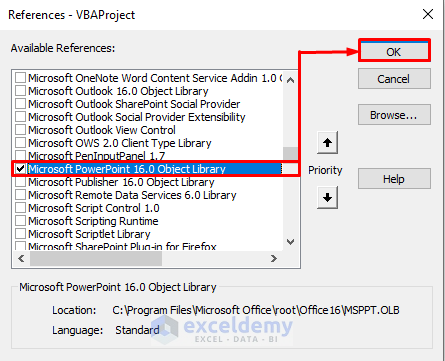
- Check the box next to Microsoft PowerPoint 16.0 Object Library (adjust the version based on your PowerPoint).
- Click OK.
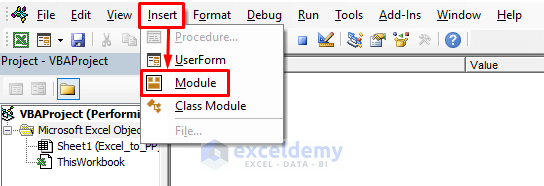
Step 4 – Insert a Module Window
- Within the Visual Basic Editor, navigate to the Insert tab.
- Select Module to open the Module window.
Step 5 – Add VBA Code
In the Module window, enter the following VBA code:
Option Explicit
Sub Excel_to_PP()
Dim PwrPntAp As New PowerPoint.Application
Dim iPPTFile As PowerPoint.Presentation
Dim iSlide As PowerPoint.Slide
Set iPPTFile = PwrPntAp.Presentations.Add
Dim iSht As Worksheet
For Each iSht In ThisWorkbook.Sheets
If iSht.Name <> "Setting" Then
SetiSlide=iPPTFile.Slides.AddSlide(1,iPPTFile.SlideMaster.CustomLayouts(6))
iSlide.MoveTo (iPPTFile.Slides.Count)
With iSlide.Shapes.Title
.TextFrame.TextRange.Text = iSht.Name
.TextFrame.TextRange.Font.Color.RGB = RGB(255, 255, 255)
.Fill.BackColor.RGB = RGB(150, 150, 150)
.TextEffect.Alignment = msoTextEffectAlignmentCentered
.TextEffect.FontName = "Calibri"
.Height = 50
End With
iSht.UsedRange.CopyPicture xlScreen, xlPicture
iSlide.Shapes.Paste
With iSlide.Shapes(2)
.LockAspectRatio = msoCTrue
.Width = iPPTFile.PageSetup.SlideWidth - 30
.Top = 0
If .Height > iPPTFile.PageSetup.SlideHeight Then
.Height = iPPTFile.PageSetup.SlideHeight - 120
End If
.Left = 0
If .Width > iPPTFile.PageSetup.SlideWidth Then
.Width = iPPTFile.PageSetup.SlideWidth - 30
End If
.Left = (iPPTFile.PageSetup.SlideWidth - .Width) / 2
.Top = 100
End With
End If
Next
End Sub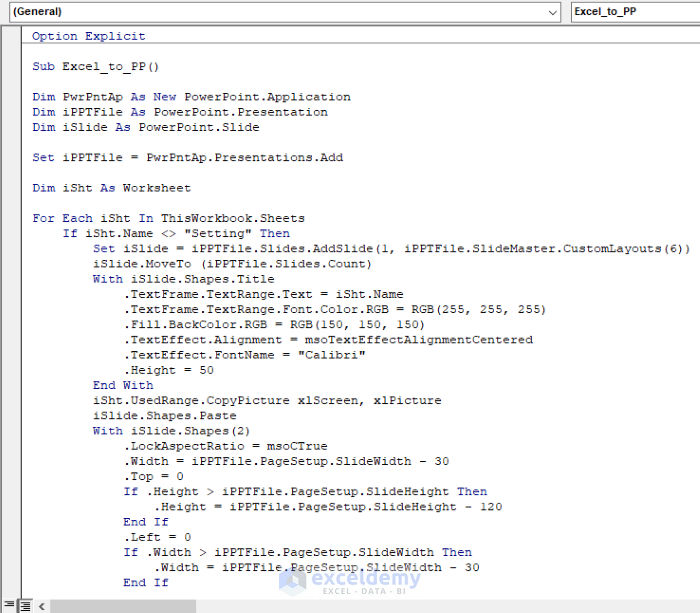
VBA CODE Explanation:
VBA CODE Explanation:

Dim PwrPntAp As New PowerPoint.Application
Dim iPPTFile As PowerPoint.Presentation
Dim iSlide As PowerPoint.Slide

' Here, PwrPntAp, iPPTFile, and iSlide are variables representing PowerPoint Application, Presentation, and Slide, respectively.

Set iPPTFile = PwrPntAp.Presentations.Add
Dim iSht As Worksheet

' We're opening PowerPoint Application and declaring a variable for an Excel worksheet.

If iSht.Name <> "Setting" Then
    Set iSlide = iPPTFile.Slides.AddSlide(1, iPPTFile.SlideMaster.CustomLayouts(6))
    iSlide.MoveTo (iPPTFile.Slides.Count)
    With iSlide.Shapes.Title
        .TextFrame.TextRange.Text = iSht.Name
        .TextFrame.TextRange.Font.Color.RGB = RGB(255, 255, 255)
        .Fill.BackColor.RGB = RGB(150, 150, 150)
        .TextEffect.Alignment = msoTextEffectAlignmentCentered
        .TextEffect.FontName = "Calibri"
        .Height = 50
    End With
    iSht.UsedRange.CopyPicture xlScreen, xlPicture
End If

' We're copying Excel data and creating a PowerPoint slide where we'll place our data.

iSlide.Shapes.Paste
With iSlide.Shapes(2)
    .LockAspectRatio = msoCTrue
    .Width = iPPTFile.PageSetup.SlideWidth - 30
    .Top = 0
    If .Height > iPPTFile.PageSetup.SlideHeight Then
        .Height = iPPTFile.PageSetup.SlideHeight - 120
    End If
    .Left = 0
    If .Width > iPPTFile.PageSetup.SlideWidth Then
        .Width = iPPTFile.PageSetup.SlideWidth - 30
    End If
    .Left = (iPPTFile.PageSetup.SlideWidth - .Width) / 2
    .Top = 100
End With
STEP 6 – Save and Run VBA
- Save the code by pressing Ctrl + S on your keyboard.
- To run the code, press the F5 key or click the Run button.

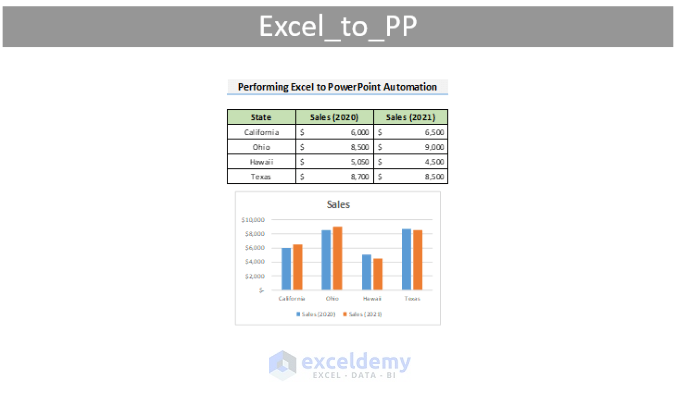
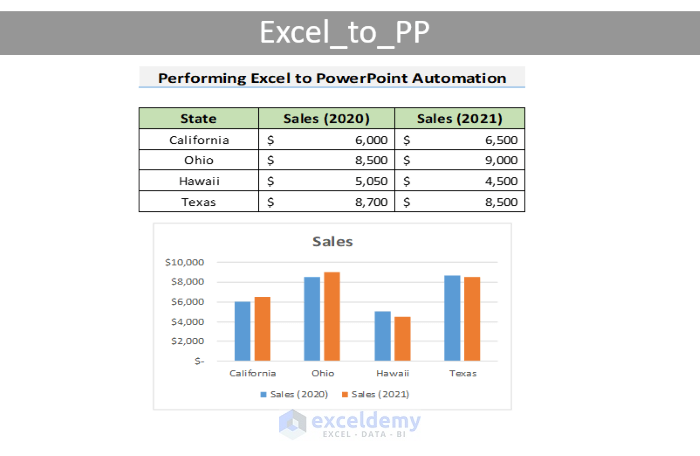
- PowerPoint will open automatically, displaying the sales data and chart.
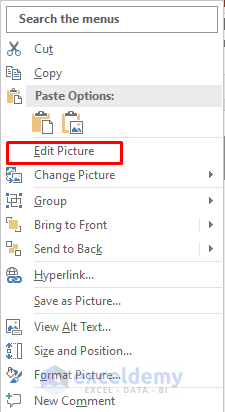
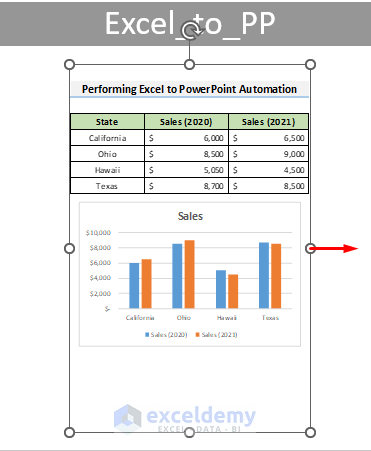
STEP 7 – Edit in PowerPoint
- Put your cursor on the PowerPoint figure and right-click the mouse.
- Select Edit Picture.
- When prompted, respond with Yes.
- Adjust the length, width, and zoom by dragging the circle ends.
- Enhance the appearance of the figure for better data understanding.
Read More: How to Update Charts in PowerPoint from Excel Automatically
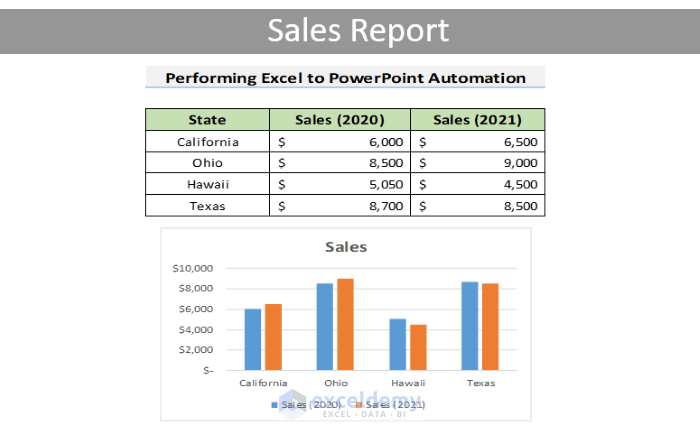
Final Output
- Your automated Sales Report in PowerPoint now reflects the desired changes.
- You’ve successfully integrated data and a chart from Excel.
Download Practice Workbook
You can download the practice workbook from here:
Related Articles
- How to Copy Table from Excel to Powerpoint with Formatting
- How to Insert Excel Chart into PowerPoint
- How to Copy Chart from Excel to PowerPoint Without Link
- Automatically Create PowerPoint Slides from Excel
- How to Insert an Excel File into PowerPoint as an Icon
<< Go Back to Excel to PowerPoint | Export Data from Excel | Learn Excel
Get FREE Advanced Excel Exercises with Solutions!
