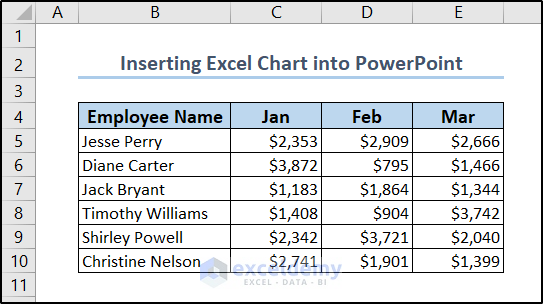
Below is a dataset containing a Company’s sales records for six employees from January to March. We are going to use this to plot a chart within Excel.
To create the chart,
- select the dataset (the range B5:E10) and go to the Insert tab on the ribbon. We can find a wide range of chart options from the Charts group.
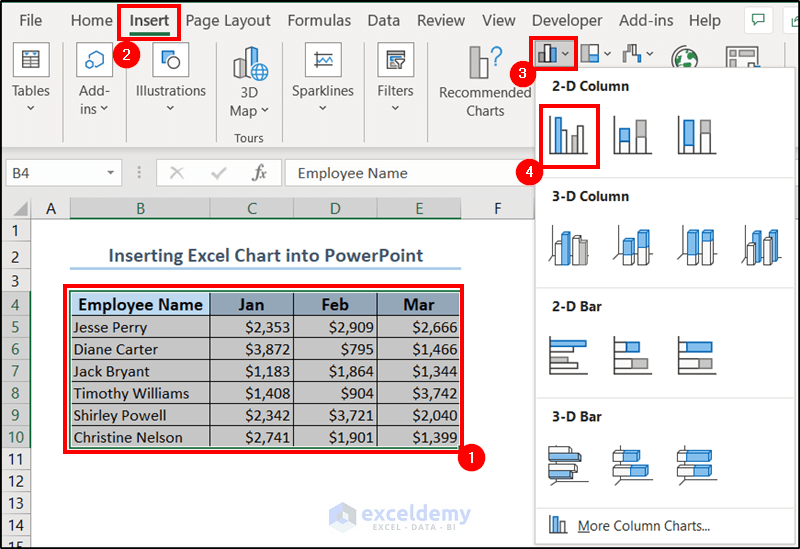
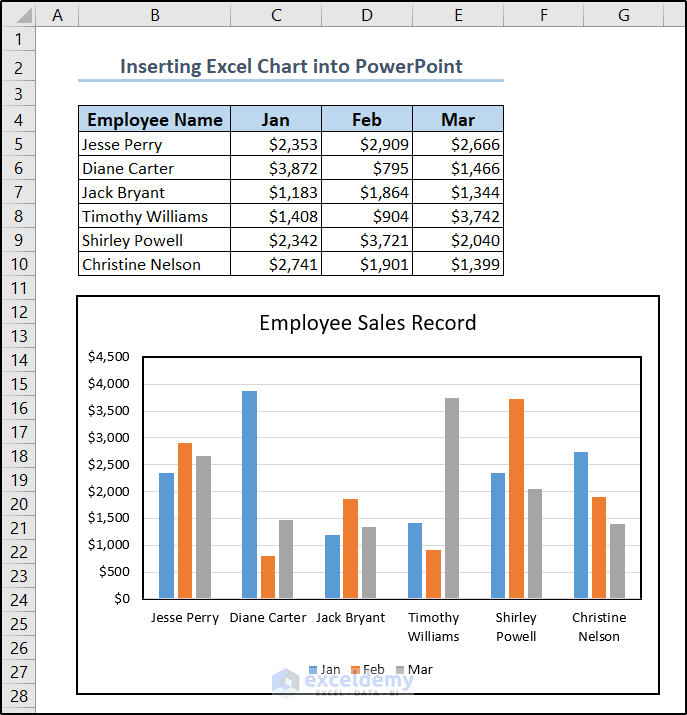
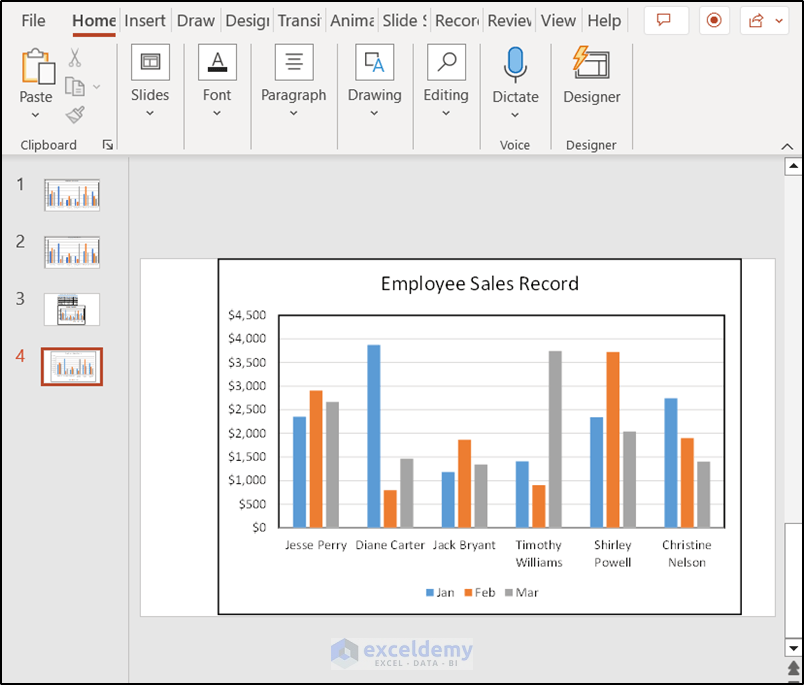
- Select the one you prefer. We have selected a 2-D Column from the Column Chart drop-down and so we have the following chart to work with here.
Method 1: Using Keyboard Shortcuts to Paste a Chart from the Clipboard
Steps:
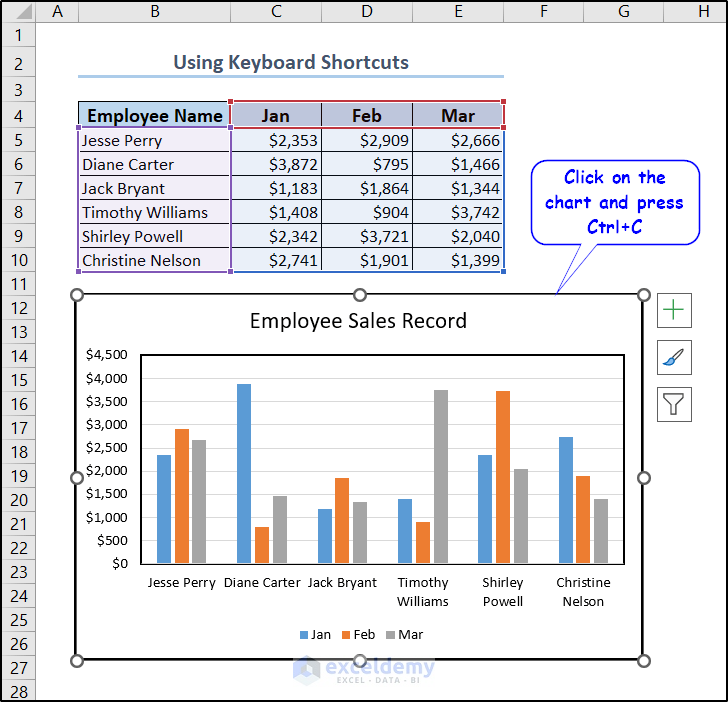
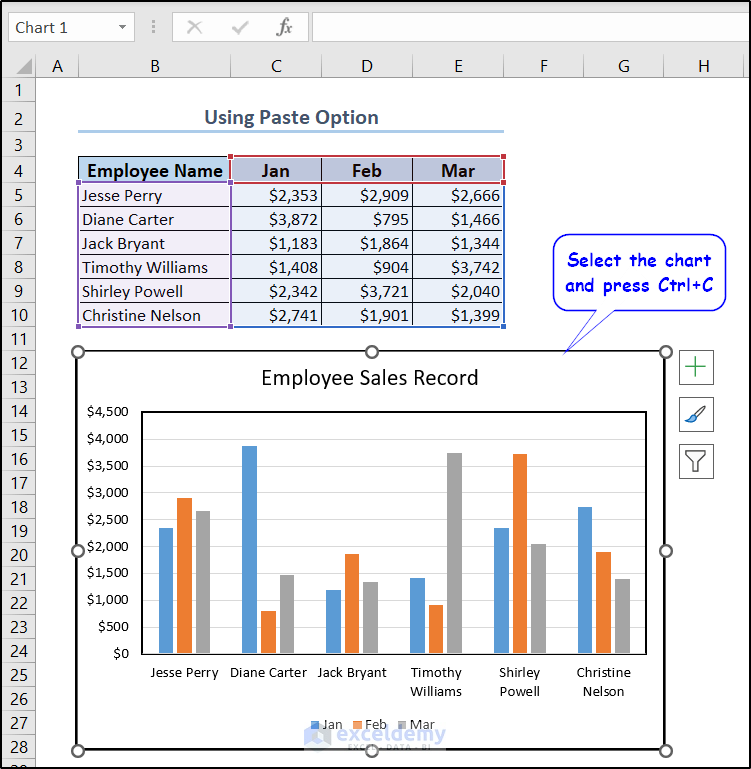
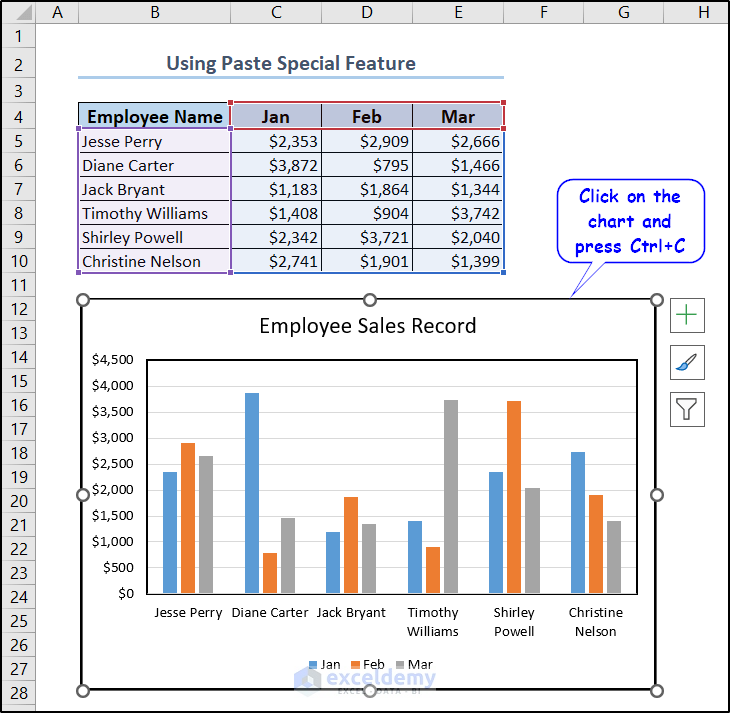
- Go to the Excel spreadsheet and select the chart by clicking on it.
- Copy the chart using Ctrl+C.
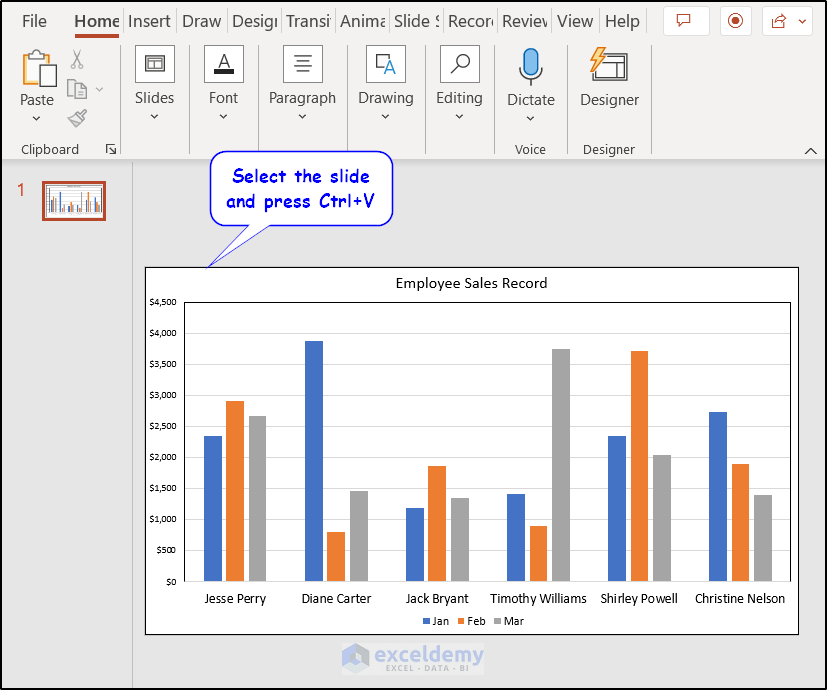
- Go to the PowerPoint slide where you want to paste the chart and press Ctrl+V.
Read More: How to Copy Chart from Excel to PowerPoint Without Link
Method 2: Insert a Chart from Clipboard Through PowerPoint’s Paste Option
Steps:
- Copy the chart from the Excel spreadsheet by pressing Ctrl+C.
Note: As we are using ribbon commands here, we can also do this by the Copy option available in the Clipboard group of the Excel ribbon.
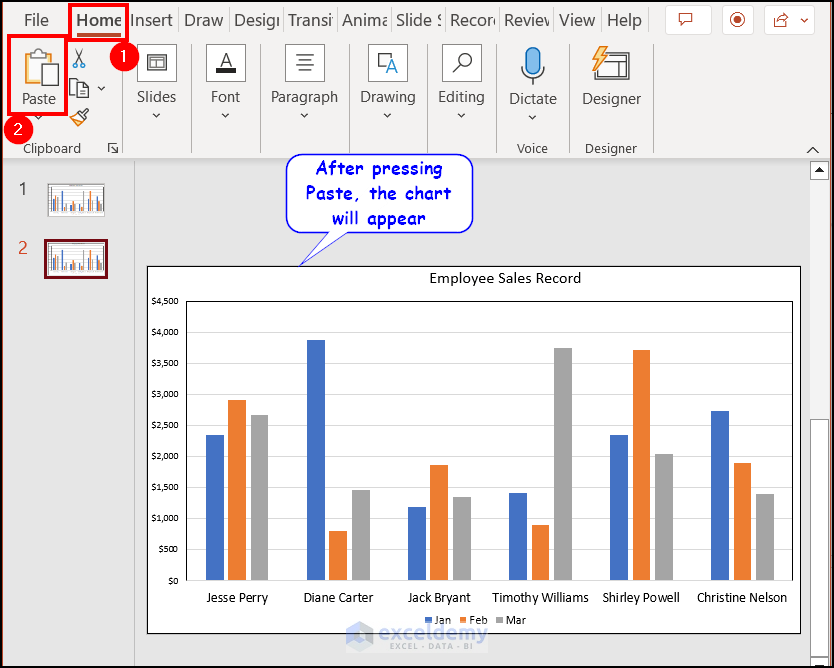
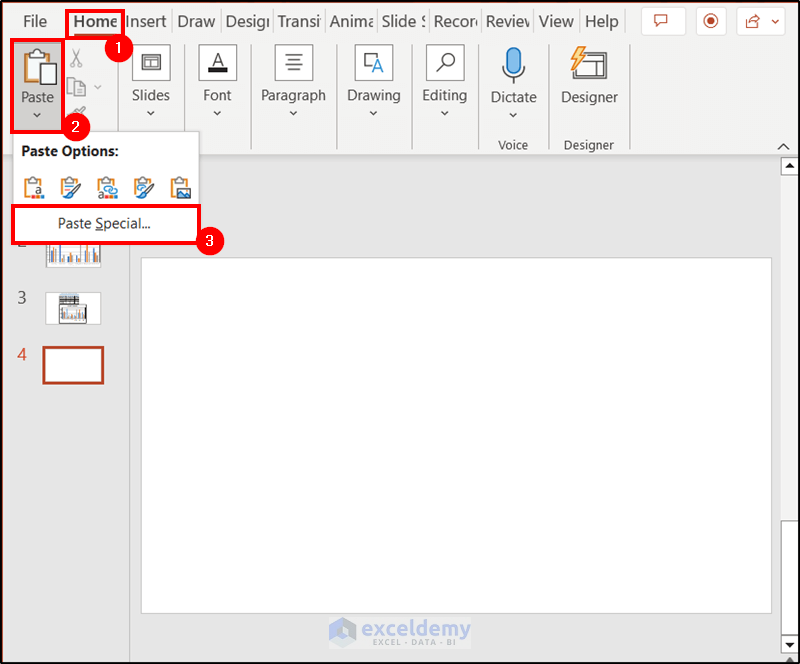
- Select Paste, available in the Clipboard group of the Home tab in Microsoft PowerPoint to insert it into the selected slide.
OR
- Select the downward-facing arrow below Paste to find more options and select the one you find appropriate.
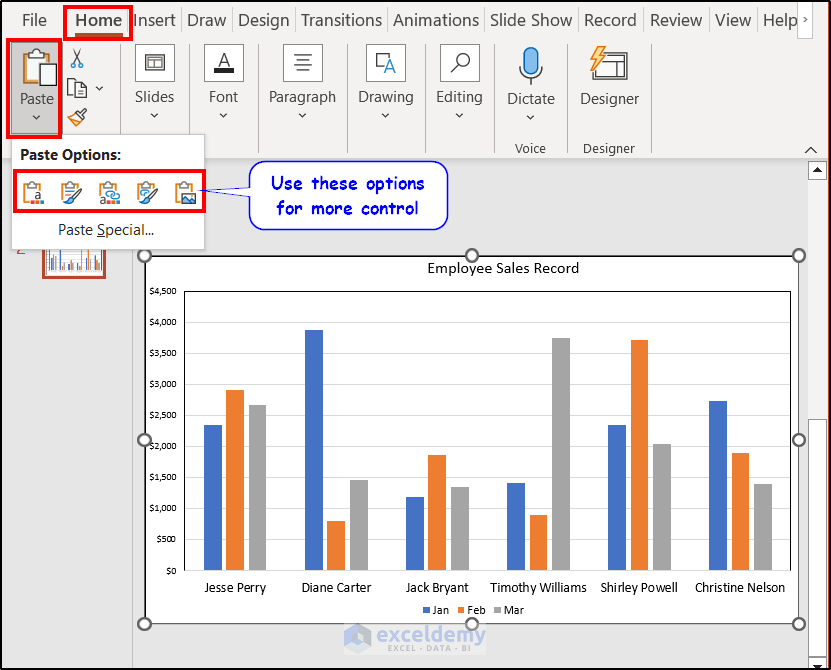
Note: The latter provides more control, consistency, and accessibility over the pasted content, not just for charts but for everything to paste from a clipboard.
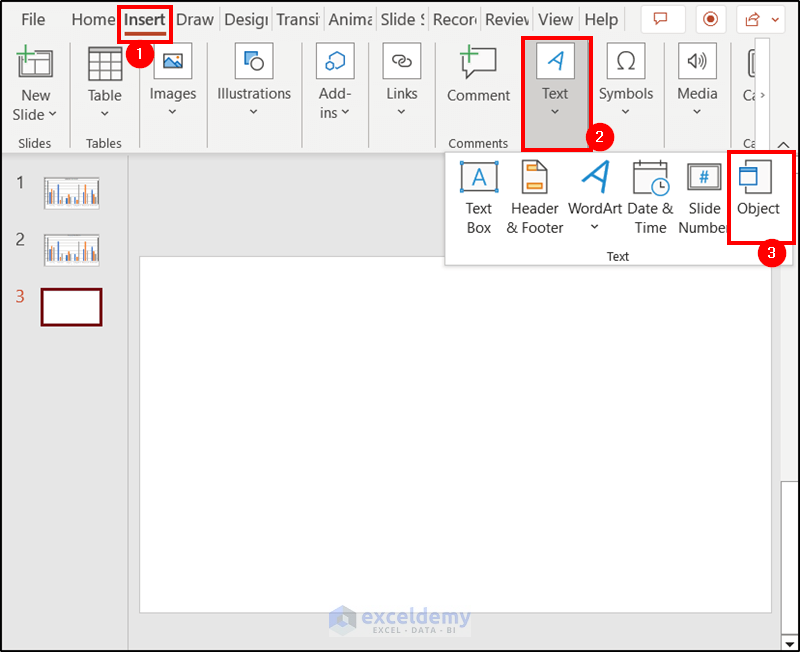
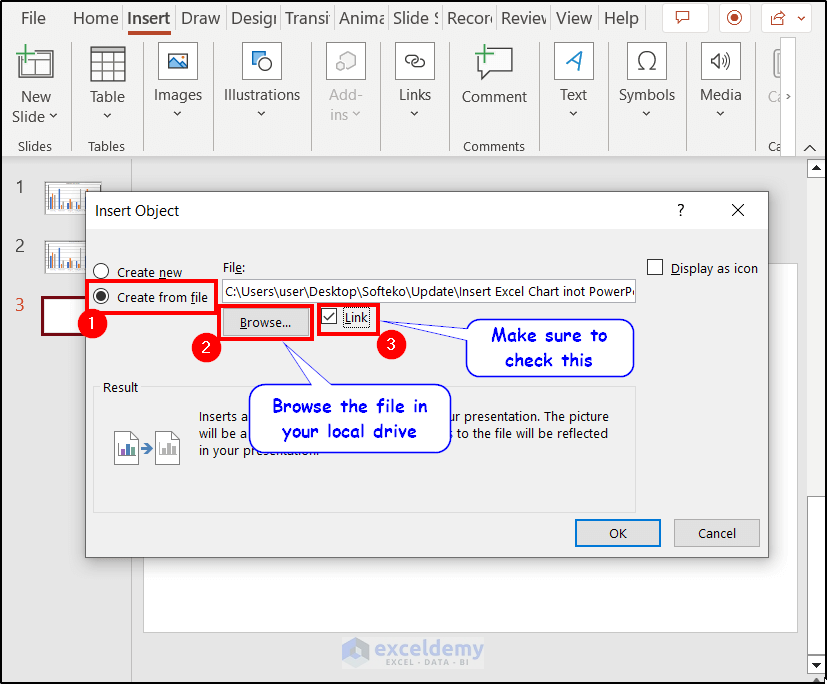
Method 3: Link Dynamic Charts Using the Insert Command
Steps:
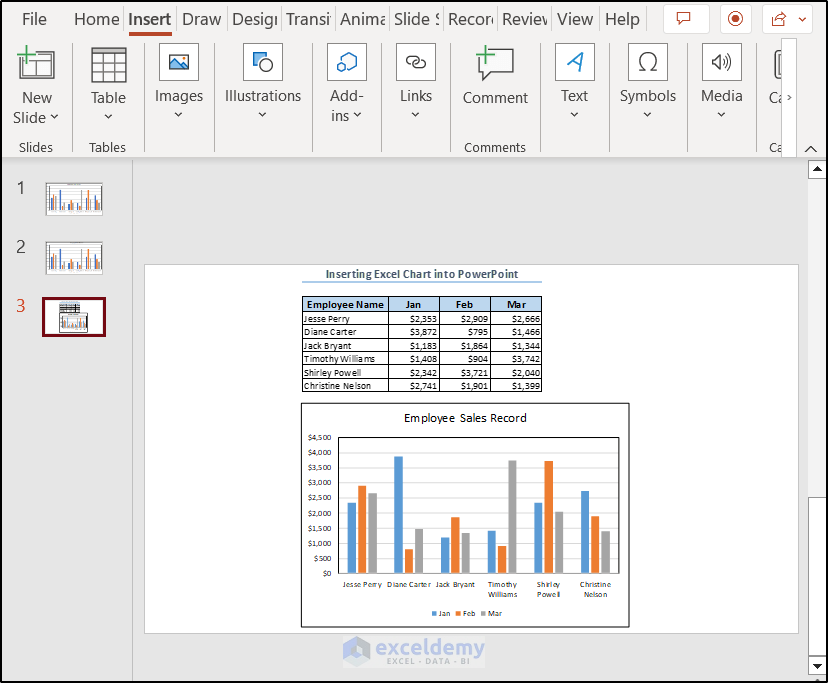
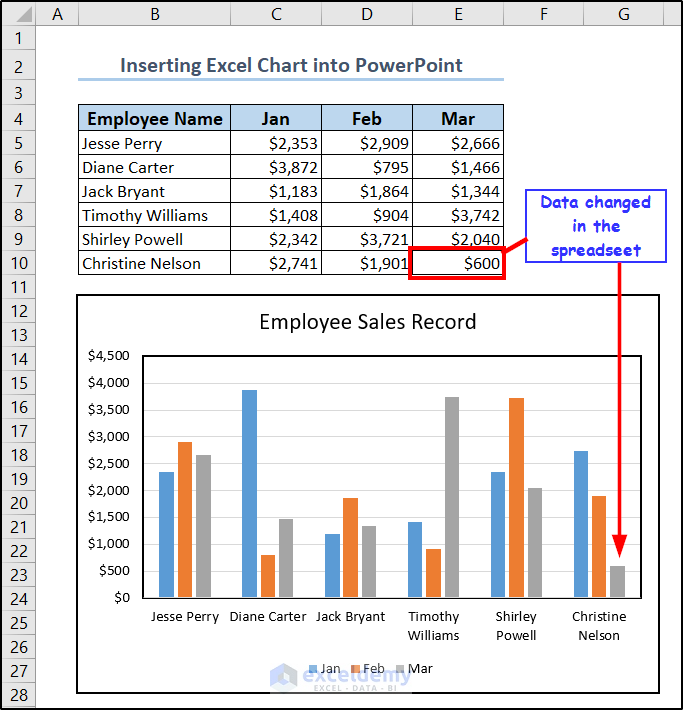
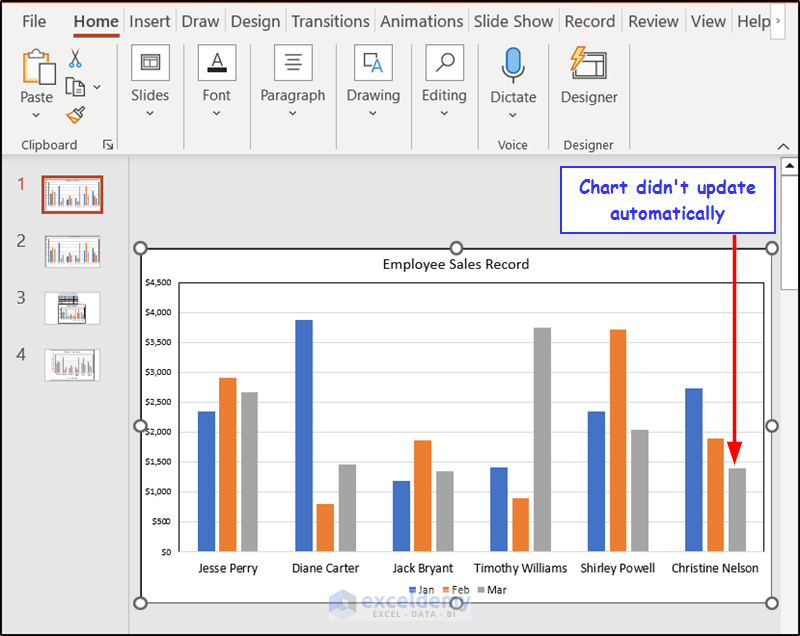
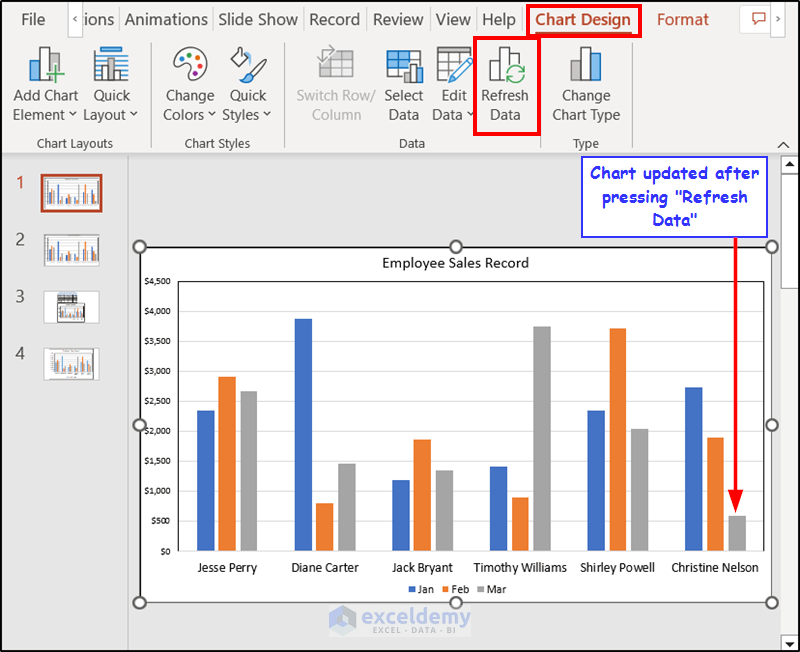
This method doesn’t require any copying like the other methods. As we can see from the image above, this also imports the dataset along with the chart. This method imports the whole sheet from Excel and the slide will contain everything it has. Note: This method only imports charts, datasets, and objects from the first spreadsheet. If the chart you are concerned about is in any other sheet, put it in the first one, or this will not work. Steps: This method inserts the chart and connects them through a link. So once the Excel data or chart is updated, the chart in PowerPoint also updates. Read More: How to Copy Table from Excel to Powerpoint with Formatting One of the disadvantages involved in copying and pasting methods (1 & 2) is that it doesn’t update automatically every time data changes in the Excel worksheet. However, you can refresh the charts manually to counteract this problem. Suppose, we change the data in cell E6 of our dataset. However, the chart in PowerPoint didn’t update automatically. In these cases, an option called Refresh Data can help us update the chart after editing the Excel file. You can find the option in the Data group of the Chart Design tab from the PowerPoint ribbon. Note: The Chart Design and Format tabs appear on the ribbon only after you click on the chart. It is not uncommon to encounter issues such as updates with linked charts. If you are facing these issues or just want to maintain them in your PowerPoint presentation, here are some troubleshooting steps. Download the Practice Files You can download the workbook and the PowerPoint file used for the demonstration from the link below. << Go Back to Excel to PowerPoint | Export Data from Excel | Learn Excel
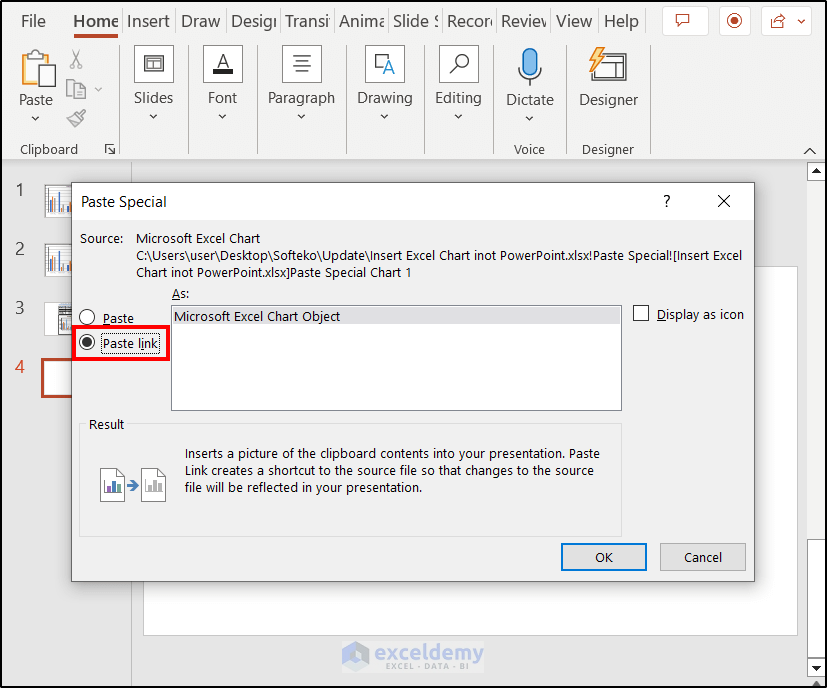
Method 4: Link an Excel Chart Using the Paste Special Option of PowerPoint
How to Refresh Linked Excel Charts
How to Troubleshoot Linked Charts in Excel
Things to Remember
Related Articles

