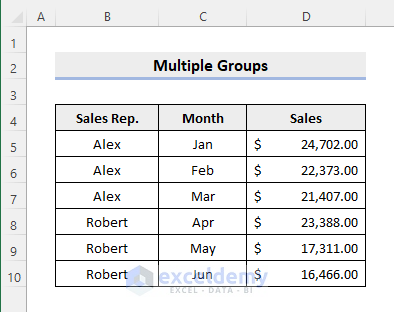
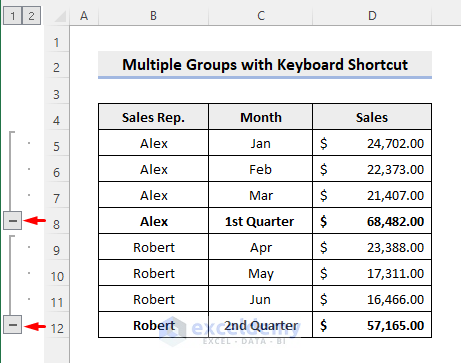
The following dataset contains the names of the sales representatives for each month and the corresponding sales. We want to group the sales by quarter.
Method 1 – Using a Keyboard Shortcut
Steps:
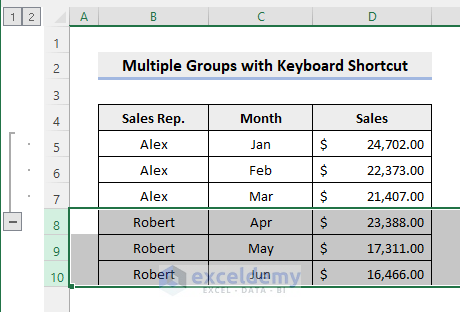
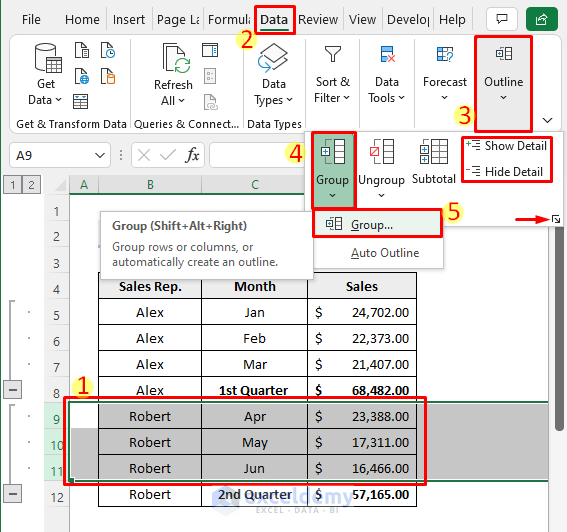
- Select the rows you want to group together by clicking the row numbers.
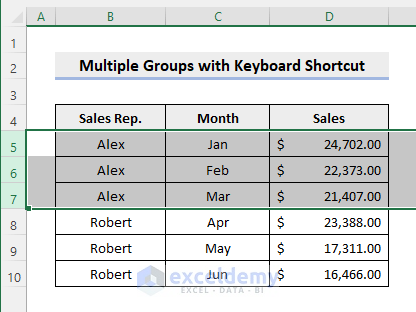
- Press SHIFT+ALT+Right Arrow(➜).
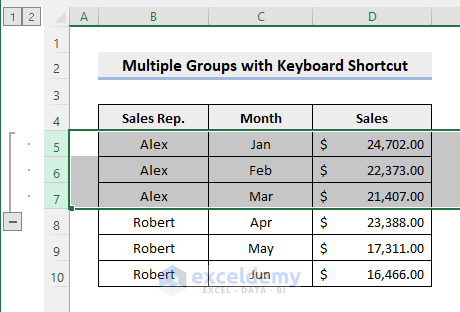
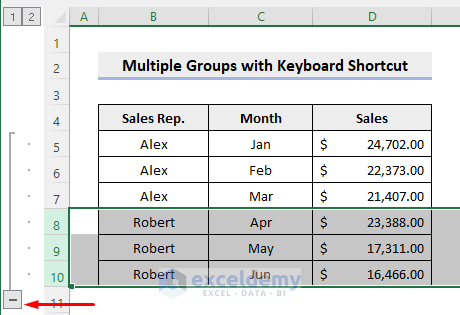
You will see the following result. To hide the grouped rows, click on the negative icon left of the row numbers.
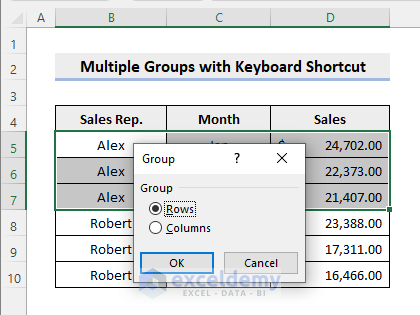
- If you select a range of cells instead, you must confirm whether to group rows or columns.
- Select the other rows which you want to group together.
You may not get the desired results because the dataset is not formatted properly. Therefore, you may end up with a single group instead of multiple ones.
- Insert a new row below row 7 to format the dataset properly to create multiple groups.
- Enter the following formula in cell D8 to show the total sales for the first quarter:
=SUM(D5:D7)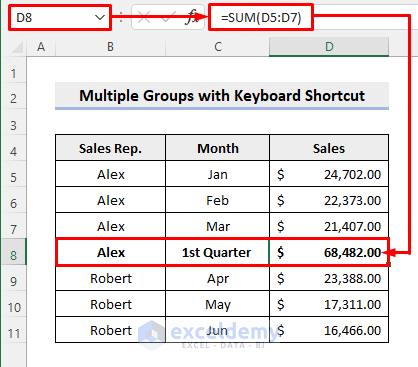
- Enter the following formula in cell D12 to show the sales total for the second quarter:
=SUM(D9:D11)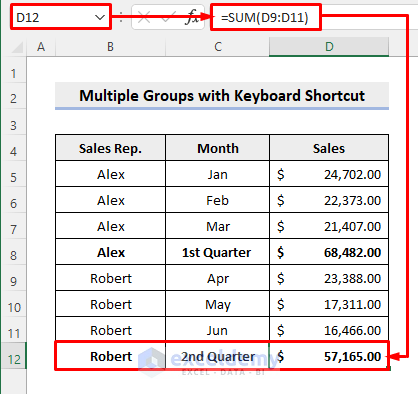
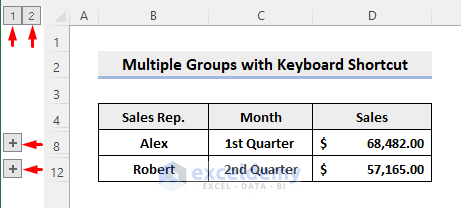
- Use the keyboard shortcut to group rows 5:7 and 9:11. You will get the following result.
- Show/hide the group contents by clicking on the icons at the left of the row numbers.
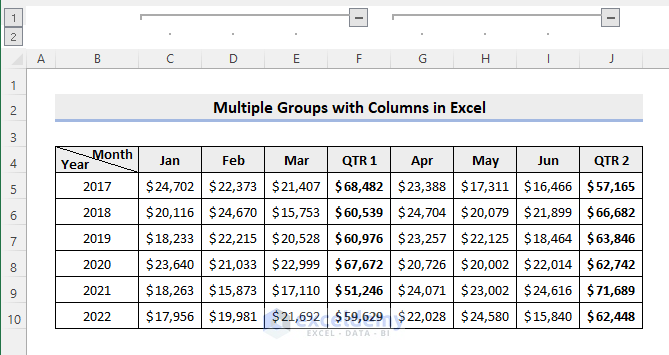
- Create multiple groups with columns in the same way. The result will look as follows.
Read More: How to Group Columns Next to Each Other in Excel
Method 2 – Using the Group Command
Steps:
- Format the dataset properly as in the earlier method.
- Select the rows or columns which you want to group together.
- Select Data >> Outline >> Group, as shown below.
- Repeat this procedure for other rows or columns.
You will get the same result.
Read More: How to Group and Ungroup Columns or Rows in Excel
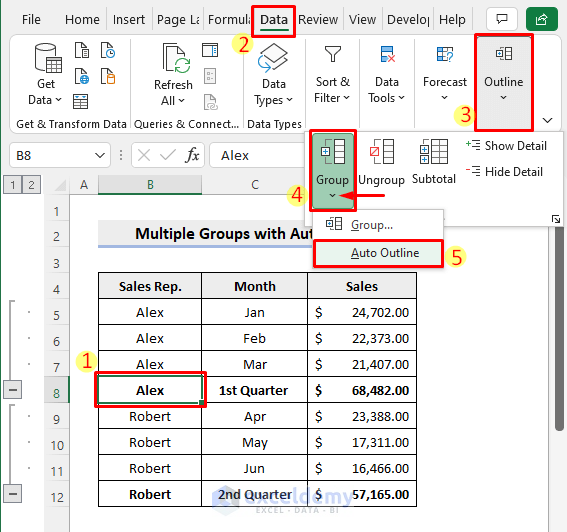
Method 3 – Using the Auto Outline Feature
If your dataset is formatted properly, you don’t need to repeat the same process to create multiple groups as in the earlier methods.
- Click anywhere in the dataset and select Data >> Outline >> Group >> Auto Outline, as shown below.
Excel will automatically create multiple groups based on your dataset.
- If the dataset is not formatted properly, then Excel will show the following error.

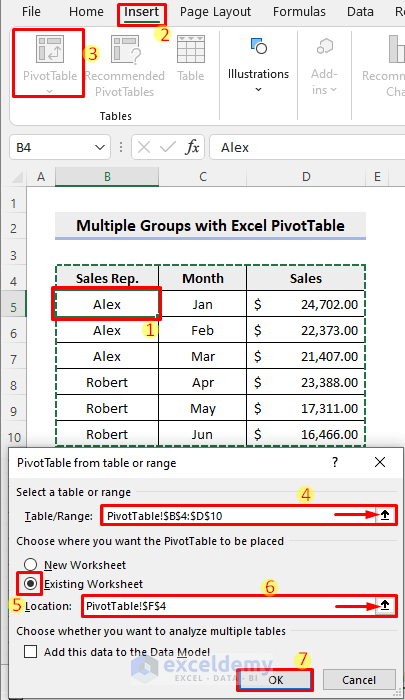
Method 4 – Using an Excel Pivot Table
Steps:
- Select anywhere in the dataset.
- Select Insert >> PivotTable. Excel will automatically detect the range of the dataset.
- Or, use the upward arrow to input the data range for the PivotTable.
- Mark the radio button for the Existing Worksheet and enter the location.
- Click OK.
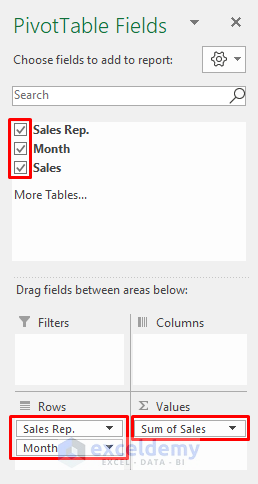
- Check the checkboxes for the listed fields in the PivotTable Fields pane at the right. Drag them to their respective areas.
- Excel will detect similar data types in the dataset and automatically group them together as follows.
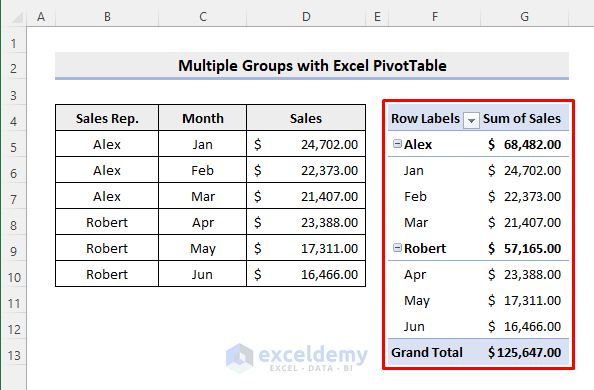
- Otherwise, select the rows or columns in the PivotTable and right-click to group them.
Read More: How to Group Similar Items in Excel
Things to Remember
- You must create your dataset so that Excel can differentiate between various subsets of data within it. For example, keep an empty or differently formatted row or column between two subsets of data.
- You can use the SHIFT+ALT+Left Arrow(⬅) shortcut to ungroup any grouped data.
Download the Practice Workbook
You can download the practice workbook using the download button below.
Related Articles
- How to Group Time Intervals in Excel
- How to Remove Grouping in Excel
- How to Use Grouping and Consolidation Tools in Excel
- How to Group Cells with the Same Value in Excel
- How to Group Duplicates in Excel
<< Go Back to Group Cells in Excel | Outline in Excel | Learn Excel
Get FREE Advanced Excel Exercises with Solutions!

Hi, could you advise how you can “add” columns to a grouping.
I have a payments spreadsheet that changes month on month, and need to “hide” previous months, and have done this by grouping the columns, but adding columns to the exisitng grouping as the months go by is challenging as currently I am applying fomatting to the “new” columns to include them in the grouping, but this is hit and miss. Is there another way, other than removing and re-applying?
Hello Vanessa,
You will need to extend the grouping manually to add new columns to an existing grouping without removing and reapplying the grouping. Follow the steps below to do so:
1. If your current group is collapsed, click the plus sign (+) next to the grouped columns to expand them.
2. Select the new columns that are adjacent to the existing grouped columns.
3. Go to the Data tab >> from Outline group >> select Group.
Now, Excel will automatically add the new columns to the existing group.
Regards
ExcelDemy