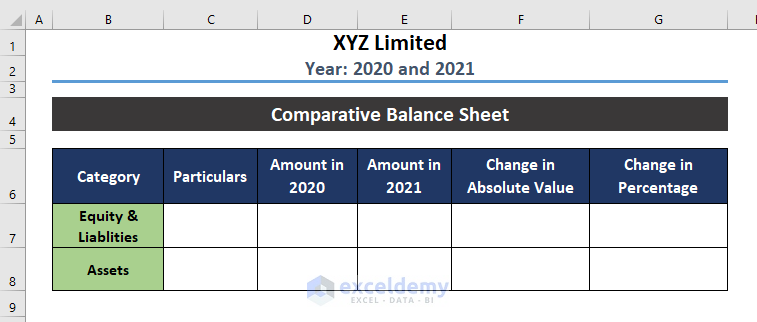
Step 1 – Assign Particulars for the Balance Sheet
- Create a table like the one stated in the image below. Usually, a balance sheet consists of two main categories of particulars.
- Equity & Liabilities
- Assets
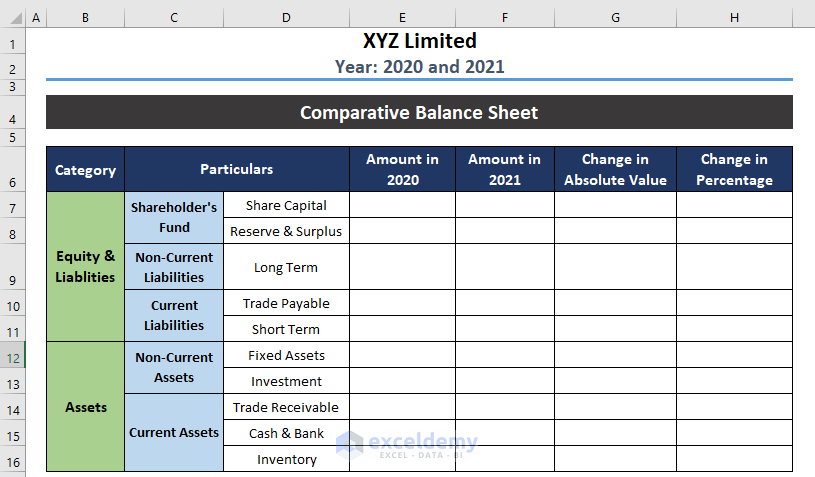
- Assign particulars for these two main categories. For Equity & Liabilities, we have assigned:
- Shareholder’s Fund
- Non-Current Liabilities
- Current Liabilities
For Assets, the particulars considered are:
- Non-Current Assets
- Current Assets
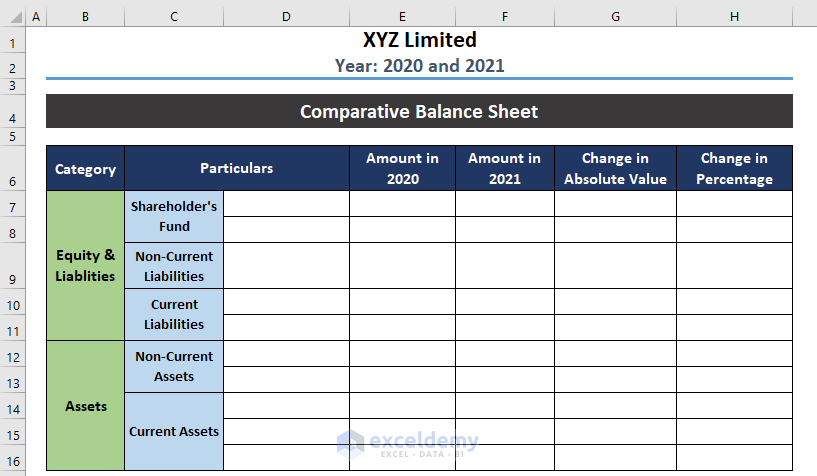
- Assign some components as per your business strategy.
Step 2 – Input Values for the Time Period
- Insert the values for the first financial year (i.e. 2020).
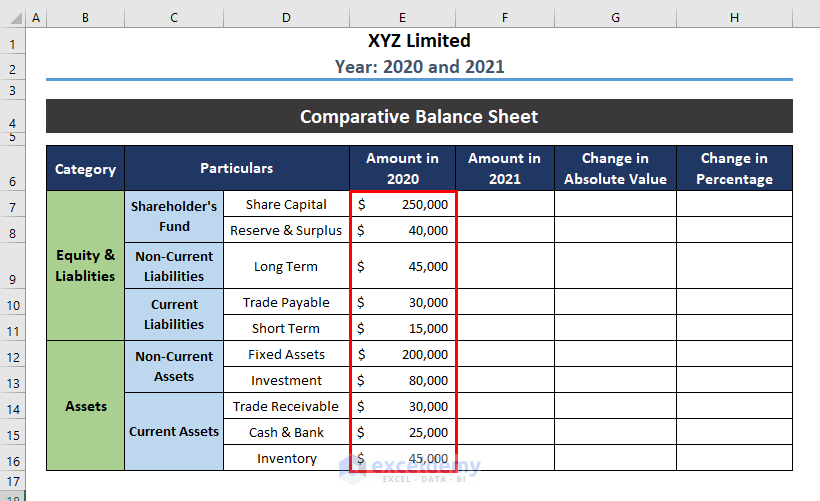
Note: Change the cell format to Accounting or Currency to make a clear visual representation of monetary value.
- Select a cell where you want to show the total amount of Liabilities and use the following formula:
=SUM(E7:E11)
E7 = First cell of Equity & Liabilities to calculate the sum
E11 = Last cell of Equity & Liabilities to calculate the sum
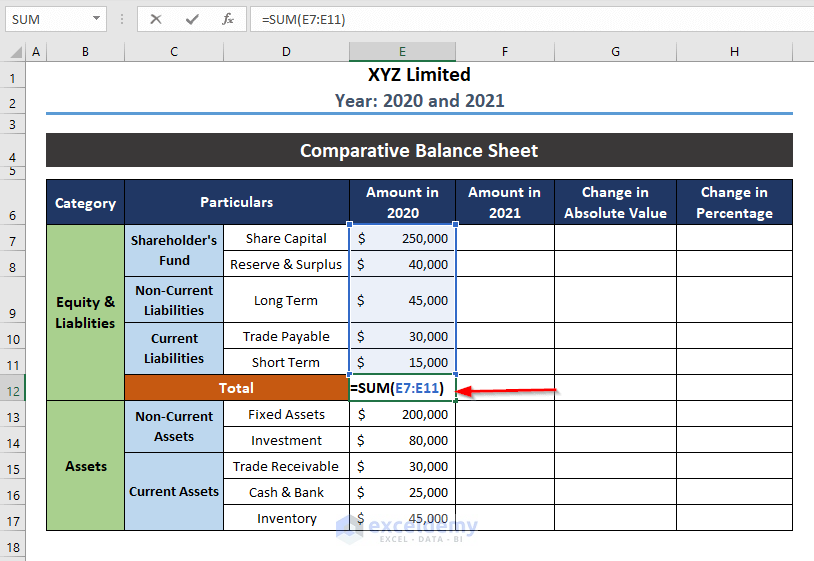
- Press ENTER to get the total amount of Equity & Liabilities.
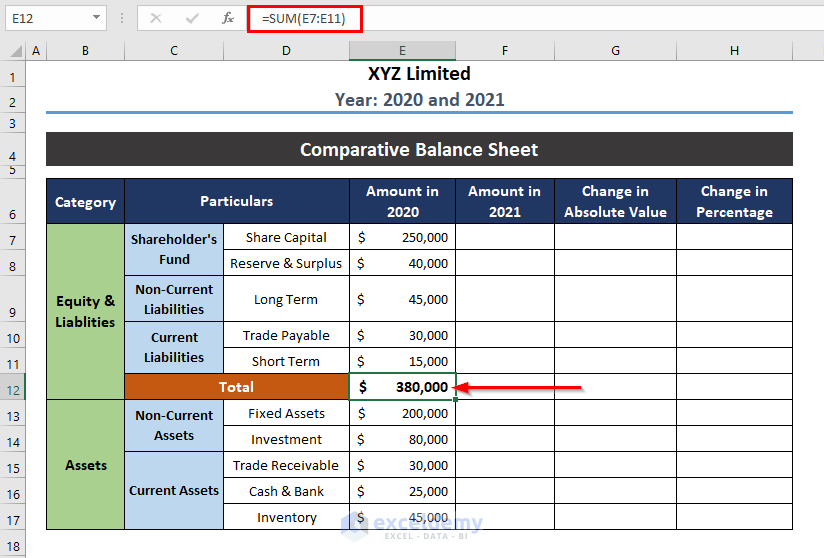
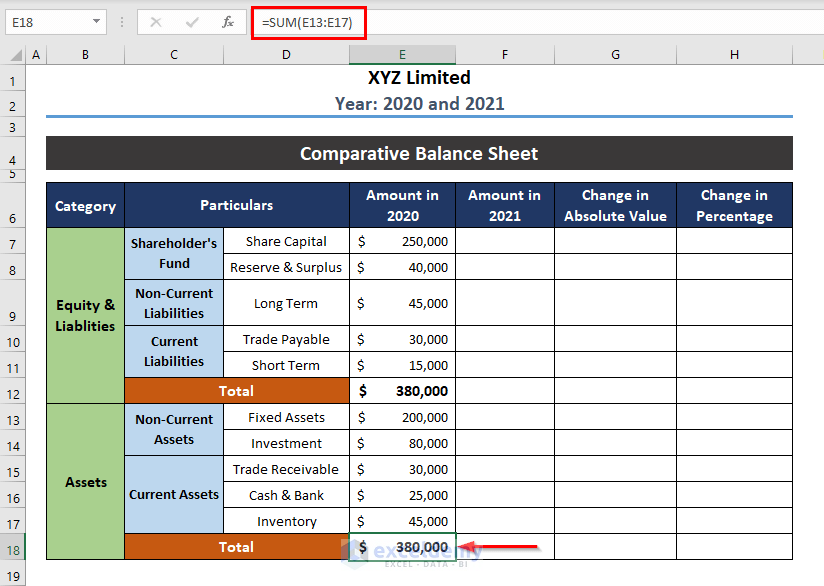
- Calculate the total amount of Assets available in that financial year.
- Repeat the same process for the following financial year (i.e. 2021) and find out the total amount of Assets and Liabilities for this year.
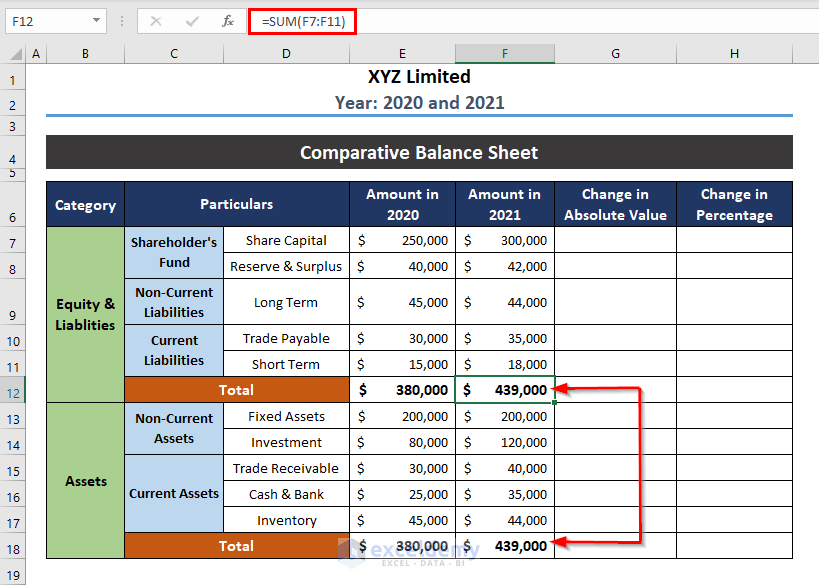
Note: A balance sheet should match the amount of Assets and Liabilities.
Step 3 – Finding the Absolute Change Between Financial Years
- Use the following formula in the column named “Change in Absolute Value”.
=F7-E7
- E7 = Amount of Share Capital in 2020
- F7 = Amount of Share Capital in 2021
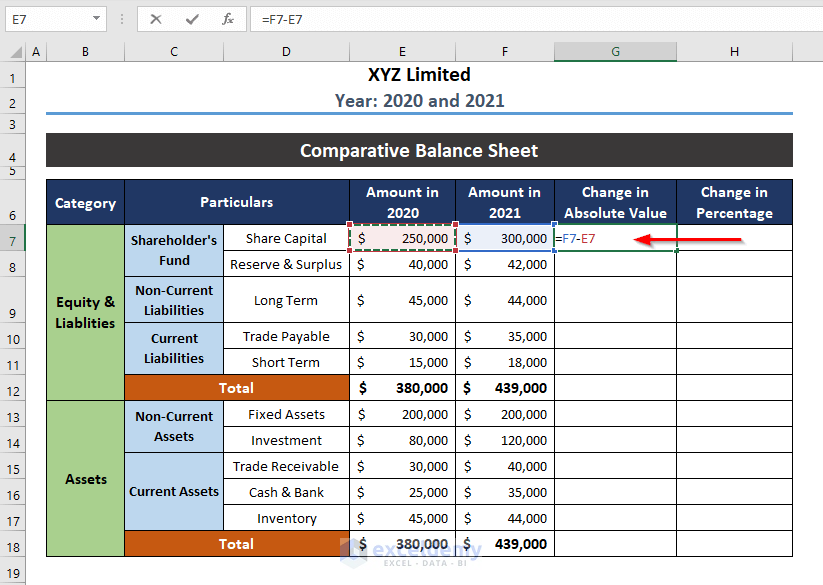
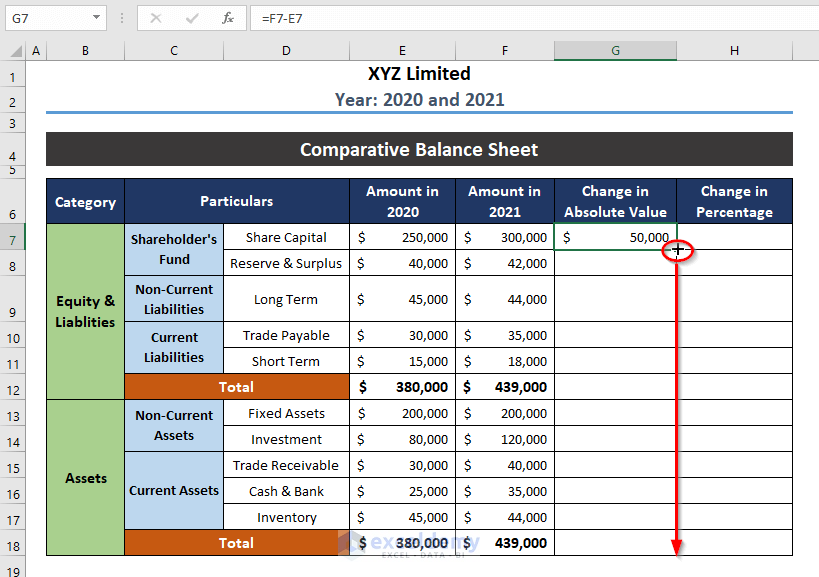
- Press ENTER, and the cell will show you the change in the absolute amount between the financial years.
- Drag the Fill Handle tool down to Autofill the formula.
Step 4 – Determine the Change in Percentage
- Apply the formula below.
=G7/F7
G7 = Change in Absolute Value of Share Capital
F7 = Amount of Share Capital in 2021
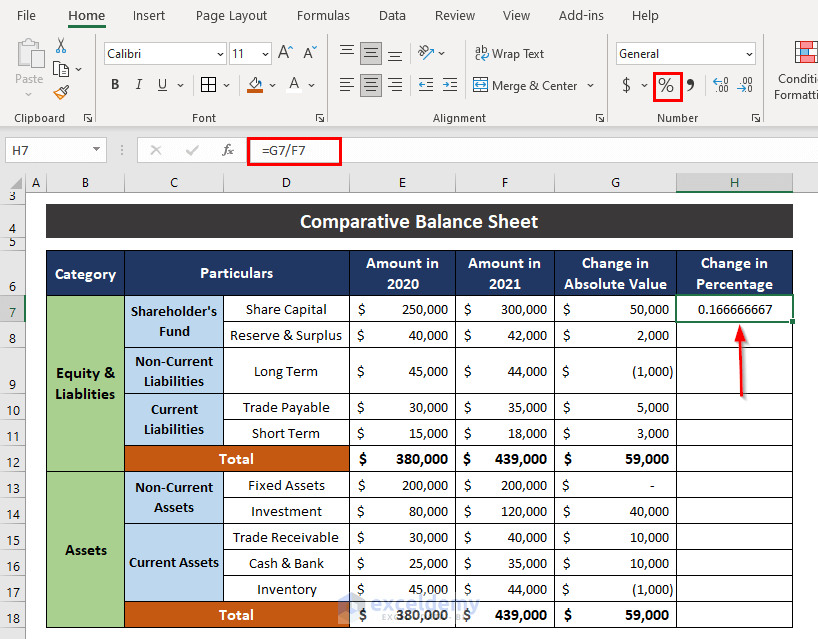
- Go to the Home tab and click Percentile Style on the Number group to change the format to percentage.
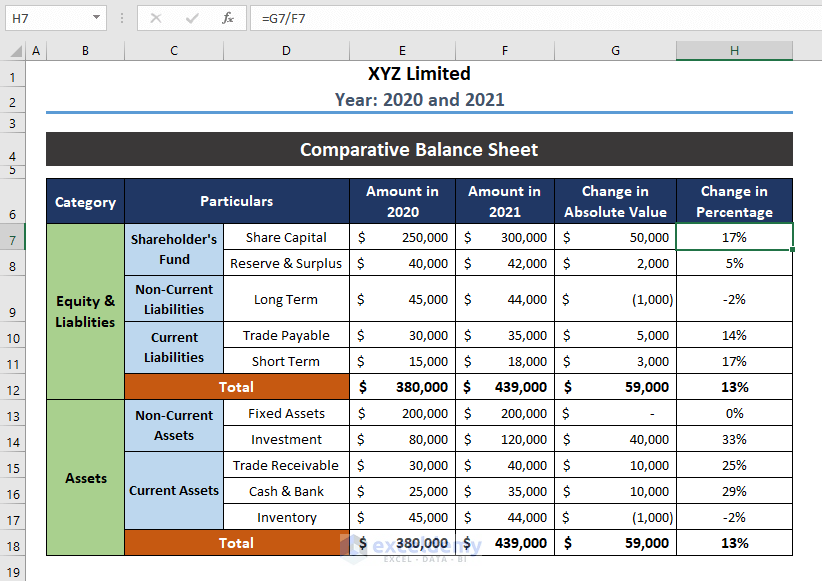
- Drag the formula down and the changes will be found in percentages for every value.
Advantages of a Comparative Balance Sheet
- Analyzing the comparative balance sheet ascertains the condition of company financials. For the balance sheet we are dealing with, Reserve & Surplus has increased by 5% in a financial year. On the other hand, Long Term Liabilities have decreased by 2%.
- A comparative balance sheet projects the trend of the company for several years and shows the fluctuation in the amount of Assets & Liabilities.
- Observing the balance sheet by making a financial comparison between 4-5 consecutive periods helps predict the financial condition of the company.
- Comparing different companies in the same industry helps to make decisions in which sector more priority should be given for ultimate profit.
Download the Practice Workbook
Related Articles
- How to Create Monthly Balance Sheet Format in Excel
- How to Create Provision Balance Sheet Format in Excel
- Create Average Daily Balance Calculator in Excel
- Net Worth Formula Balance Sheet in Excel
<< Go Back to Balance Sheet | Finance Template | Excel Templates
Get FREE Advanced Excel Exercises with Solutions!
