
Image by Editor
In this article, we will list 7 project ideas to showcase your technical skills and analytical thinking that will make your portfolio stand out to potential employers.
1. Sales Performance Dashboard
Create an interactive sales dashboard that allows users to analyze performance across different dimensions, such as monthly and product-wise sales performance.
Skills Showcased:
- PivotTables and PivotCharts.
- Timeline and slicers.
- Conditional Formatting.
- Dynamic Charts (Line, Bar, and Pie).
- Data Visualization
- Named Ranges and Drop-down Filters
Dataset Structure:
- Date
- Order ID
- Customer ID
- Product
- Category
- Quantity
- Unit Price
- Revenue
Portfolio Output:
- An interactive dashboard summarizing revenue trends.
- Build summary metrics with dynamic KPIs.
- Product performance comparison chart.
- Sales breakdown by region and category.
- Create trend charts that respond to time period selections.
- Use slicers for filtering by product, region, or sales rep.
- Implement conditional formatting to highlight performance thresholds.
- Add sparklines for compact trend visualization.

Detailed Guide: Sales Template
2. Customer Segmentation Analysis
Perform customer segmentation using RFM (Recency, Frequency, Monetary) analysis to identify high-value customers and group them into actionable clusters.
Skills Showcased:
- Calculated columns for RFM scores.
- Quantile-based ranking using QUARTILE.INC() or RANK().
- Logical functions (IF, AND) for segment labeling.
- PivotTables to summarize segment behavior.
- Conditional formatting to highlight VIPs.
Dataset Structure:
- Customer ID
- Last Purchase Date
- Purchase Frequency
- Total Spent
- Days Since Last Purchase (Recency)
Portfolio Output:
- Segmentation dashboard with RFM score distribution.
- Heatmaps for segment value comparison.
- Strategic insights for marketing focus (e.g., VIPs, At-Risk, New Customers).
- Clean and prepare raw customer data.
- Use IF and nested IF statements to assign segment categories.
- Calculate key metrics for each segment.
- Generate insights and recommendations based on findings.

Detailed Guide: Customer Segmentation Analysis
3. Social Media Analytics Dashboard
Analyze the performance of social media performance to track growth, engagement, and content effectiveness across platforms.
Skills Showcase:
- Time Series Analysis (follower growth over time).
- Engagement Metrics (likes, comments, shares, CTR).
- Text analysis (hashtags, keyword frequency).
- Trend analysis (best time/day to post).
- Interactive Dashboards (with slicers by platform or campaign).
Dataset Structure:
- Date
- Platform (Facebook, Instagram, X/Twitter, LinkedIn)
- Post Type (Image, Video, Link, Text)
- Impressions
- Reach
- Likes
- Comments
- Shares
- Clicks
- Engagement Rate (%)
- Hashtags Used
- Follower Count
Portfolio Output:
- Dashboard showing engagement by platform.
- Post type effectiveness (e.g., videos get more shares).
- Hashtag frequency word cloud.
- Follower growth chart by week.
- Best posting time based on engagement data.

Detailed Guide: Social Media Analytics
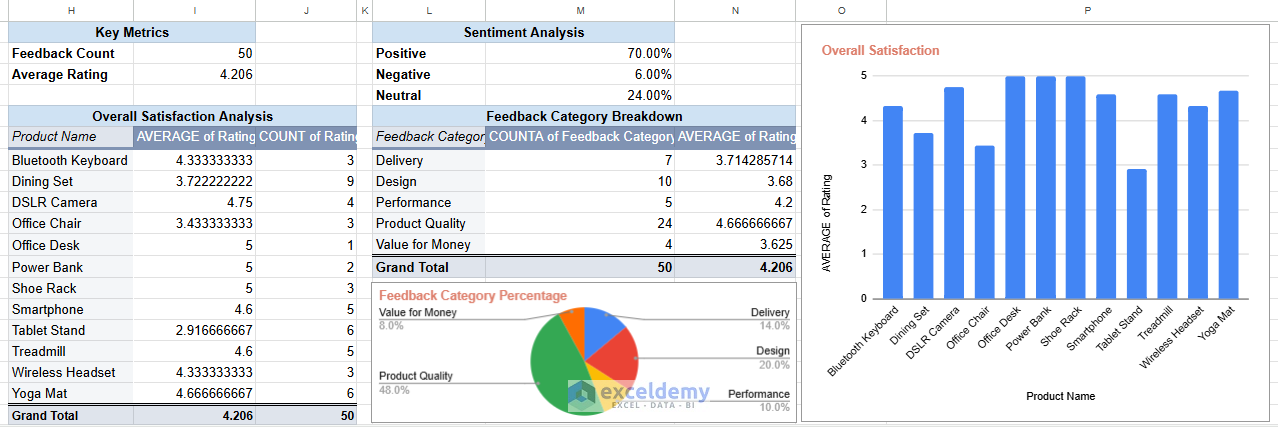
4. Product Review Sentiment Summary
Analyze customer review texts and ratings to calculate sentiment scores and identify top-rated and underperforming products.
Skills Showcased:
- Text functions (SEARCH, LEN, LEFT, MID).
- Sentiment scoring based on keyword matching.
- Summary statistics with bar and pie charts.
- Filtering reviews by sentiment class.
Dataset Structure:
- Product Name
- Review Text
- Star Rating
- Sentiment Category (Positive, Neutral, Negative)
Portfolio Output:
- Bar chart of review sentiment distribution.
- List of highest and lowest-rated products.
- Word frequency table for common review terms.
Detailed Guide: Customer Feedback/Sentiment Analysis
4. Inventory Management Tracker
Build a real-time inventory system to monitor stock levels and get alerts when items fall below the restock threshold.
Skills Showcased:
- Dynamic tables.
- Formulas for tracking real-time stock (SUMIFS).
- Reorder alert logic using conditional formatting.
- Visualization of stock levels with data bars.
Dataset Structure:
- Product Name
- Date
- Stock In
- Stock Out
- Current Stock (calculated)
- Reorder Level
Portfolio Output:
- Inventory dashboard with filtering by item.
- Calculate safety stock levels using standard deviation.
- Implement reorder point calculations.
- Create visualizations of stock levels vs. sales patterns.
- Build automated reordering flags using conditional logic.
- Calculate optimal order quantities.

Detailed Guide: Inventory Management Tracker
5. Financial Model for Business Case
Develop a multi-sheet Excel model for a startup or project proposal that forecasts revenue, expenses, cash flow, and profitability.
Skills Showcased:
- Assumption modeling and sensitivity analysis.
- Financial functions.
- Advanced dynamic formulas using IF, VLOOKUP, INDEX-MATCH, and SUMPRODUCT.
- Linking data across multiple sheets.
- Break-even analysis and net profit margin calculations.
- Scenario analysis, planning with drop-down controls or toggles.
Dataset Structure:
- Assumptions Sheet: Startup costs, price per unit, cost per unit, growth rate, etc.
- Revenue Model: Monthly/Quarterly forecast of units sold, revenue.
- Expense Model: Fixed and variable costs.
- Financial Summary: Income statement, cash flow statement, break-even analysis.
Portfolio Output:
- Create detailed revenue and expense projections.
- Build an income statement, balance sheet, and cash flow statement.
- Visualizations: profit trends, cost structure, revenue breakdown.
- Sensitivity tables for price, growth rate, and expense changes.
- Use NPV and IRR functions to evaluate investment potential.
- Investor-ready output showing EBITDA, net margin, and ROI.
6. HR Analytics Dashboard
Design an all-in-one HR dashboard to monitor headcount, gender diversity, attrition rates, and performance metrics across departments.
Skills Showcased:
- Power Query to import data.
- Data modeling and structured tables.
- PivotTables to track KPIs over time.
- Conditional formatting for alerts (e.g., high attrition).
- Dynamic charts (bar, donut, stacked columns).
- Timeline slicers for period-based filtering.
Dataset Structure:
- Employee ID
- Department
- Gender
- Age
- Join Date
- Exit Date
- Performance Score
- Status (Active/Exited)
Portfolio Output:
- Import and clean HR data using Power Query.
- Headcount over time chart.
- Gender and department diversity visualization.
- Attrition rate analysis with year-wise breakdown.
- Performance distribution by department.
- Executive dashboard sheet with interactive filters.
- Build a salary benchmark comparison.
- Analyze promotion rates and time-to-promotion.
Tips to Make Your Portfolio Stand Out
- Use real-world data when possible (or realistic dummy data).
- Use a README tab in your Excel files to explain your objective, logic, and insights.
- Upload your Excel files to Google Drive, GitHub, or a personal website for public access.
- Export dashboards as PDFs or images to include in your portfolio or resume.
- Prepare a one-pager (PDF or slide) for each project with visuals and a summary.
- Consider recording short video walkthroughs explaining key features
- Share your work on LinkedIn, portfolio platforms, or in your interview presentations.
Each of these projects demonstrates different Excel capabilities while solving real business problems, making them valuable additions to your data analysis portfolio. Start with any of these seven projects, tweak them with your creativity, and explain them well on your resume or LinkedIn. Your Excel expertise will speak for itself!
Get FREE Advanced Excel Exercises with Solutions!

Hey, these projects are amazing. I´d like to have them, but for some reason, after clicking the option to get and filling out the two fields, I am not getting an email or a download.
Hello Michael Pimentel,
Thank you for your interest! Sometimes the email with the download link may end up in your Spam/Junk folder, so please check there. We have updated the article with the projects link.
Please explore the article again, all the project links are already included there for direct access.
Regards,
ExcelDemy