Understanding Differential Equations
- A differential equation relates one or more functions to their derivatives with respect to an independent variable.
- The highest order of the derivative determines the order of the differential equation.
- Differential equations are used to model growth, decay, and various phenomena, including physics applications.
Problem Statement
- Given the differential equation:
dy/dx=f(x)
- Initial condition:
- We want to compute the values of
in the time interval
.
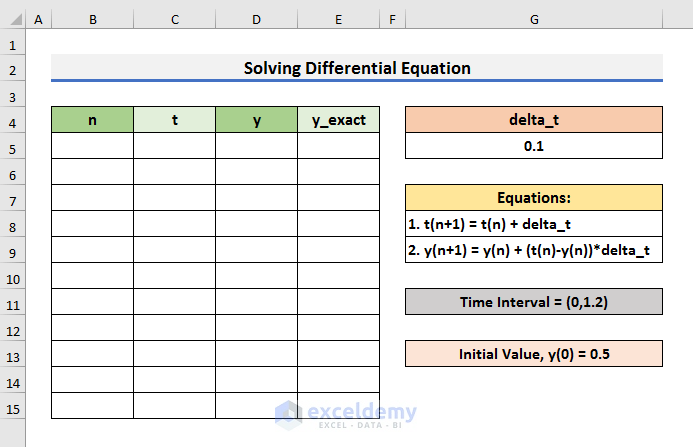
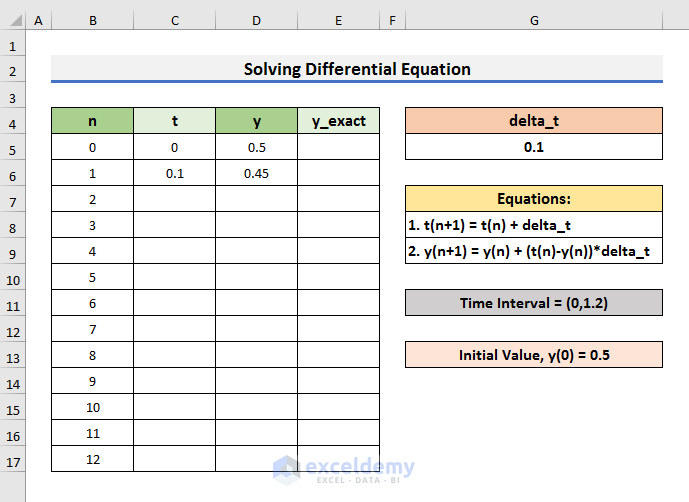
STEP 1 – Create a Dataset
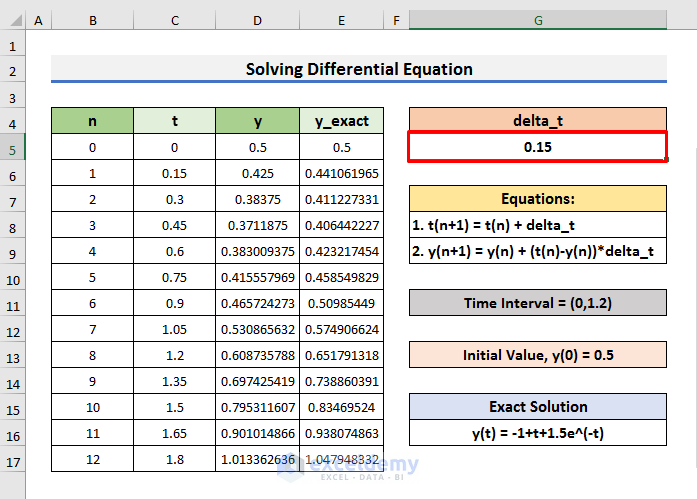
- Create a dataset to insert the iteration number (n), time value (t), y value, y–exact value, and delta_t.
- The delta_t is the separation value.
- Display the equations to find the t(n+1) and y(n+1) values.
- Add the time interval and initial value to make the calculation easy.
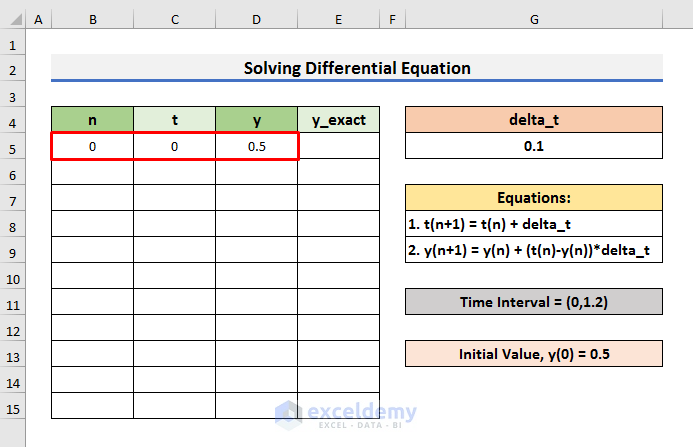
STEP 2 – Apply the Formula for Time Values & Y-values
- Apply formulas to calculate the time values and y-values.
- At the start of the iteration, n is 0, t is 0, and y is 5.
- Insert these values in Cells B5, C5, and D5 respectively.
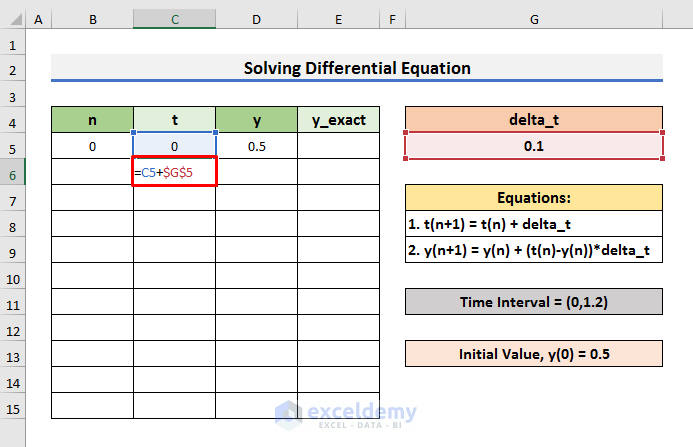
- Insert a formula to calculate the t-values.
- Select Cell C6 and enter the formula below:
=C5+$G$5- Press Enter.
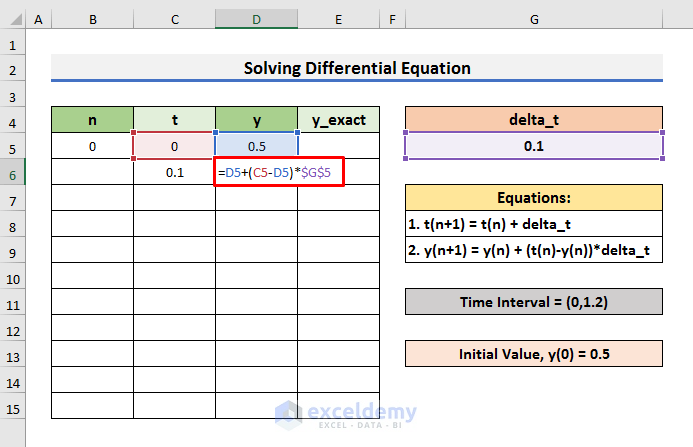
- To find the y-values:
- Select Cell D6 and enter the formula below:
=D5+(C5-D5)*$G$5-
- Press Enter to see the result.
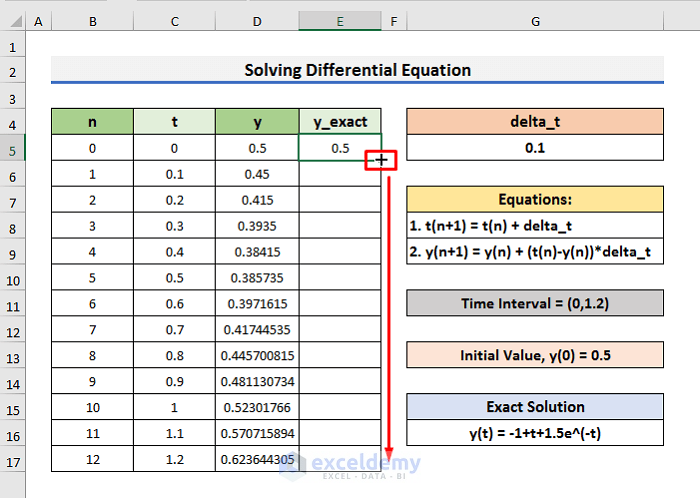
STEP 3 – Fill the Columns
- To fill the values in the n, t, and y columns:
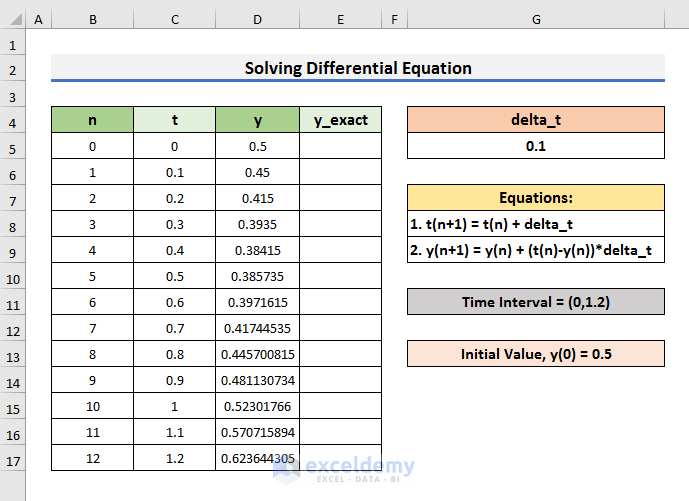
- To find the number of iterations (n), divide the time interval by the delta_t value.
- In this problem statement the iteration number (n) = (2/0.1) = 12.
- Fill the iteration column from 0 to 12.
-
- Select both Cells C6 & D6 and drag the Fill Handle down.
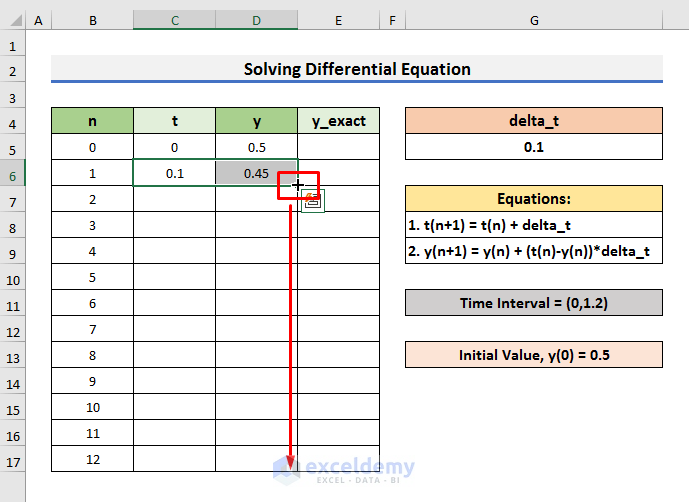
-
- The t and y–values have been calculated.
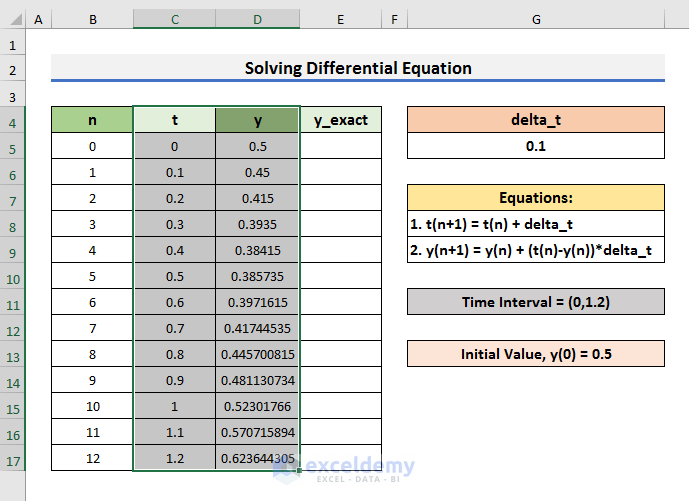
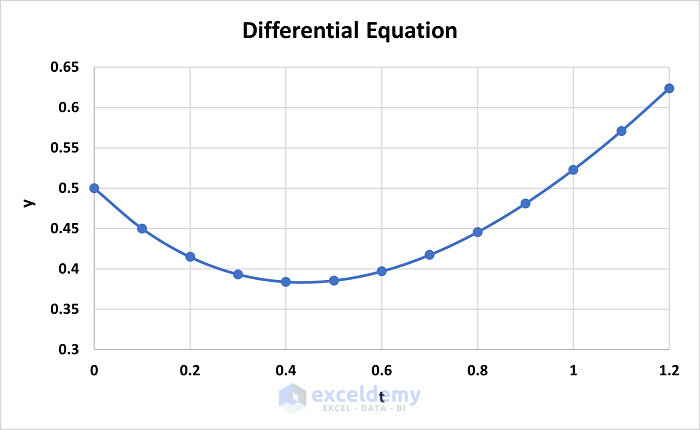
STEP 4 – Plot the Data
- To plot the t and y–values, select the range C4:D17.
- Go to the Insert tab and click on the Insert Scatter icon. A drop-down menu will appear.
- Select Scatter with Lines.
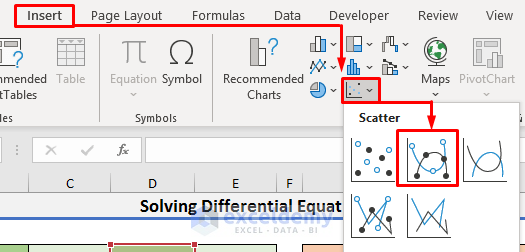
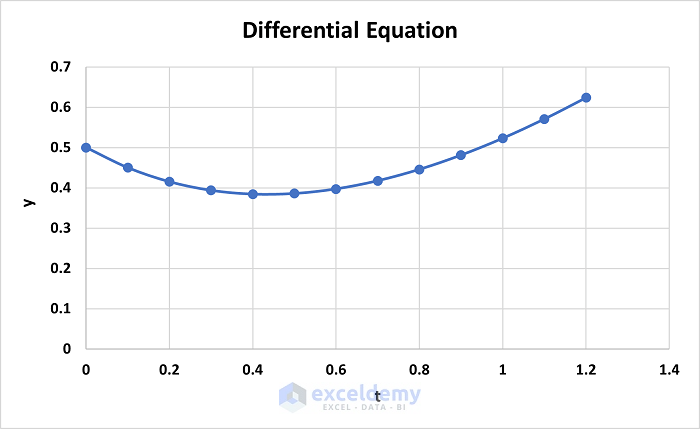
- As a result, a chart will display on the sheet.
- Change the chart title according to your preferences.
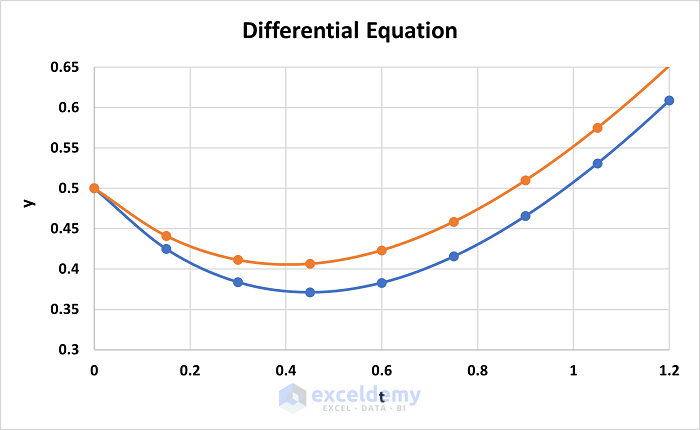
STEP 5 – Format Axis
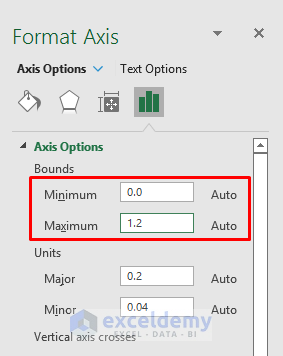
- To format the axis of the graph:
- Double–click on the horizontal axis. It will open the Format Axis options on the right side of the sheet.
- Set the Minimum value to 0 and Maximum value to 1.2 in the Bounds section.
- Press Enter.
-
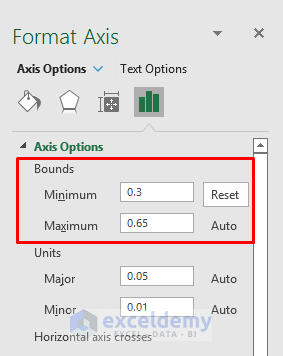
- Double–click on the vertical axis.
- Set the Minimum value to 0.3 and Maximum value to 0.65 in the Bounds section.
- Press Enter.
- The graph will look like the picture below:
Read More: How to Solve an Equation for X When Y is Given in Excel
STEP 6 – Find the Exact Solution
- The exact solution of the differential equation is y = -1 + t + 1.5*exp(-t).
- Select Cell E5 and enter the formula below:
=-1+C5+1.5*EXP(-C5)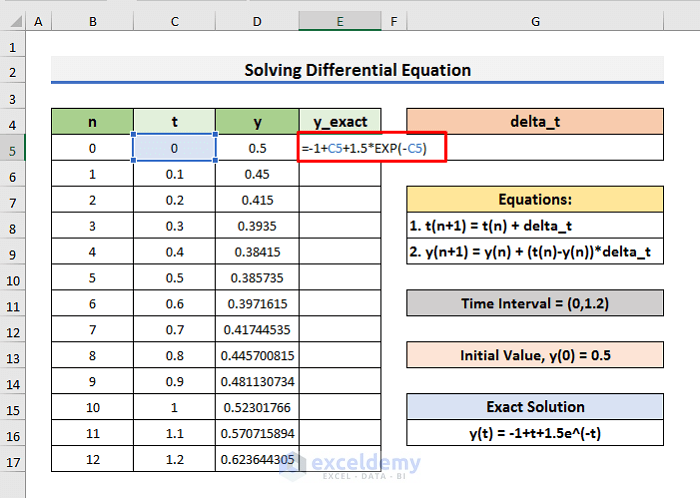
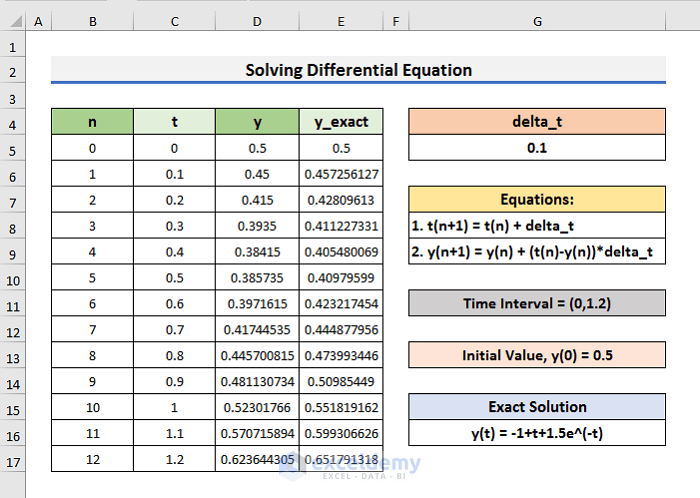
- Press Enter and drag the Fill Handle down.
- The y-values of the exact solution have been calculated.
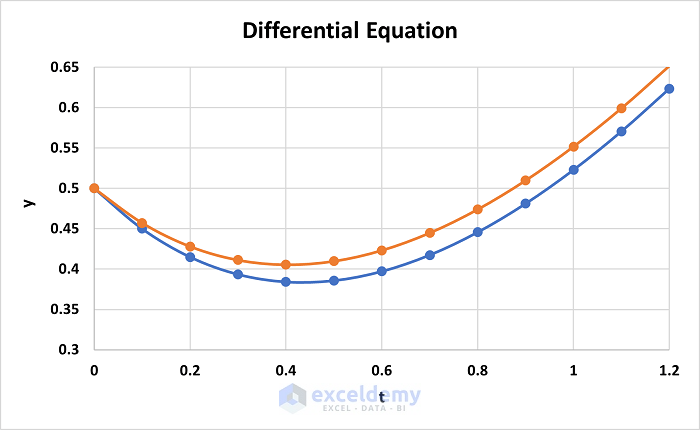
STEP 7 – Plot the Exact Solution on the Same Chart
- To compare the y-values of the exact solution with the numerical values, plot them on the same chart.
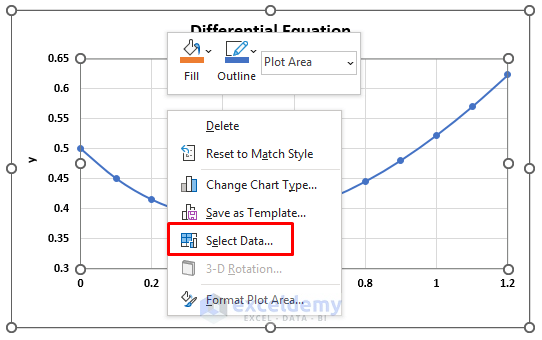
- Right–click on the chart to open the menu.
- Click on the Select Data option.
- In the Select Data Source dialog box, click on Add.
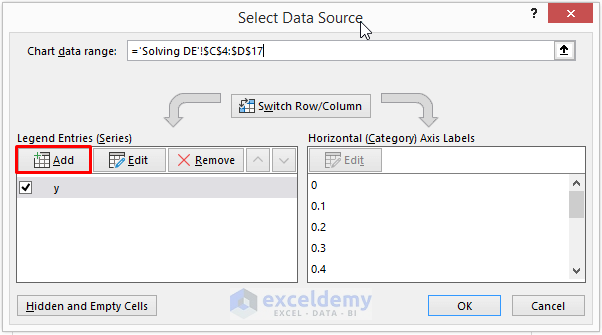
- Insert the Series X and Y values in the Edit Series box.

- Click OK to get the plot of the exact solution.
Read More: How to Solve 2 Equations with 2 Unknowns in Excel
Final Output
- If the delta_t value in Cell G5 is changed, the whole dataset will automatically update and show the solution for the updated delta_t value.
- The graphs will also update automatically.
Read More: How to Solve Polynomial Equation in Excel
Download Practice Book
You can download the practice workbook from here:
Related Articles
- How to Solve for x in Excel
- How to Solve Algebraic Equations with Multiple Variables
- How to Solve System of Equations in Excel
- How to Solve Simultaneous Equations in Excel
- How to Solve Exponential Equation in Excel
- How to Solve Cubic Equation in Excel
- How to Solve Colebrook Equation in Excel
- How to Solve Quadratic Equation in Excel VBA
<< Go Back to Excel Solve Equation | Excel Solver Examples | Solver in Excel | Learn Excel
Get FREE Advanced Excel Exercises with Solutions!
