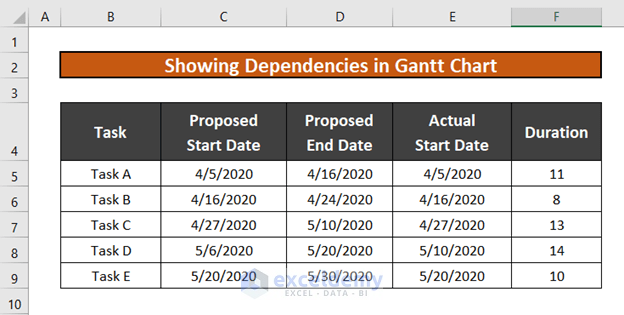
In the below dataset, we have some tasks along with their Proposed Start Date and End Date. Due to the dependencies, the proposed start dates are different from the actual start dates.
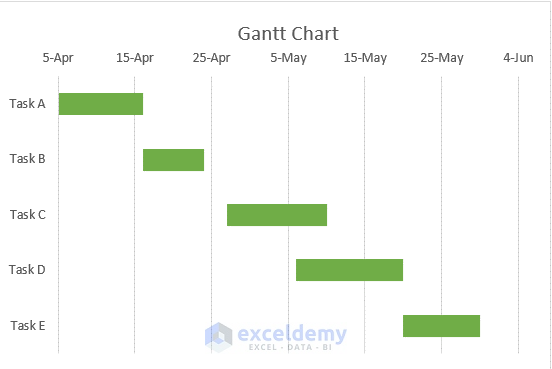
This is a simple Gantt Chart for this project based on the Proposed Start and End Date.
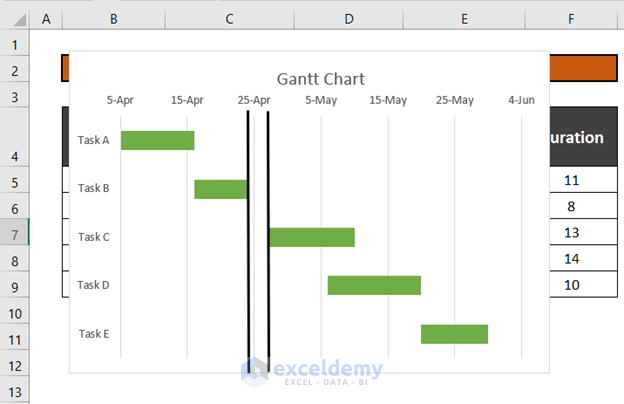
Method 1: Showing Dependencies When Equipment Is Not Ready
In our dataset, even if Task B is complete on the 24th of April, we will have to wait to initiate Task C. The delay is 2 days.
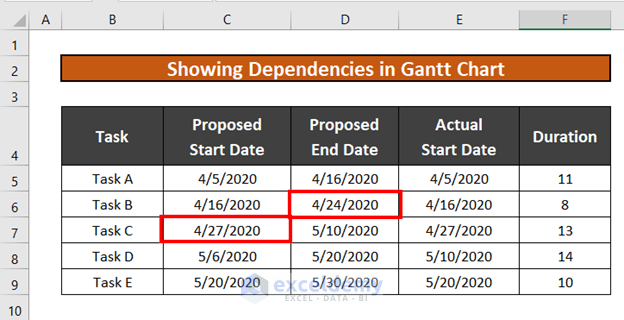
Let’s show it on the Gantt Chart.
Steps:
- Go to the Insert tab >> Illustration >> Shape >> Select Line.
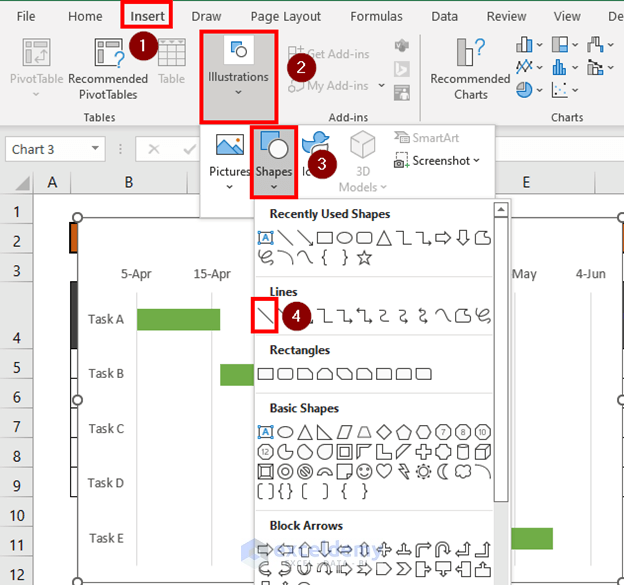
- Draw two tangents that will represent the delay in start.
Read More: How to Add Milestones to Gantt Chart in Excel
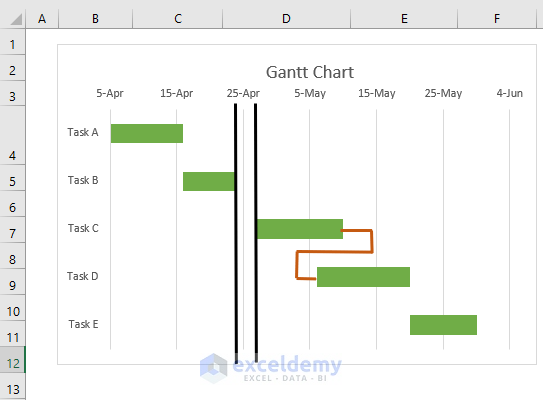
Method 2: Showing Dependencies When Predecessor Is Not Complete
The proposed date to start Task D is the 6th of May. However, Task C will finish on the 10th of May. As Task D will initiate only after the completion of Task C, we cannot start Task D on the 6th of May. We have to delay. The predecessor of Task D is Task C, which will be completed on the 10th of May.

Let’s show this dependency on the Gantt Chart.
Steps:
- Go to the Insert tab >> Illustration >> Shape >> Select Line.

- Show the interdependencies by drawing the lines.
Things to Remember
- You can format the shapes from the Shape Format
Download the Practice Workbook
Download this workbook and practice while going through this article.
Related Articles
- Excel Gantt Chart with Conditional Formatting
- How to Create Excel Gantt Chart with Multiple Start and End Dates
- How to Use Excel Gantt Chart (Create and Customize)
- How to Create Gantt Chart for Multiple Projects in Excel
<< Go Back to Gantt Chart Excel | Excel Charts | Learn Excel
Get FREE Advanced Excel Exercises with Solutions!

So method 2 solely shows that the plan that is made is impossible to execute?
Hello MIGHTY
Thanks for reaching out and posting your comment. You are right about the plan described in Method 2, but partially. Here, we could not maintain the proposal date for Task D. As mentioned in the article, we had to delay. The predecessor of Task D was Task C, which had been completed on the 10th of May. In that sense, we can say the plan made is impossible to follow. But, we must keep in mind that if we cannot start the project at the proposed time, it does not mean we are not completing it at the proposed end date. Maybe the project will end at the proposed date.
In project management, it’s common to have tasks that depend on completing other tasks. It’s a fundamental aspect of project planning to identify and manage task dependencies and ensure the project is executed in a logical and efficient order. When you have such dependencies, you need to adjust the schedule accordingly to ensure that tasks are performed in the correct sequence.
Regards
Lutfor Rahman Shimanto