Gantt Chart Excel

How to Use Excel Gantt Chart (Create and Customize)

If anyone wants to keep track of ongoing or upcoming tasks or projects, then using an Excel Gantt Chart will help them in this regard. Sometimes, ...

Excel Gantt Chart with Conditional Formatting (2 Examples)

Example 1 - Creating Simple Gantt Chart with Conditional Formatting Steps: Enter the dates 1 July-15 July in the range of cells E4:S4. ...

How to Create a Gantt Chart for Multiple Projects in Excel

Step 1 - Prepare Your Dataset In the following image, we can see the basic outlines of the dataset. Project Name: Enter the name of each ...

How to Create Excel Gantt Chart with Multiple Start and End Dates

  What Is a Gantt Chart? The Gantt chart was popularized by Henry Gantt. It is a type of bar chart that illustrates or tracks a project ...

How to Show Dependencies in an Excel Gantt Chart (2 Easy Methods)

In the below dataset, we have some tasks along with their Proposed Start Date and End Date. Due to the dependencies, the proposed start dates are ...

How to Add Milestones to Gantt Chart in Excel (with Quick Steps)

What Is a Gantt Chart? A Gantt Chart is a graph that generally shows the relationship between tasks or milestones and time. It is a very useful tool ...
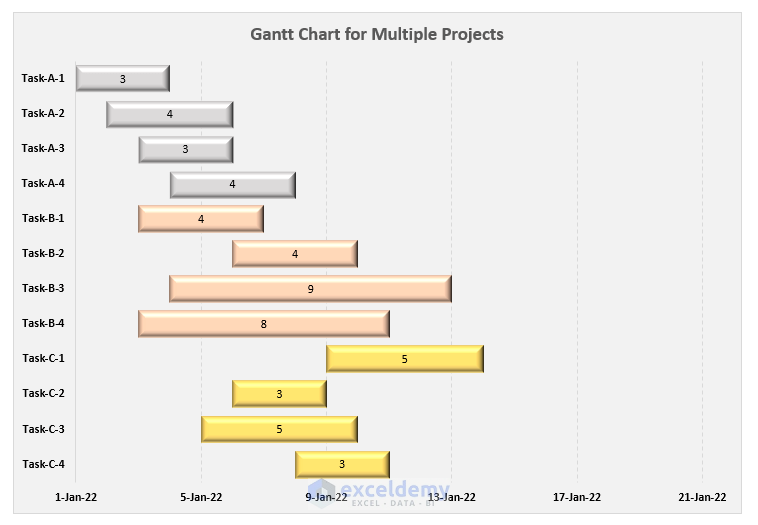
How to Make a Gantt Chart in Excel (with Easy Steps)

Gantt chart is used basically in project management. You cannot create a Gantt chart in Excel in a direct way. But don't worry, you can make an ...

Advanced Excel Exercises with Solutions PDF


ExcelDemy
Logo