
Image by Editor
In this tutorial, we will show how to aggregate and summarize with Table.Group function using the Power Query M language.
What is Table.Group?
Table.Group allows you to group rows in a table based on specific columns and then perform aggregations on others.
Syntax:
Table.Group(table as table, key as any, aggregatedColumns as list,
optional groupKind as nullable number,
optional comparer as nullable function) as table
- table: the input table you want to group.
- key: the column(s) used for grouping.
- aggregatedColumns: list defining new columns created by aggregating data.
- groupKind {Optional]: It is optional and can be GroupKind.Local or GroupKind.Global.
- comparer[Optional]: Optional, used for custom comparison logic.
Common Aggregation Functions
Here are some useful aggregation functions you can use with Table.Group:
- Sum: each List.Sum([ColumnName]).
- Average: each List.Average([ColumnName]).
- Min: each List.Min([ColumnName]).
- Max: each List.Max([ColumnName]).
- Count: each Table.RowCount(_).
- Distinct Count: each List.Count(List.Distinct([ColumnName])).
- First Value: each [ColumnName]{0}.
- Last Value: each List.Last([ColumnName]).
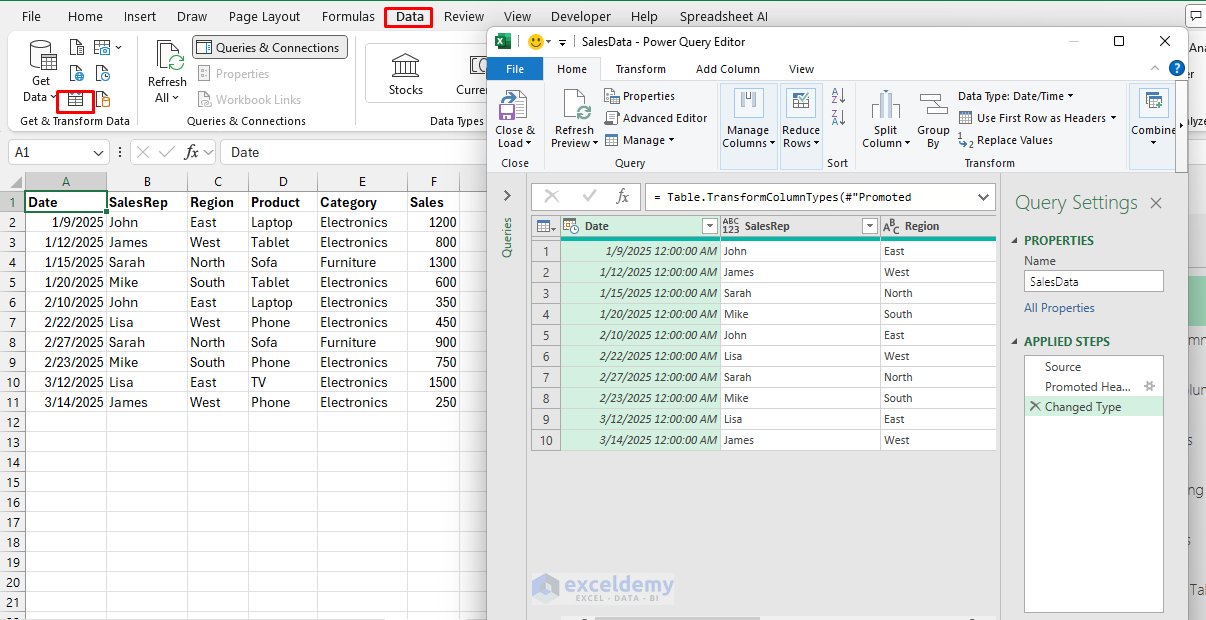
Consider a realistic electronics sales dataset named SalesData. We loaded the data into Power Query.
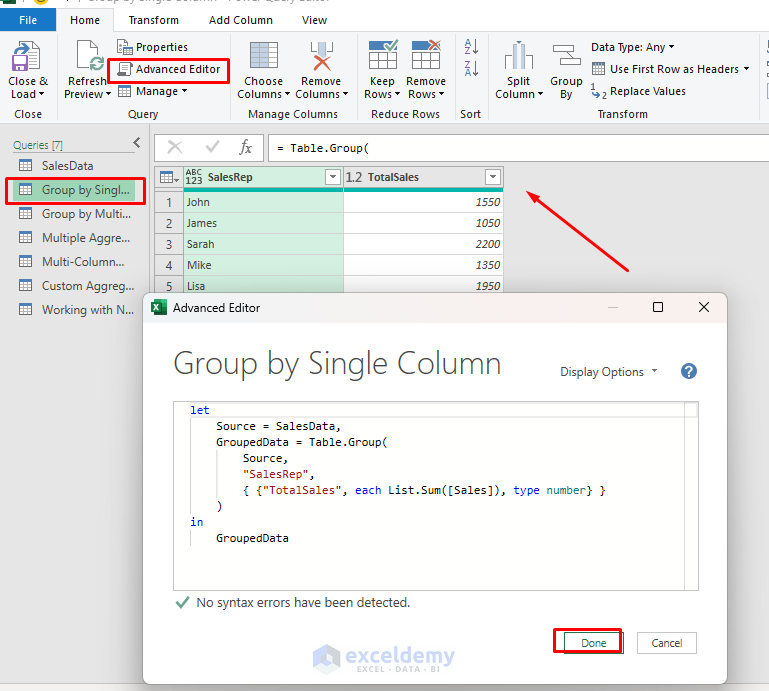
1. Group by Single Column
You can group data by a single column. Let’s group the sales data based on SalesRep’s total sales.
Power Query M Code:
let
    Source = SalesData,
    GroupedData = Table.Group(
        Source,
        "SalesRep",
        { {"TotalSales", each List.Sum([Sales]), type number} }
    )
in
    GroupedData
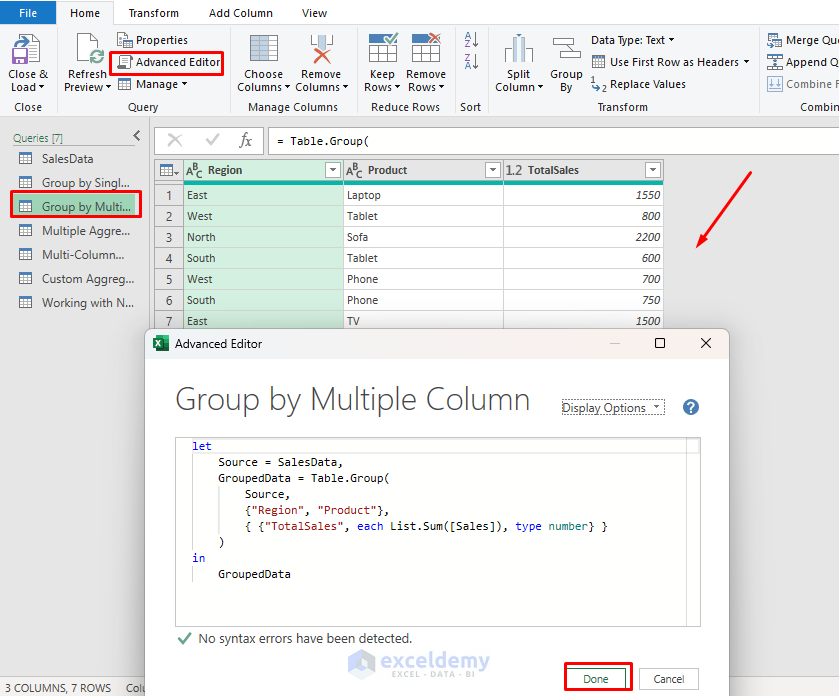
2. Group by Multiple Columns
You can group by multiple columns. Let’s group by both Region and Product.
Power Query M Code:
let
    Source = SalesData,
    GroupedData = Table.Group(
        Source,
        {"Region", "Product"},
        { {"TotalSales", each List.Sum([Sales]), type number} }
    )
in
    GroupedData
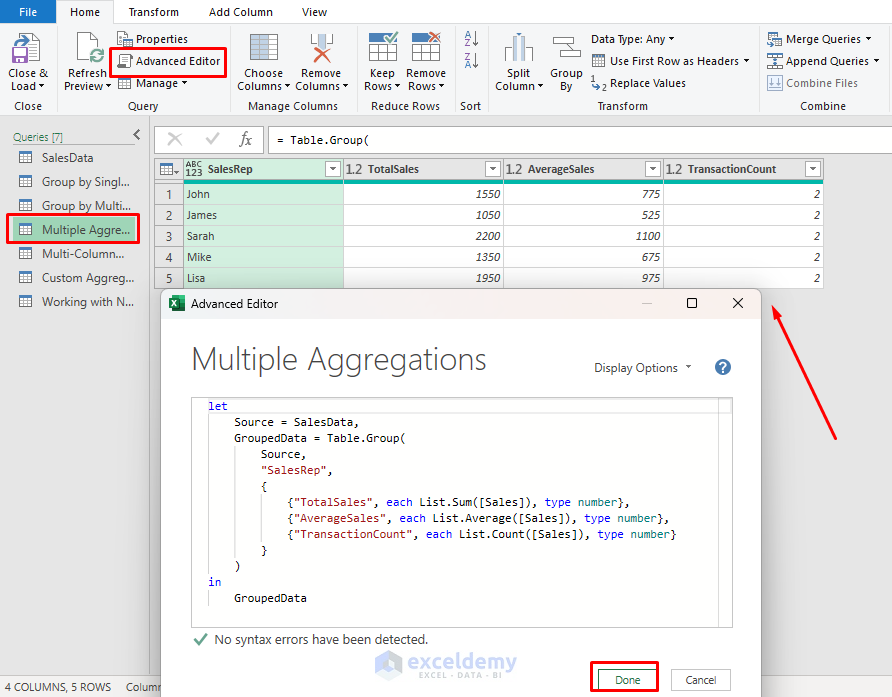
3. Use Multiple Aggregations
You can add multiple aggregations like sum, average and count.
Power Query M Code:
let
    Source = SalesData,
    GroupedData = Table.Group(
        Source,
        "SalesRep",
        {
            {"TotalSales", each List.Sum([Sales]), type number},
            {"AverageSales", each List.Average([Sales]), type number},
            {"TransactionCount", each List.Count([Sales]), type number}
        }
    )
in
    GroupedData
4. Use Multi-Column Grouping with Multiple Aggregations
For a more detailed analysis, group by multiple columns using multiple aggregations.
Power Query M Code:
let
    Source = SalesData,

    // Add Month and Year columns
    AddedMonth = Table.AddColumn(Source, "Month", each Date.Month([Date]), Int64.Type),
    AddedYear = Table.AddColumn(AddedMonth, "Year", each Date.Year([Date]), Int64.Type),

    // Group by Year, Month, and Category
    GroupedData = Table.Group(
        AddedYear,
        {"Year", "Month", "Category"},
        {
            {"TotalSales", each List.Sum([Sales]), type number},
            {"ProductCount", each List.Count(List.Distinct([Product])), type number}
        }
    )

in
    GroupedData
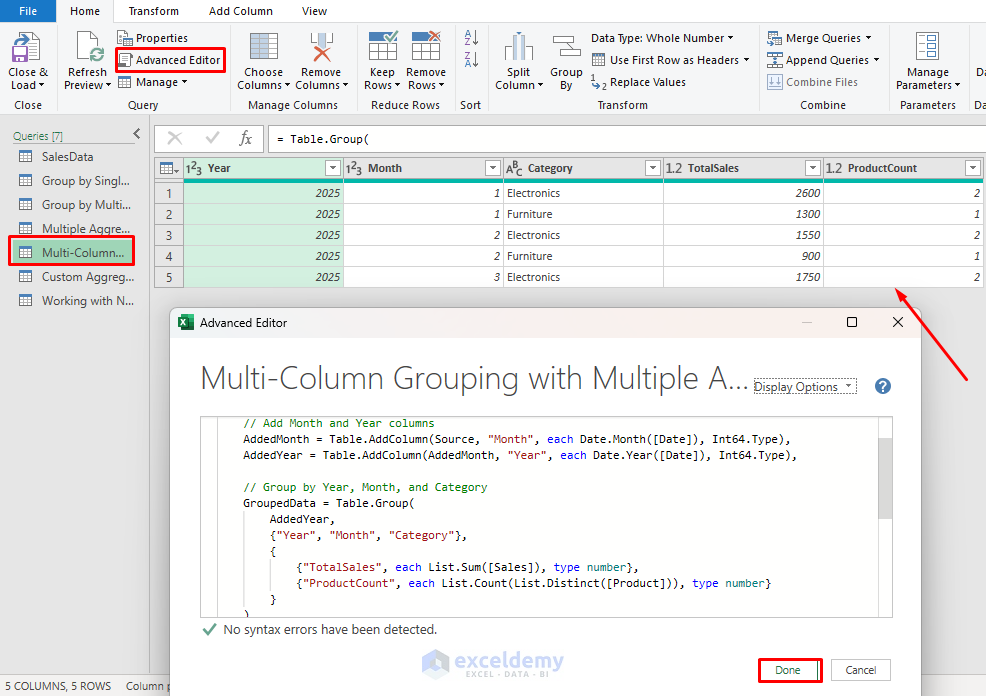
Here, added two new Year and Month columns to group by Category and Total Sales.
Advanced Aggregation & Summarization
Custom Aggregations
You can create custom aggregations for more complex scenarios. List the Top 3 sales in another list.
Power Query M Code:
let
    Source = SalesData,
    CustomAggregation= Table.Group(
    Source,
    {"Region"},
    {
        {"SalesRange", each List.Max([Sales]) - List.Min([Sales]), type number},
        {"ProductList", each Text.Combine(List.Distinct([Product]), ", "), type text},
        {"Top3Sales", each List.FirstN(List.Sort([Sales], Order.Descending), 3), type list}
    }
)
in
    CustomAggregation

Work with Nested Tables
Table.Group can return tables with nested tables.
Power Query M Code:
let
    Source = SalesData,

    // Group by Region and include all rows as a nested table
    GroupedByRegion = Table.Group(
        Source,
        {"Region"},
        {
            {"AllData", each _, type table}
        }
    ),

    // Expand the nested table
    ExpandedTable = Table.ExpandTableColumn(
        GroupedByRegion,
        "AllData",
        {"Product", "Sales"}
    )
in
    ExpandedTable
After grouping with nested tables, expand them for further analysis.
- Click on Table from the AllData column to see the extended table.

Tips for Effective Aggregation
- Clearly define your grouping columns. For large datasets, limit the number of columns you’re grouping by.
- Based on your analysis needs, choose aggregation functions (List.Sum, List.Average, List.Max, List.Min, List.Count).
- Always specify data types for new aggregated columns for optimal performance.
Download Practice Workbook
Conclusion
By using Table.Group function, you can transform raw spreadsheet data into powerful summaries and aggregations. As you become more comfortable with this function, you’ll discover that many complex data transformations become surprisingly straightforward. Practice with different aggregation functions and grouping scenarios to fully harness the power of Table.Group in your data transformation processes.
Get FREE Advanced Excel Exercises with Solutions!

Dear Shamima Sultana, thank you for your interesting tutorials, but it would be very nice to be able to download the excel sheet with the sample data to be able to practice. Thank you.
Hello Falvio,
You are most welcome. Thanks for your feedback and appreciation. Attached the practice file in the Download section. You can download it from there.
Regards
ExcelDemy