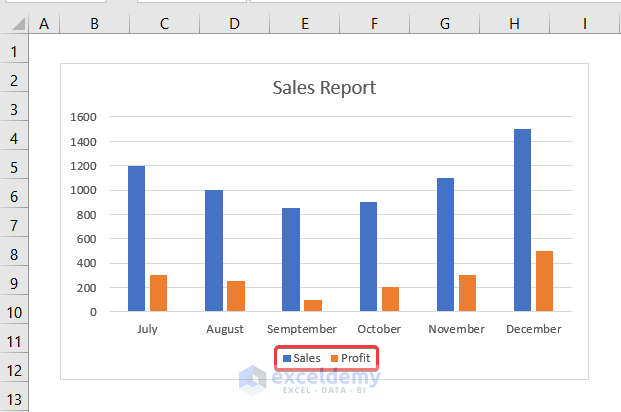
In the below example, the Legend is marked by the red outlined box. The Blue color represents Sales and the Orange color represents Profit.
Method 1 – Adding Legend with Chart
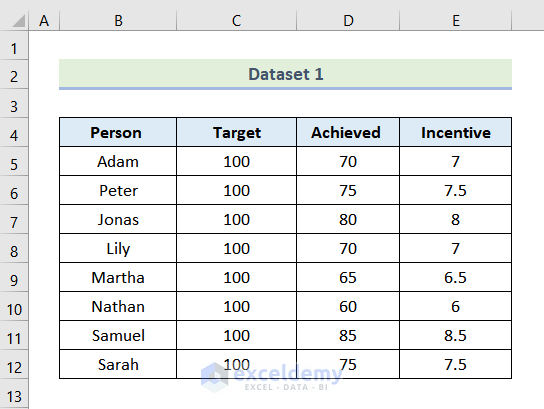
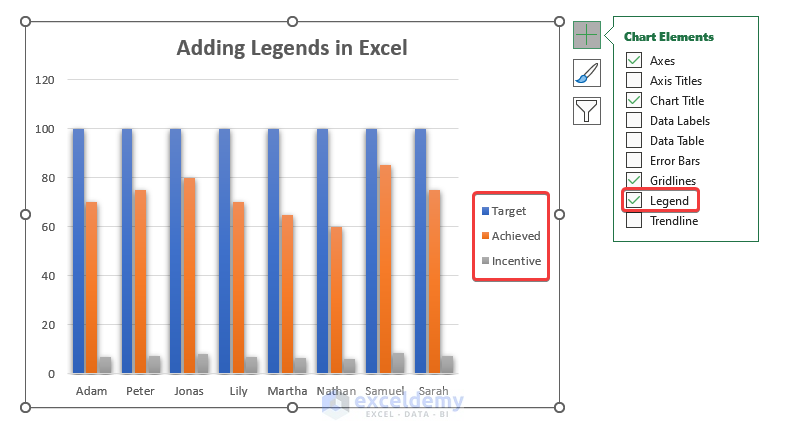
The sample dataset contains the sales Target of a company’s employees along with their Achieved amount and respective Incentives. A legend needs to be added.
Steps:
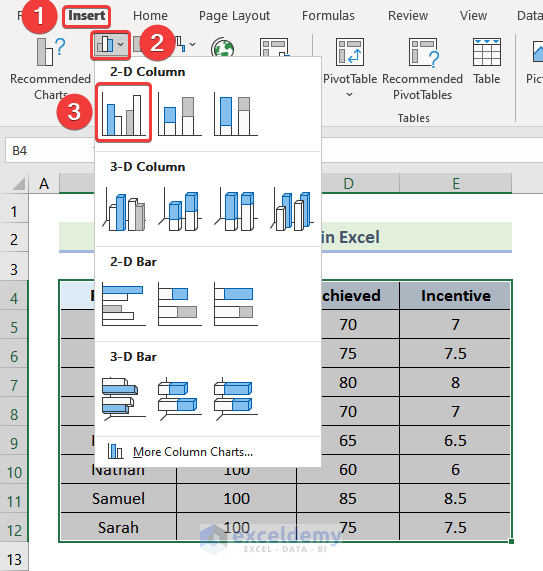
- Select the dataset and then go to the Insert tab from the ribbon.
- Choose Insert Column or Bar Chart.
- From the drop-down menu, select Clustered Column.
- Click on any portion of the chart area.
- Select Chart Elements (the plus symbol).
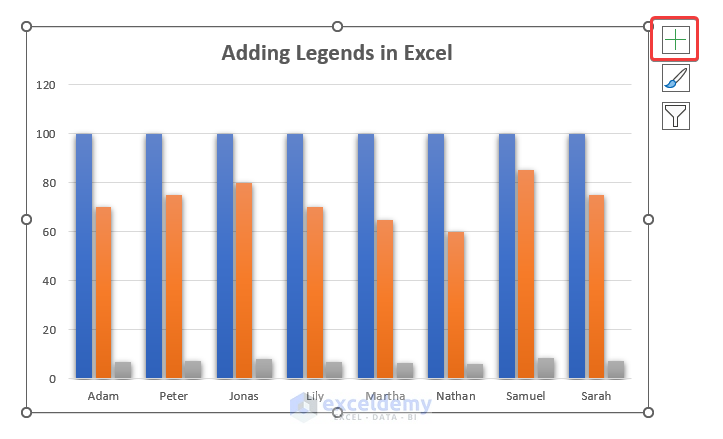
- Check the Legend box from the Chart Element dialogue box.
- A Legend will be added to your chart.
- To reposition the Legend go to Chart Elements.
- Beside the Legend option, a big arrow sign will appear.
- Click the arrow and choose your preferred position for the Legend.
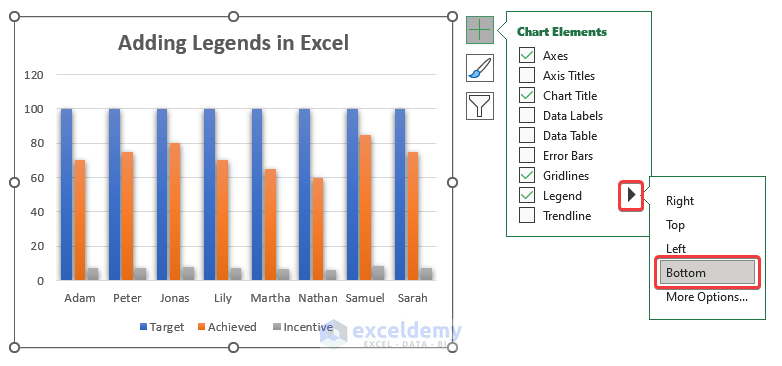
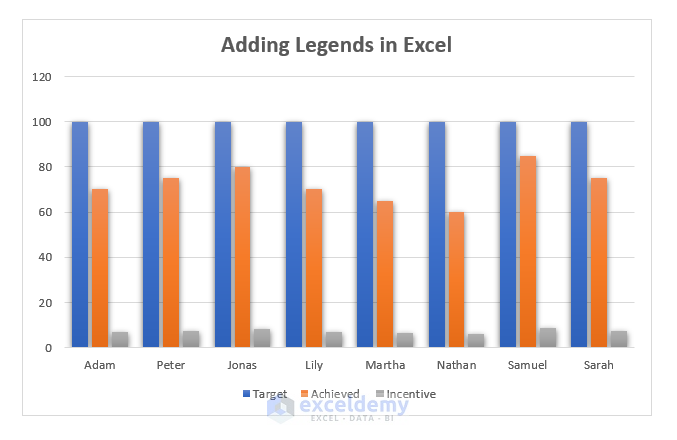
The Legend has been added to the chart.
Read More: How to Show Legend with Only Values in Excel Chart
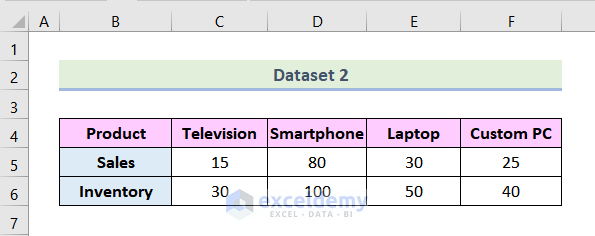
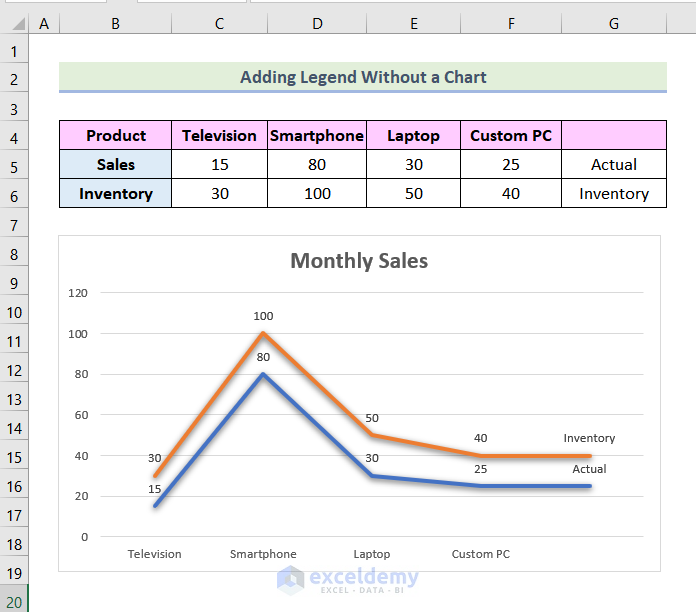
Method 2 – Creating Legend Without an Excel Chart
The sample dataset contains a Sales report and an Inventory report of an electronic store.
After following the 3 easy steps to create a legend without an Excel chart, you’ll be able to get the following output.
Read More: How to Reorder Legend Without Changing Chart in Excel
How to Edit a Legend in Excel
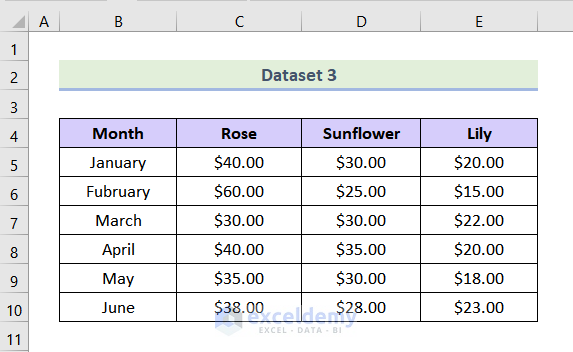
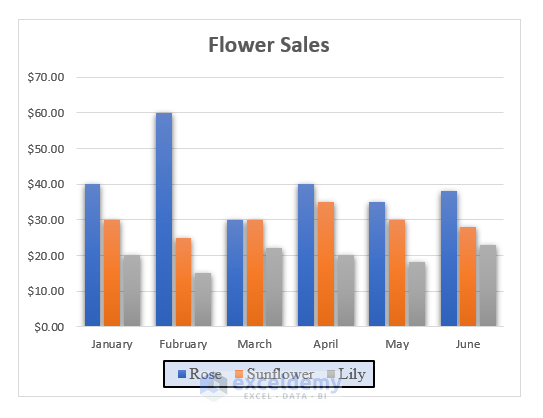
In the following dataset, we have sales reports of various flowers from the month of January to June.
Edit Font and Font Size
- Click on the Legend of the chart.
- Choose your preferred fonts and font size from the Font group under the Home tab.
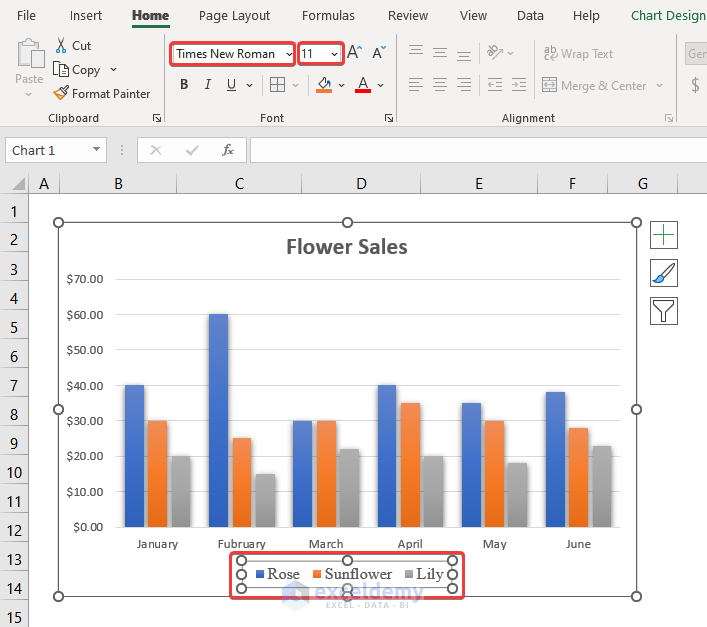
- The font and the font size of the Legend have changed.
Customize Legend Border and Background
- Right-click on the Legend from the chart and select Format Legend.
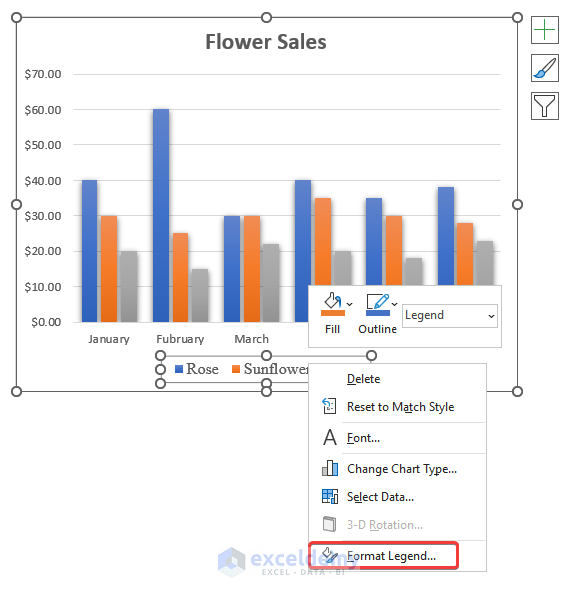
- From the Format Legend dialogue box, choose Solid fill from the Fill option.
- Select your preferred background color.
- Select Solid line from the Border option.
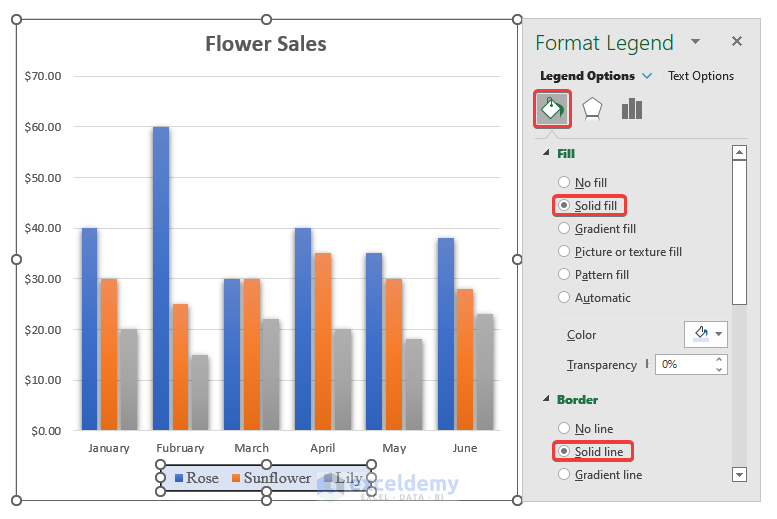
- The Legend has been formatted with your preferred background color and border.
Read More: How to Change Legend Colors in Excel
Things to Remember
- In step 2 of method 1, if you can’t find the Chart Elements option, carefully click on any part of the chart area.
- To edit the font and font size of Legend, make sure you select the Legend first. Otherwise, it will increase the font size of the Excel file.
Download Practice Workbook
Related Articles
- What Is a Chart Legend in Excel?
- How to Rename Legend in Excel
- How to Change Legend Title in Excel
- How to Ignore Blank Series in Legend of Excel Chart
<< Go Back To Excel Chart Elements | Excel Charts | Learn Excel
Get FREE Advanced Excel Exercises with Solutions!
