
Excel’s Maps Chart is a powerful tool for visualizing geographic data. It provides valuable insights into decision-making in today’s data-driven world. It allows users to create interactive and visually appealing geographic maps. In this article, we will show how to visualize geographic data using Excel Maps.
A Map Chart can visually represent data that is linked to countries, states, regions, or postal codes. By using it you can visualize sales or revenue by region, display population density, unemployment rates, election results, etc.
Excel Maps available in 2016 and later versions for Office 365. In Excel 2013, 3D maps are available as an add-in called Power Maps.
Step 1: Inserting Map Chart
Let’s consider sales data to visualize the sales across global markets.
To create a Map Chart, ensure your data includes the names of geographical areas (countries, states, or regions).
- Select the Country and Sales columns.
- Go to the Insert tab >> from Maps >> select Filled Map.
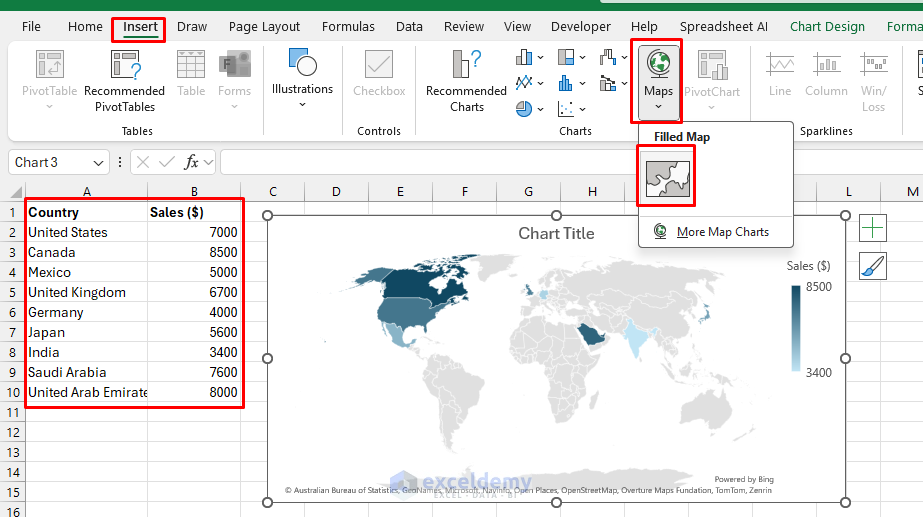
Excel automatically plots the sales value in the selected countries, highlighting the countries’ maps.
As Maps Chart maps the location ensure location names are spelled correctly to avoid mapping issues.
Step 2: Customize the Map Chart
Once the chart is created now you can customize the Map based on your requirements.
- Chart Title: Insert a descriptive chart title like “Sales by Country”.
- Data Labels: Click on Chart Elements (+) >> select Data Labels to show the sales values in the Map.
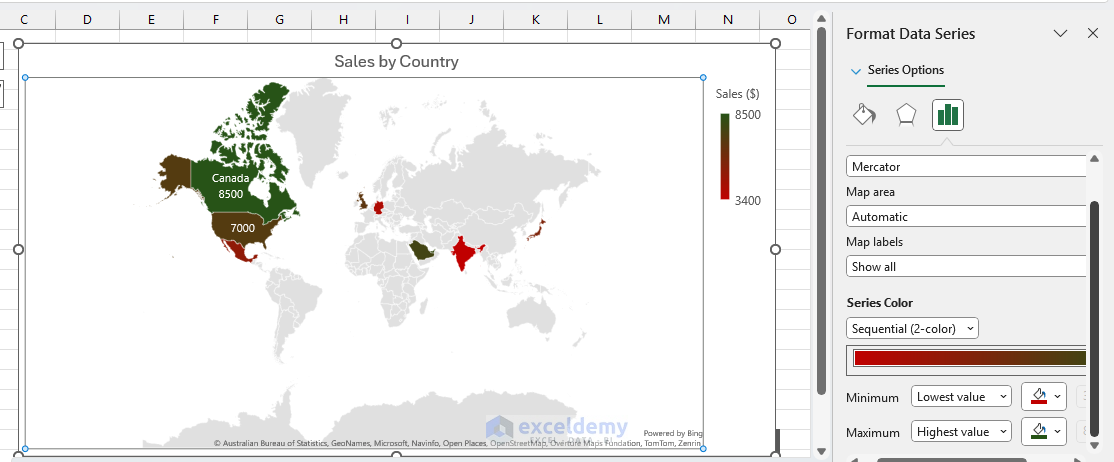
- Format Data Series: Right-click on the map and select Format Data Series. To change the map projection style, which alters how the map is displayed.
- From Series Options >> select Mercator projection.
- From Series Color >> select Red for the Lowest value and Green for the Highest value.
- Legend: Add or edit the legend to clarify what each color represents.
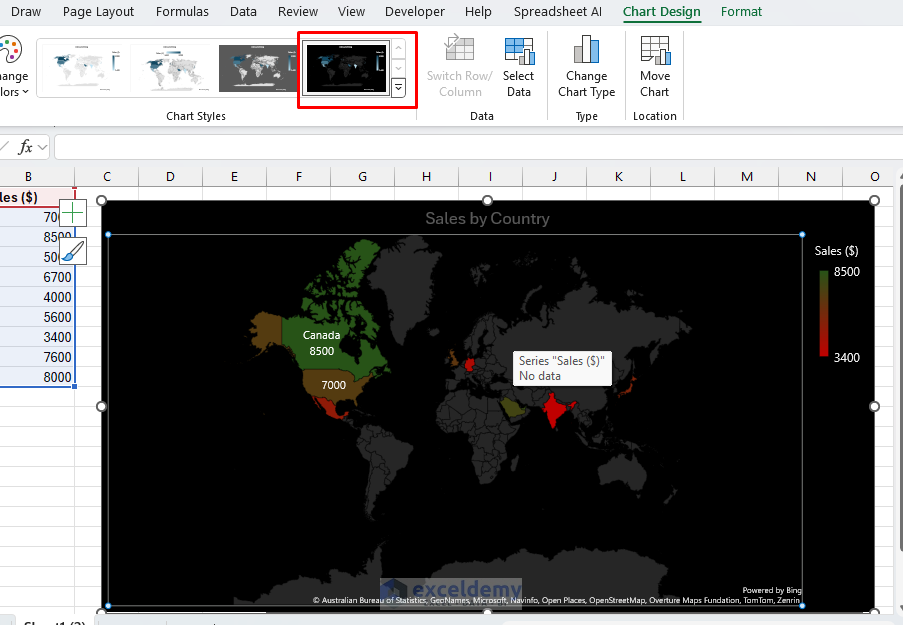
Or,
- Select the Map Chart.
- Go to the Chart Design tab >> select any suitable template from the Chart Styles.
Using Excel Maps with Geographic Data Types
Excel 365 offers geographic data types that import real-time geographic data from the field list.
Insert the Geographic Data:
- List the country name in an Excel column.
- Select cell A2:A10.
- Go to the Data tab >> from Data Types >> select Geography.

- Select cell A2:A10 >> click on Insert Data icon >> select any field of your need.
- We selected the Population field.

All population data are inserted in the adjacent column.
Insert Excel Maps:
Once you insert the population data you can create an Excel Map to visualize population by country.
- Now select the Country and Population column.
- Go to the Insert tab >> from Maps >> select Filled Map.
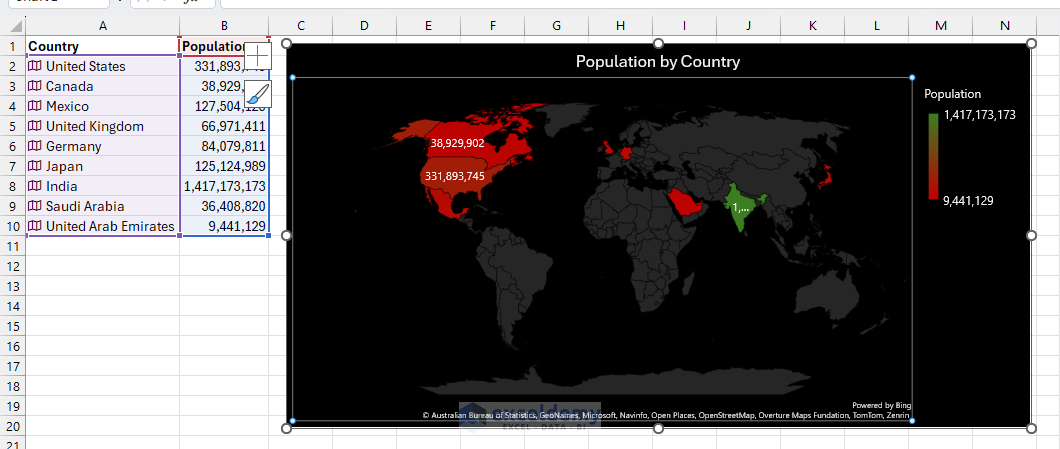
Excel automatically creates Excel Maps visualizing the population across countries.
Download Practice Workbook
Conclusion
Excel Map Chart is easy to use, you just need to insert accurate data in Excel. Excel Maps easily visualize geographic data and uncover valuable insights. You can follow this step-by-step guide to create dynamic, interactive geographic maps in Excel. Explore all available options to customize your chart as per your needs.
Photo by Suzy Hazelwood
Get FREE Advanced Excel Exercises with Solutions!

This would be much more useful if a practice workbook with sample data were provided.
Hello Daryl Fagala,
Thank you for the feedback! A practice workbook with sample data would make it easier to follow along. Attached the downloadable file to enhance the learning experience. Appreciate your suggestion!
Regards
ExcelDemy
Dear Shamima Sultana,
Greetings!
Wonderful tutorial for beginners. Can you suggest to me what type of practices will make me a better data visual designer?
Thank you,
Manohar
Hello Manohar,
Thank you so much for your kind words! I’m glad you found the tutorial helpful. To become a better data visual designer, I recommend practicing regularly with different types of datasets and exploring various chart types in Excel, such as maps, scatter plots, and pivot charts.
Try to tell a clear story with your visuals and always keep your audience in mind. Reviewing examples of effective dashboards and visualizations online can also be very inspiring. Lastly, don’t hesitate to experiment with colors, layouts, and design elements to find your own style.
Explore our Excel Charts category to learn more about visualizations.
Best wishes on your learning journey!
Regards
ExcelDemy
Hi Shamima Sultana,
Greetings!
Thank you;
Sincerely,
Manohar
Hello Manohar,
Hope you are doing well.
You are most welcome. Keep exploring Excel with ExcelDemy!
Regards
ExcelDemy