
Hybrid reports combine the strengths of Microsoft Excel and Power BI to create efficient, scalable, and user-friendly data analysis solutions. Excel is ideal for quick data manipulation and familiar workflows, while Power BI excels at advanced visualizations, data modeling, and team collaboration.
In this tutorial, we discuss when to start in Excel vs. when to start in Power BI by building a hybrid report. To make the tutorial practical, we’ll use a small, fictional sales dataset.
Understanding Hybrid Reports
A hybrid report is a business report that combines Excel and Power BI in the same workflow. It can leverage Excel for data preparation and ad-hoc analysis and Power BI for interactive dashboards and scalable sharing.
- Importing Excel data into Power BI for enhanced visualizations
- Connecting Excel to Power BI datasets for live querying
- Publishing Excel reports to the Power BI service for online access
This approach is perfect for teams transitioning from spreadsheets to BI tools, balancing familiarity with advanced capabilities. Together, they give you both analyst flexibility and executive-ready dashboards.
Step 1: Start in Excel (Exploration & Validation)
Excel is ideal for quickly exploring data. It is beginner-friendly and easy to use. It has been the go-to analysis tool for decades.
Import and Clean Data:
- Go to the Data tab >> select Get Data >> select data sources
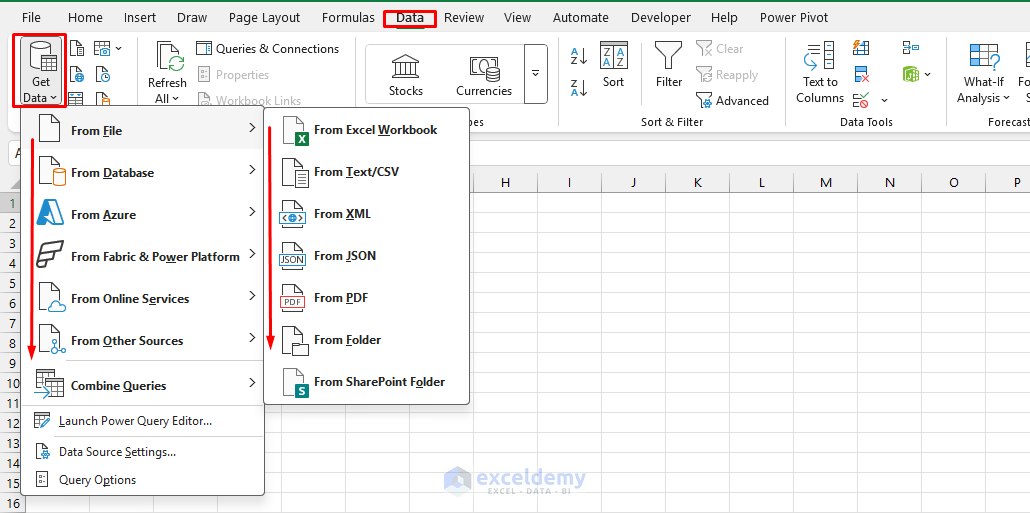
- Clean the data using the Power Query tool
- Add a calculated column for Sales Amount:
- Go to the Add Column tab >> select Custom Column
[Quantity] * [Unit Price] - [Discount]
- Load data into Excel

Perform Analysis:
- Select your table
- Go to the Insert tab >> select PivotTable
- Select New Worksheet as location >> click OK

- From the PivotTable Field List:
- Drag Region to Rows
- Drag Product Name to Columns
- Drag Sales Amount to Values
- You’ll instantly see Sales by Region and Product

Add a Chart:
- Select the PivotTable
- Go to the PivotTable Analyze tab >> select PivotChart >> select Clustered Column
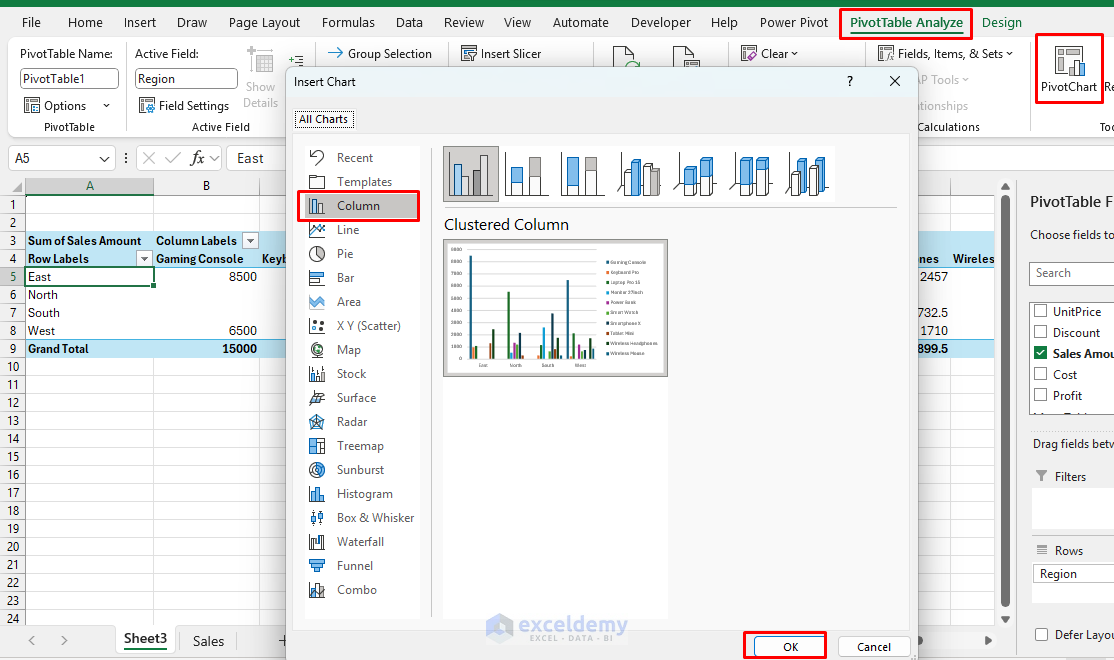
- This shows sales by region and product

Analysts can also add formulas (e.g., profit margins or discount scenarios) that are not yet part of the official dataset.
Prepare for Power BI:
- Save the Excel file to OneDrive or SharePoint for seamless integration
- Ensure the table is clean and structured (no merged cells, consistent headers)
Step 2: Move to Power BI (Scalable Interactive Dashboard)
Power BI is best for handling large-scale, interactive, and collaborative reporting. Once the data is validated in Excel, move to Power BI for a polished report.
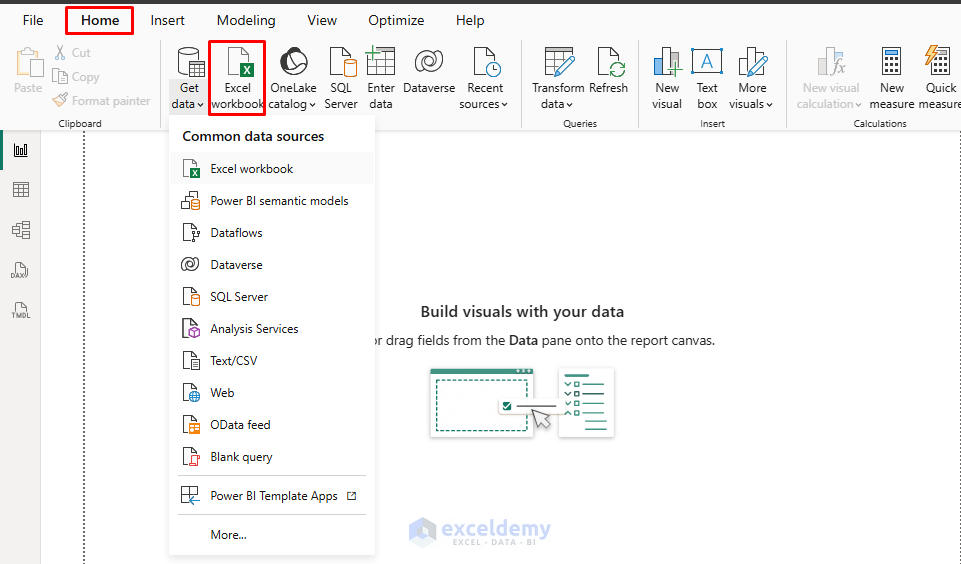
Import Excel Data:
- Open Power BI Desktop (download from Microsoft if needed)
- Go to Home >> select Get Data >> select Excel Workbook
- Browse and select the Excel file
- Load data into Power BI
Build the Data Model:
- If your data has multiple sheets or tables, create relationships
- In Model view, confirm the table structure
- Power BI can automatically detect relationships if the data is properly formatted and structured
Create DAX Measures:
- Go to the Table view >> select New measure
- Create DAX measures to use in KPI cards
Total Sales = SUM(SalesData[Sales Amount])
Average Order Value = AVERAGE(SalesData[Sales Amount])
Profit Margin % = DIVIDE(SUM(SalesData[Profit]), SUM(SalesData[Sales Amount]), 0)

Create Interactive Visuals:
- On the report canvas, build the interactive visuals
- Card visuals:
- Total Sales
- Total Profit
- Profit Margin %
- Avg Order Value
- Clustered Column Chart:
- Drag Region to the X-axis
- Drag Sales Amount to the Y-axis
- Line Chart:
- Drag Date to the X-axis
- Drag Sales Amount to the Y-axis
- Pie Chart:
- Drag Region to the Legend
- Drag Sales Amount to the Values
- Slicer:
- Drag Region to Field to filter the dashboard interactively
- Matrix:
- Drag Salesperson to Rows
- Drag Category to Columns
- Drag Sales Amount to Values

Now, executives can interact with the report. All Power BI visuals are interactive, not only the slicer.
Save & Publish to Power BI Service:
- Go to File >> click Save
- Go to the Home tab >> select Publish
- Choose My Workspace >> click Select
- Click OK

Set Up Data Refresh:
- In Power BI Service, configure a refresh schedule for the OneDrive-hosted SalesData.xlsx (e.g., daily)
- If using on-premises data, set up a data gateway
Step 3: Connect Excel Back to Power BI
A key benefit of hybrid reports is that Excel can connect to the same Power BI dataset.
- Open Excel
- Go to the Insert tab >> select PivotTable >> select From Power BI Dataset
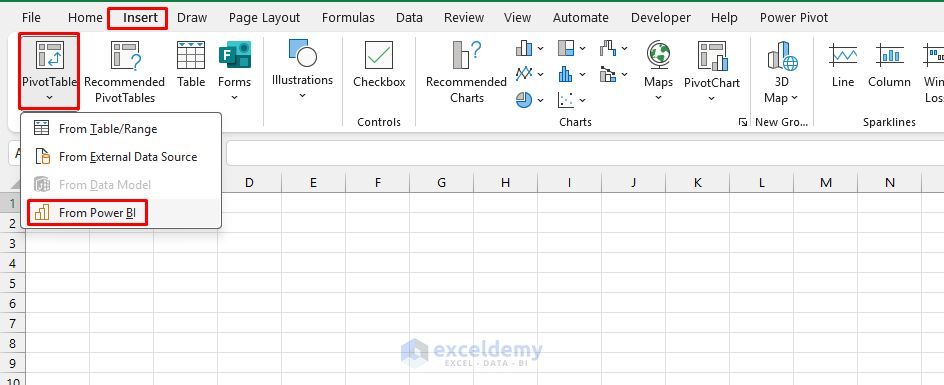
- Choose the dataset you published
- Click Insert PivotTable

- Build additional PivotTables, e.g.:
- Sales by Category:
- Shows Total Sales, Profit, and Profit Margin %
- Sales by Category:

- You can perform a what-if scenario with custom formulas
Now everyone works on the same dataset, ensuring consistency.
Tip: You must be signed into the same account for Excel and Power BI to use hybrid reports.
When to Start in Excel vs. Power BI
| Start in Excel When | Start in Power BI When |
|---|---|
| You need a quick ad-hoc analysis—quick formulas, PivotTables, or what-if scenarios | You want rich interactivity—slicers, drill-through, and filters for real-time exploration |
| Your dataset is relatively small (under a few hundred thousand rows) | Millions of rows are involved—Power BI’s data model handles this more efficiently than Excel |
| You’re doing manual tweaks or financial modeling (e.g., cash-flow projections or cost analysis) that require cell-level transparency | You need to pull from multiple sources (SQL databases, APIs, cloud storage) and combine them cleanly |
| Most business users know Excel well, making it ideal for collaboration | Reports should be published to Power BI Service, shared securely, and refreshed automatically |
Best Practices for Hybrid Reporting
- Do not duplicate cleaning steps—clean the data once (in Excel or Power BI)
- Use Power BI for the single source of truth dataset
- Empower Excel users to connect to Power BI datasets instead of exporting static files
- Use OneDrive/SharePoint to store Excel files so they stay in sync with Power BI
Conclusion
A hybrid report is not about Excel vs. Power BI, but rather about combining them effectively. By following the steps above, you can build hybrid reports and decide when to start in Excel and when to start in Power BI. Start in Excel for fast exploration, validation, and modeling. Start in Power BI for automation, scale, and collaboration. Connect them to build reports that are both flexible for analysts and insightful for executives.
This way, you get the best of both worlds — Excel’s agility and Power BI’s power.
Get FREE Advanced Excel Exercises with Solutions!
