Cubic Spline Interpolation is a curve-fitting method to interpolate a smooth curve between discrete data points. We use this interpolation in various applications due to its ability to model smooth and continuous curves that pass through all the data points while being computationally efficient and easy to implement.
Step 1 – Set up Data Model for Cubic Spline Interpolation
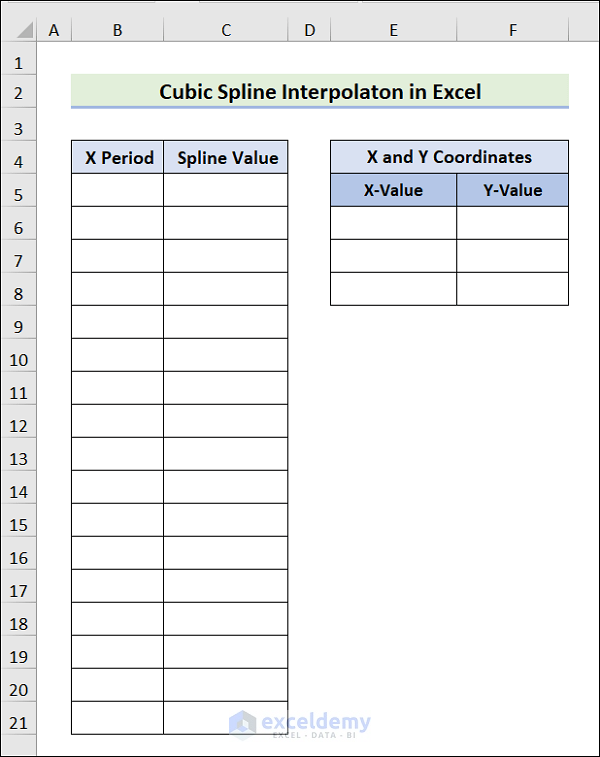
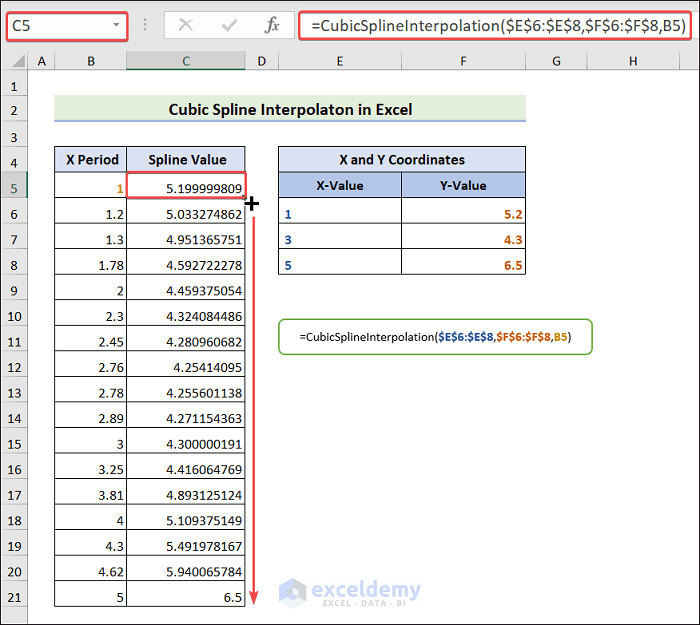
First, you need to create a dataset for illustration purposes. In this article, we will consider the dataset having two columns titled X Period, Spline Value. We also have two sub-columns named X-Value and Y-Value. These belong to X and Y Coordinates.
- Build X Period and Spline Value columns throughout B and C.
- Take another section called X and Y Coordinates in the E and F columns.
- Here, column E represents X-Value, and column F contains Y-Value.
Step 2 – Input Required Data into Cubic Spline Model
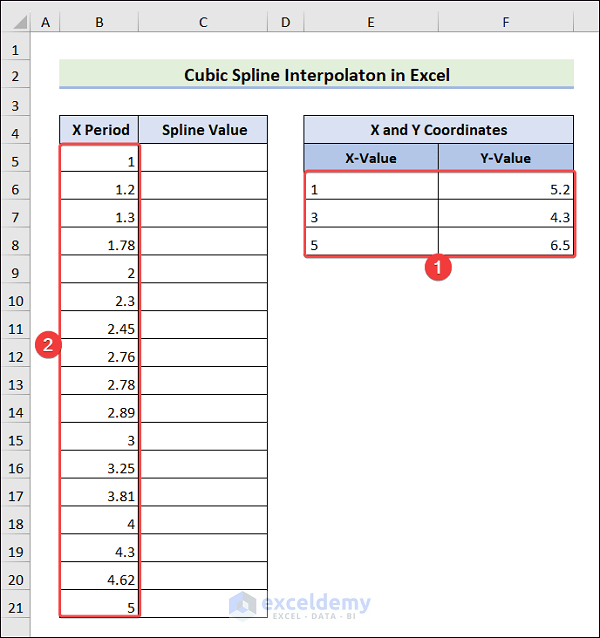
- Insert the intended values in the X-Value and Y-Value columns.
- Input the desired values for the X Period column like the following.
Step 4 – Utilize Excel VBA Code to Build a User-Defined Function
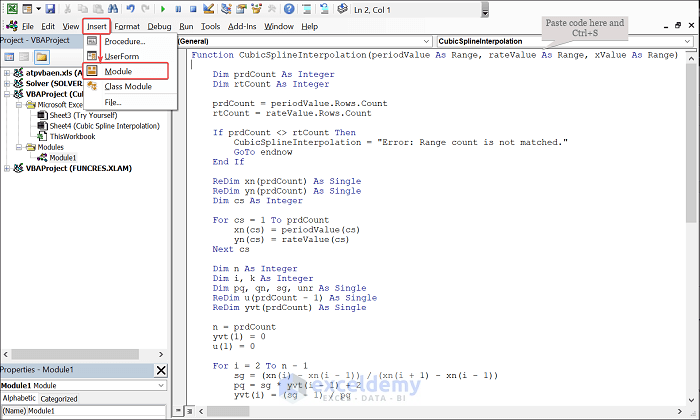
- Press ALT + F11 to open VBA Editor.
- Choose Insert followed by Module and paste the below code.
Function CubicSplineInterpolation(periodValue As Range, rateValue As Range, xValue As Range)

Dim prdCount As Integer
Dim rtCount As Integer

prdCount = periodValue.Rows.Count
rtCount = rateValue.Rows.Count

If prdCount <> rtCount Then
CubicSplineInterpolation = "Error: Range count is not matched."
GoTo endnow
End If

ReDim xn(prdCount) As Single
ReDim yn(prdCount) As Single
Dim cs As Integer

For cs = 1 To prdCount
xn(cs) = periodValue(cs)
yn(cs) = rateValue(cs)
Next cs

Dim n As Integer
Dim i, k As Integer
Dim pq, qn, sg, unr As Single
ReDim u(prdCount - 1) As Single
ReDim yvt(prdCount) As Single

n = prdCount
yvt(1) = 0
u(1) = 0

For i = 2 To n - 1
sg = (xn(i) - xn(i - 1)) / (xn(i + 1) - xn(i - 1))
pq = sg * yvt(i - 1) + 2
yvt(i) = (sg - 1) / pq
u(i) = (yn(i + 1) - yn(i)) / (xn(i + 1) - xn(i)) - (yn(i) - yn(i - 1)) / (xn(i) - xn(i - 1))
u(i) = (6 * u(i) / (xn(i + 1) - xn(i - 1)) - sg * u(i - 1)) / pq

Next i

qn = 0
unr = 0
yvt(n) = (unr - qn * u(n - 1)) / (qn * yvt(n - 1) + 1)

For k = n - 1 To 1 Step -1
yvt(k) = yvt(k) * yvt(k + 1) + u(k)
Next k

Dim kl, kh As Integer
Dim hn, bcs, asp As Single

kl = 1
kh = n

Do
k = kh - kl
If xn(k) > xValue Then
kh = k
Else
kl = k
End If
k = kh - kl
Loop While k > 1
hn = xn(kh) - xn(kl)
asp = (xn(kh) - xValue) / hn
bcs = (xValue - xn(kl)) / hn
yFinal = asp * yn(kl) + bcs * yn(kh) + ((asp ^ 3 - asp) * yvt(kl) + (bcs ^ 3 - bcs) * yvt(kh)) * (hn ^ 2) / 6

CubicSplineInterpolation = yFinal

endnow:
End Function- Press Ctrl + S or click the Save icon.
Step 4 – Determine Interpolate Y Value Using User-Defined Function in Excel
- Select the C5 cell and apply the equation below in the Formula bar.
=CubicSplineInterpolation($E$6:$E$8,$F$6:$F$8,B5)
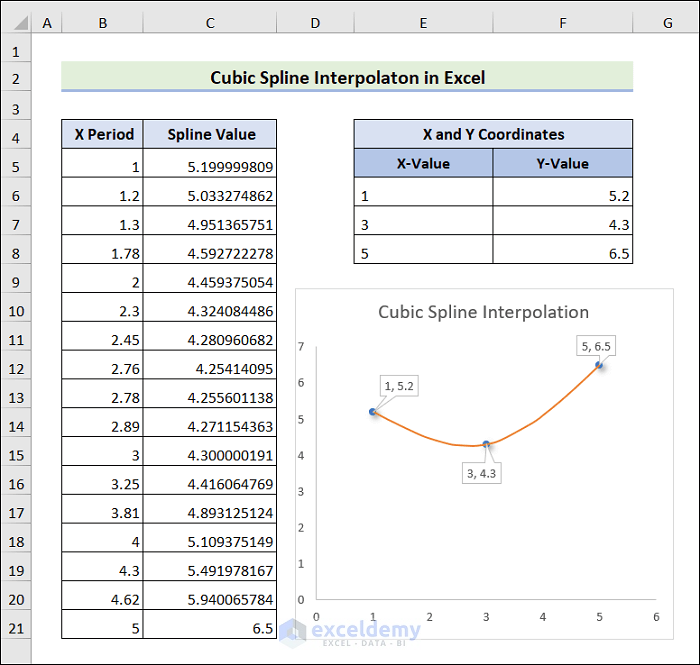
- Hit the Enter key and drag the Fill Handle icon to C21.
- You should get the desired output like the below one.
Step 5 – Display Chart Data for Cubic Spline Interpolation in Excel
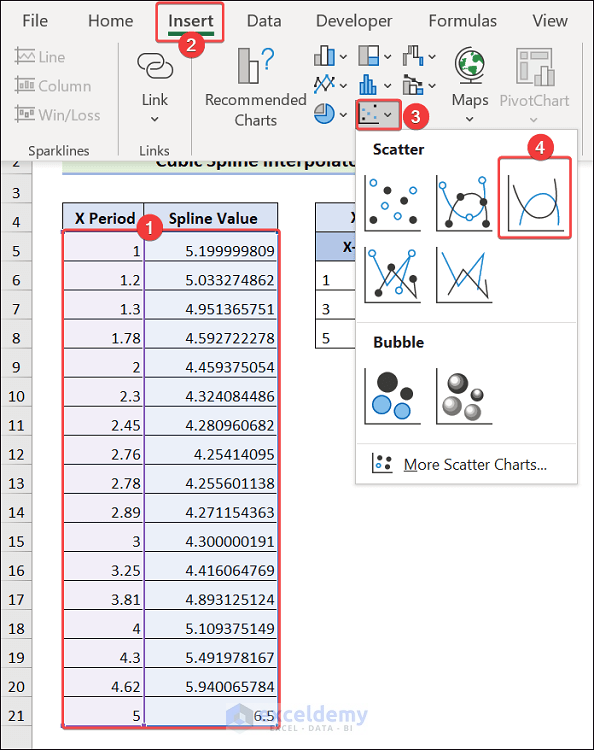
- Select range B5:C21 and go to the Insert tab.
- Click on the Scatter Chart followed by Scatter with Smooth Lines.
- Excel should display the Cubic Spline Interpolation like the following.
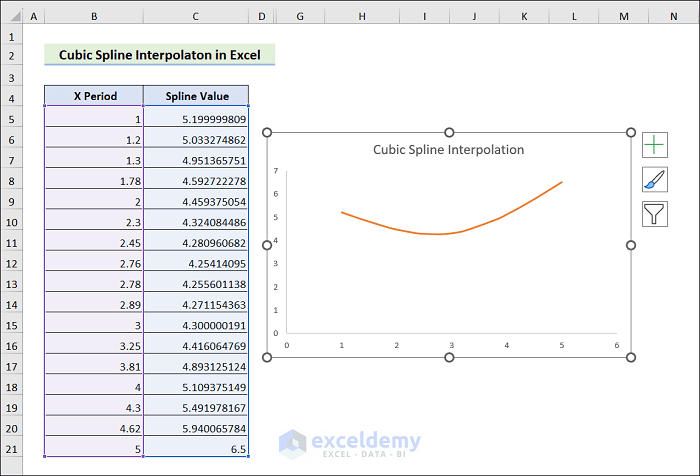
- Insert the X and Y Coordinates into the previous chart to verify the interpolation.
Read More: How to Do 2D Interpolation in Excel
Things to Remember
- The User-Defined function can malfunction if the X Period columns contain a value that crosses the upper and lower boundaries of the X-Value.
- While saving the workbook, ensure to keep it as the macro-enabled workbook.
Download Practice Workbook
Please click the link below this section if you’d like a free copy of the sample workbook discussed in the presentation.
Related Articles
- 3D Interpolation in Excel
- How to Calculate Logarithmic Interpolation in Excel
- How to Interpolate Time Series in Excel
- How to Perform Exponential Interpolation in Excel
- How to Do Polynomial Interpolation in Excel


interest in robotic math in excell
Dear Jay Dee,
That’s good to hear. We are interested to know more from you.
Regards
ExcelDemy
This interpolation is not correct! The orange Line has to hit the given dots of the blue line as aminimum requirement! Otherwise its not an interpolation at all!
Please check the formulas! Seems to be a mistake somewhere.
Hello Torsten,
Thank you for bringing this matter to our attention. We will look into the VBA function to see if it can be updated to minimize the deviation of the orange line from the given points.
Besides, I would like to address your concern regarding interpolation methods. There are some interpolation methods that go through all the given points such as Lagrange interpolation or polynomial interpolation etc. However, interpolation method such as cubic spline interpolation does not necessarily pass through all the given data points.
How would you add a smoothing option, either directly into the VB code or via function, with the option to define “p”. For example
https://www.mathworks.com/help/curvefit/smoothing-splines.html
Hello DUSTIN
Thanks for reaching out and posting your query. You want to add a smoothing option while interpolating. You can achieve the goal with Excel formulas. However, I am presenting an Excel VBA User-defined function where you can add a smoothing option.
Assume you have two user-defined functions for applying the Cubic Spline and Cubic Hermite Spline interpolations. You want to create another user-defined function that will have the same parameters as before, including another extra parameter for choosing the smoothing option. Let’s say if p is provided, it will apply the Cubic Spline interpolation. And if q is provided, it will apply the Hermite Spline interpolation. If the Choose Parameter is not provided, it will raise a warning.
Excel VBA Code:
OUTPUT:
1. Cubic Spline
Here, we are providing p as the Choose Parameter.
2. Hermite Spline
We are providing q as the Choose Parameter.
3. Error Handling
Now, we are not providing any of the Choose Parameters. As a result, a Warning Window appears.
Press OK => You will get an output like the following image.
Hopefully, the idea will help you. Good luck!
Regards
Lutfor Rahman Shimanto