100% Stacked Column charts are a great way to compare proportions within categories. When using this chart type, it is important to consider the order of the data, as the 100% Stacked Column chart will stack the columns in the order that the data is provided. This can be helpful when trying to compare data across different categories, as the 100% Stacked Column chart will provide a clear visual of the relationships between the data. In this article, I will show you how to make a 100 percent (100%) Stacked Column chart in Excel with easy steps.
What Is a 100% Stacked Column Chart?
If you want to compare parts of a whole, then a 100% Stacked Column chart is the way to go. This type of chart shows how each category contributes to the total and what its percentage is of the total.
For example, let’s say you wanted to compare the revenue of four different product lines for your company. A 100% Stacked Column chart would let you see not only the revenue for each product line but also what percentage of the total revenue each product line brings in.
Steps to Make a 100% Stacked Column Chart in Excel
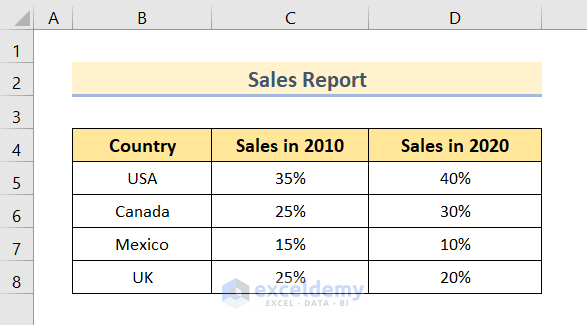
I will use the following Sales Report to show you how to make a 100% Stacked Column chart in Excel. The dataset contains the sales data in percentage for 4 countries. The dataset explains the change in sales over a period of 10 years.
Step-1: Insert a 100% Stacked Column Chart
After preparing the dataset, it’s time to insert a 100% Stacked Column chart.
To insert,
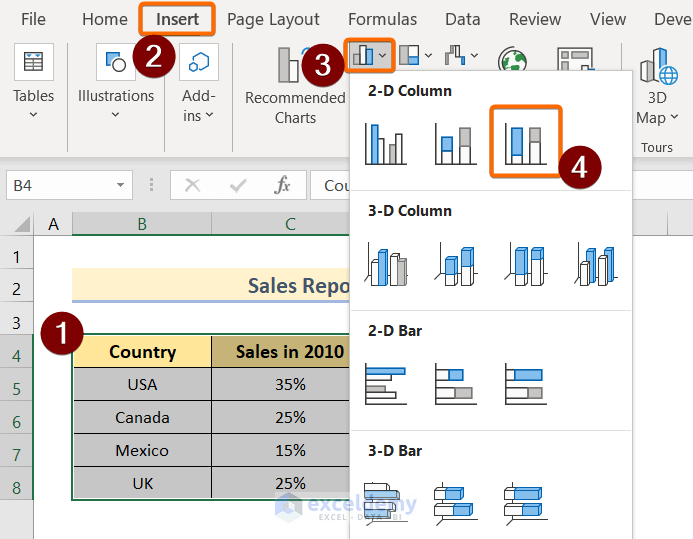
❶ Select the entire dataset.
❷ Go to Insert ➤ Charts.
❸ Click on the Insert Column or Bar Chart drop-down.
❹ Then select the 100% Stacked Column in the 2-D Column section.
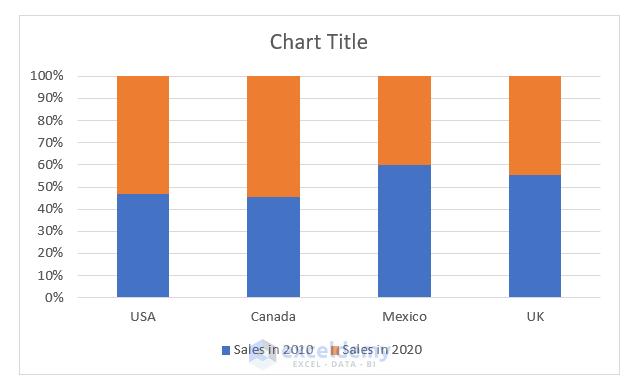
Then Excel will generate a column chart based on your data selection.
In this case, the stacked columns have been generated based on counties.
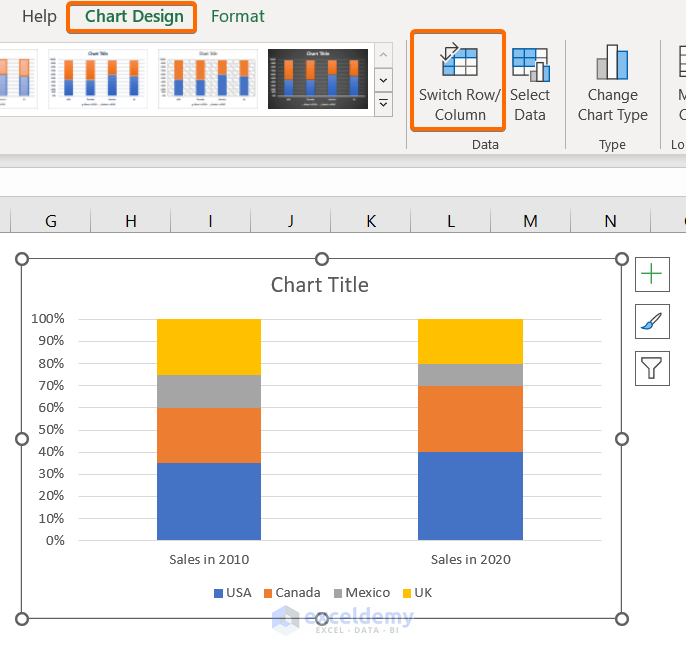
To change this stack representation,
- Click on the chart first.
- Then go to Chart Design ➤ Data ➤ Switch Row/Column.
Now the stack columns are showing based on Sales in 2010 and Sales in 2020.
Read More: How to Create a Stacked Column Chart in Excel
Step-2: Format 100% Stacked Column Chart
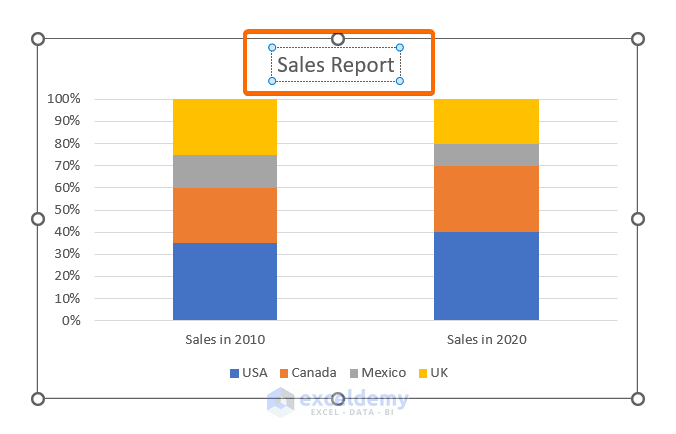
To format a 100% Stacked Column chart, first of all, you need to insert a proper title.
To add a title,
- Edit the texts in the Chart Title.
Here, I used Sales Report as a chart title.
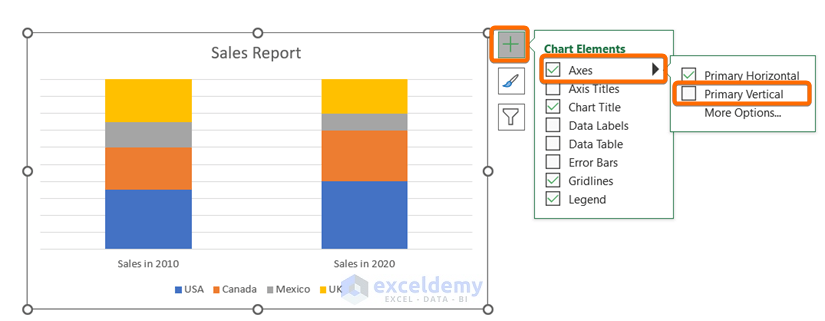
To remove the vertical axes,
- Click on the plus icon at the top-right corner of the chart.
- From the Chart Elements, select Axes.
- Then deselect Primary Vertical.
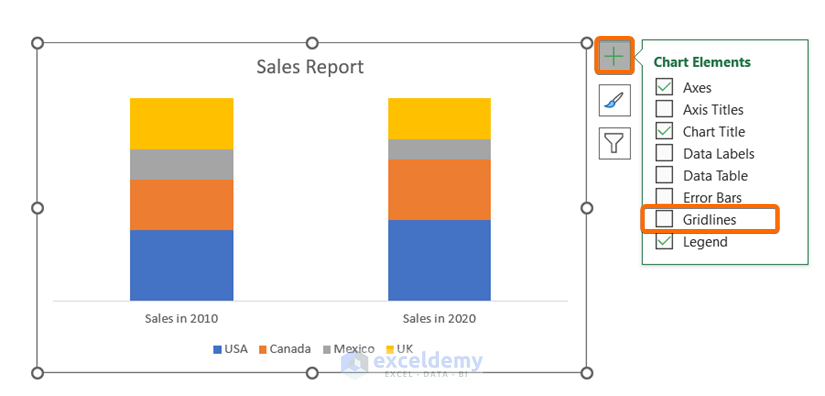
To remove the gridlines,
- Again click on the plus icon at the top-right corner of the chart.
- From the Chart Elements, deselect the Gridlines.
Read More: How to Create a 2D Clustered Column Chart in Excel
Step-3: Add Data Labels to Chart
After the formatting is done, it’s time to add the Data Labels to the column chart.
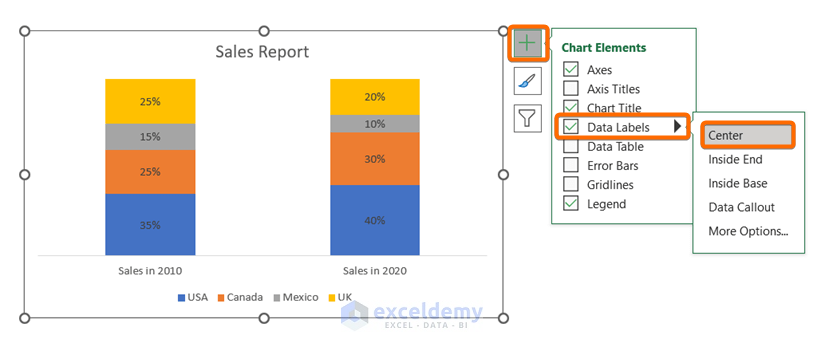
To add data labels on the stacked columns,
- Click on the plus icon at the top-right corner of the chart.
- In the Chart Elements, go to Data Labels.
Now you will see different positioning options such as,
- Center
- Inside End
- Inside Base
- Data Callout
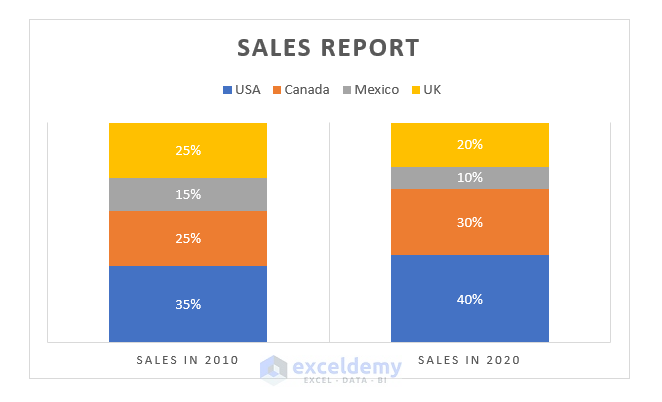
You can select any of them as per your requirement, but I’m selecting Center here.
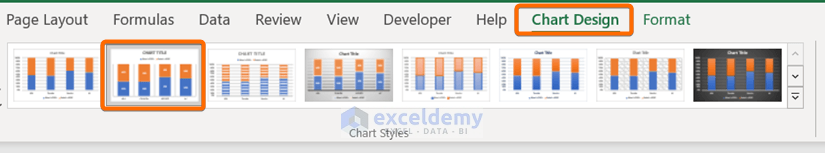
Step-4: Apply a Chart Style
Excel offers some built-in chart styles to apply to your column chart.
To apply a chart style,
- Click on the chart first.
- Then go to Chart Design.
- From the Chart Styles group, select any of the chart styles.
After applying a built-in chart style, the 100% Stacked Column chart will look like this:
Read More: Show Percentage in 100 Stacked Column Chart in Excel
Practice Section
You will get an Excel sheet like the following screenshot, at the end of the provided Excel file where you can practice all the topics discussed in this article.
Download Practice Workbook
You can download the Excel file from the following link and practice along with it.
Conclusion
To sum up, we have discussed steps to make a 100% Stacked Column chart in Excel. Please don’t hesitate to ask any questions in the comment section below. We will try to respond to all the relevant queries asap.
Related Articles
- How to Insert a Clustered Column Chart in Excel
- How to Insert a 3D Clustered Column Chart in Excel
- How to Adjust Chart Spacing in Excel Clustered Column
<< Go Back To Column Chart in Excel | Excel Charts | Learn Excel
Get FREE Advanced Excel Exercises with Solutions!
