We’ll use the NORM.DIST function to find the Normal Distribution in Excel. This function needs 4 arguments:
x: The data for which we’ll determine the normal distribution.
mean: The average value of the dataset.
standard_dev: Measured standard deviation of the dataset.
cumulative: TRUE represents the cumulative distribution function. FALSE represents the probability mass function.
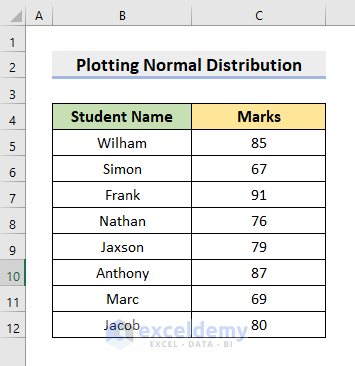
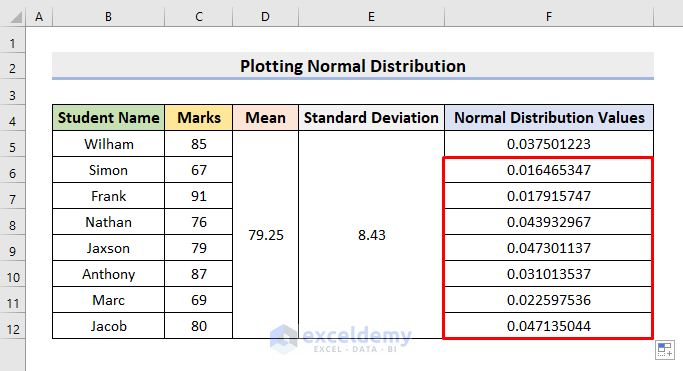
The below dataset contains Student Names and their obtained Marks.
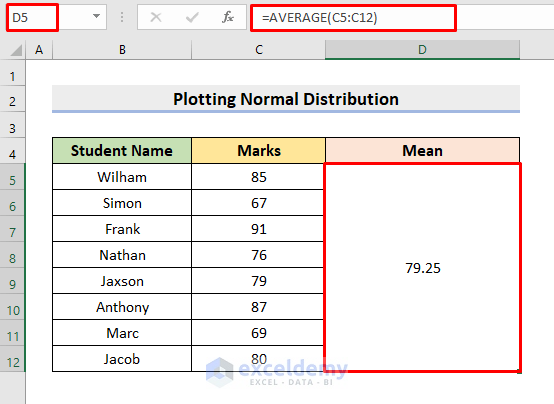
STEP 1: Find the Mean & Standard Deviation
- Merge the cell range D5:D12.
- Enter the following formula in cell C5:
=AVERAGE(C5:C12)- Press Enter.
- It’ll return the Mean.
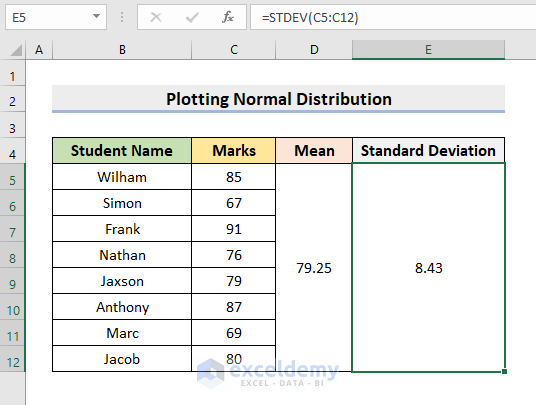
- Merge the range E5:E12.
- Enter the following formula in cell E5:
=STDEV(C5:C12)- Press Enter.
- You’ll get the Standard Deviation.
Read More: Plot Normal Distribution in Excel with Mean and Standard Deviation
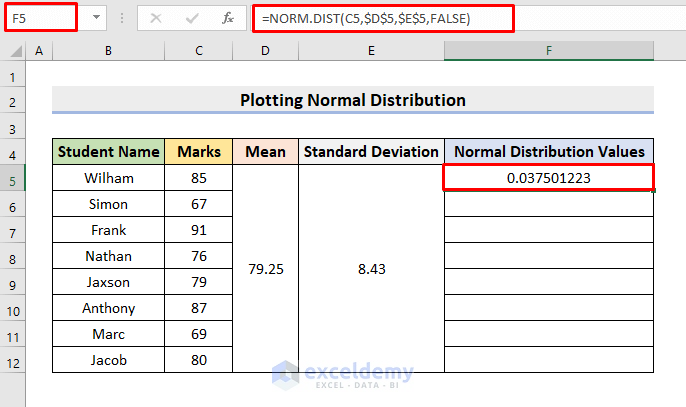
STEP 2: Create a Normal Distribution Chart
- Click cell F5.
- Insert the following formula:
=NORM.DIST(C5,$D$5,$E$5,FALSE)- Press Enter.
- You’ll get the normal distribution point.
- Use the AutoFill tool to complete the series.
- It’ll return all the values.
Read More: How to Create a Distribution Chart in Excel
STEP 3: Plot Normal Distribution in Excel
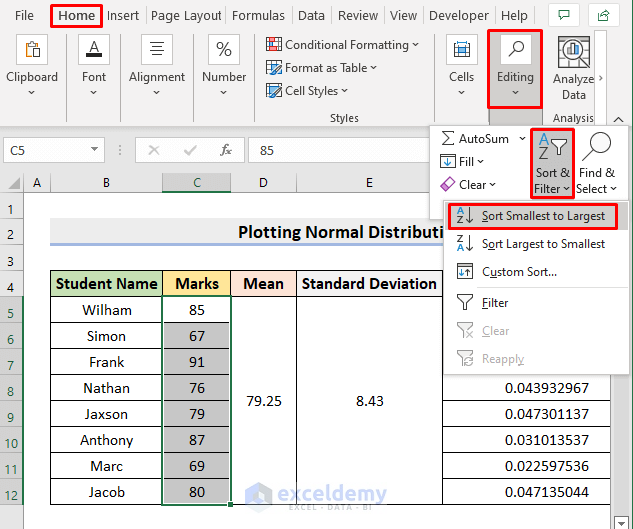
- Select the Marks range C5:C12.
- Choose Home ➤ Editing ➤ Sort & Filter ➤ Sort Smallest to Largest.
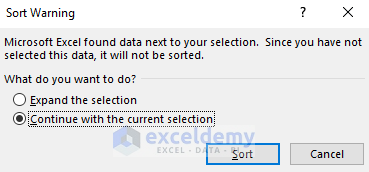
- A warning dialog box will pop out.
- Check the circle for the second option.
- Press Sort.
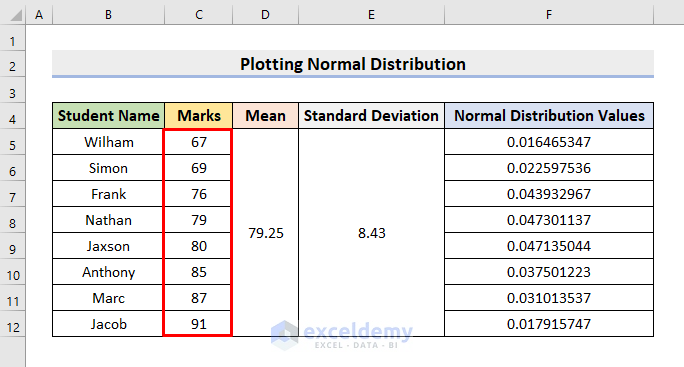
- It’ll return the sorted marks column.
- Select Insert ➤ Insert Scatter or Bubble Chart ➤ Scatter with Smooth Lines.
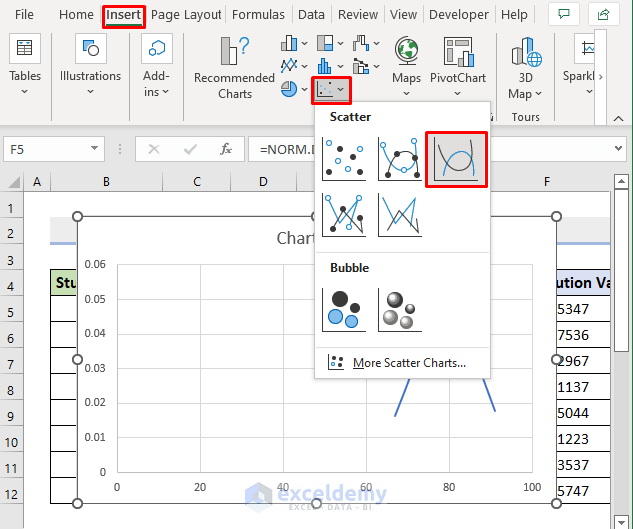
- You’ll get the normal distribution graph.
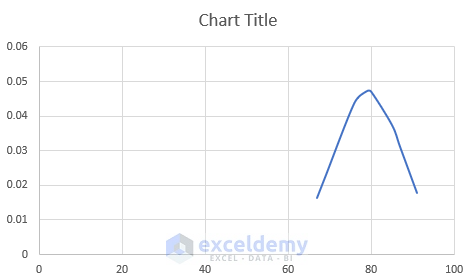
STEP 4: Modify Chart
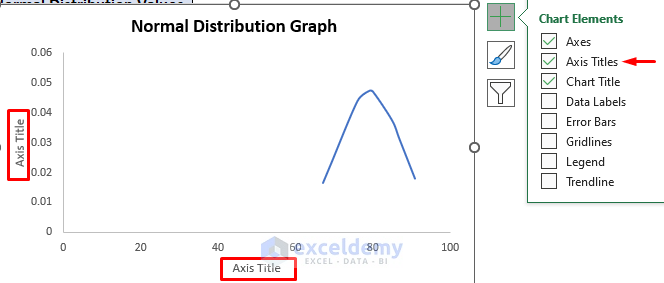
- Double-click on the Chart Title. Rename it as Normal Distribution Graph.
- Click on the chart. Press the + symbol beside the chart as shown below.
- Check the boxes for Axes, Axis Title and Chart Title.
- To remove the gridlines, uncheck the Gridlines box.
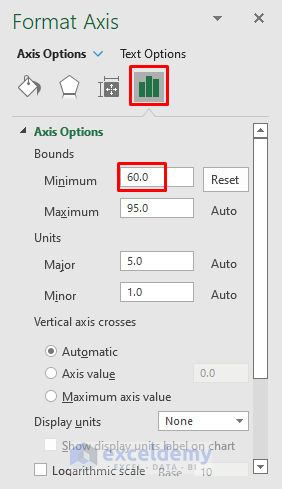
- Double-click the Y-axis.
- The Format Axis pane will appear.
- Set the Minimum Bounds as 60.
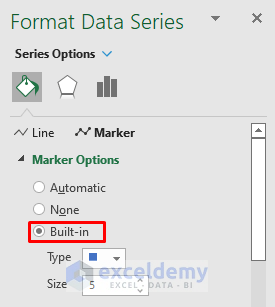
- Double-click the normal distribution curve line.
- You’ll get the Format Data Series pane.
- Check the circle for Built-in Marker Options.
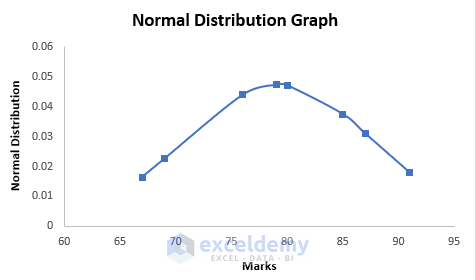
Final Output
After performing all the modifications, our Normal Distribution graph is finally ready to demonstrate.
Read More: How to Create a Probability Distribution Graph in Excel
Things to Remember
- To avoid errors, sort the data before plotting the normal distribution.
- The mean and standard deviation should be in numbers.
- To avoid #NUM! Error, make sure the standard deviation is greater than zero.
Download the Practice Workbook
Download the following workbook to practice.
Related Articles
- How to Plot Frequency Distribution in Excel
- How to Plot Poisson Distribution in Excel
- How to Plot Weibull Distribution in Excel
- How to Plot Particle Size Distribution Curve in Excel
<< Go Back to Excel Distribution Chart | Excel Charts | Learn Excel
Get FREE Advanced Excel Exercises with Solutions!
