
Excel is far more powerful than most people realize; it’s more than a calculation tool. With the right combination of formulas, Power tools, and creative thinking, Excel can manage projects, simulate business risk, automate data pipelines, and even make predictions. Excel can actually handle sophisticated projects that rival dedicated software platforms.
In this article, we will explore 5 Excel projects that push the limits of spreadsheets.
1. Advanced Interactive Dashboard With Power Query, Power Pivot, and VBA
Transform Excel into a complete business intelligence platform with automated data pipelines, relational data models, and interactive visualizations.
You can build a sales dashboard that pulls data from multiple sources, creates table relationships, performs complex calculations with DAX, and provides real-time insights through dynamic charts and slicers.
Steps:
Import Data:
- Go to the Data tab >> select Get Data >> select From File (CSV/TXT for Sales, Products, Customers, Regions, etc)
- Click Transform Data to load data into the Power Query editor
Clean Data in Power Query:
- Remove duplicates and empty rows
- Adjust data types
- Append files into one table
Load to Data Model:
- Add all queries to the Data Model
- Open Power Pivot and define relationships:
- Sales[ProductID] → Products[ProductID]
Add DAX Measures:
Total Sales = SUM(Sales[Amount])

Sales Growth % = DIVIDE(
    SUM(Sales[Amount]) - CALCULATE(SUM(Sales[Amount]), PREVIOUSMONTH(Dates[Date])),
    CALCULATE(SUM(Sales[Amount]), PREVIOUSMONTH(Dates[Date]))
)
Create Dashboard:
- Create a PivotTable to summarize data
- KPIs for Revenue, Profit, and YoY Growth
- Insert PivotCharts linked to measures
- Insert the revenue trend chart (clustered column)
- Add the top products chart (clustered bar)
- Add slicers for Month, Region, and Category
Automate With VBA:
Sub RefreshDashboard()
    ThisWorkbook.RefreshAll
End Sub
A fully automated Excel dashboard that merges and refreshes data sources seamlessly. It is one of the Excel projects that pushes the limits of spreadsheets
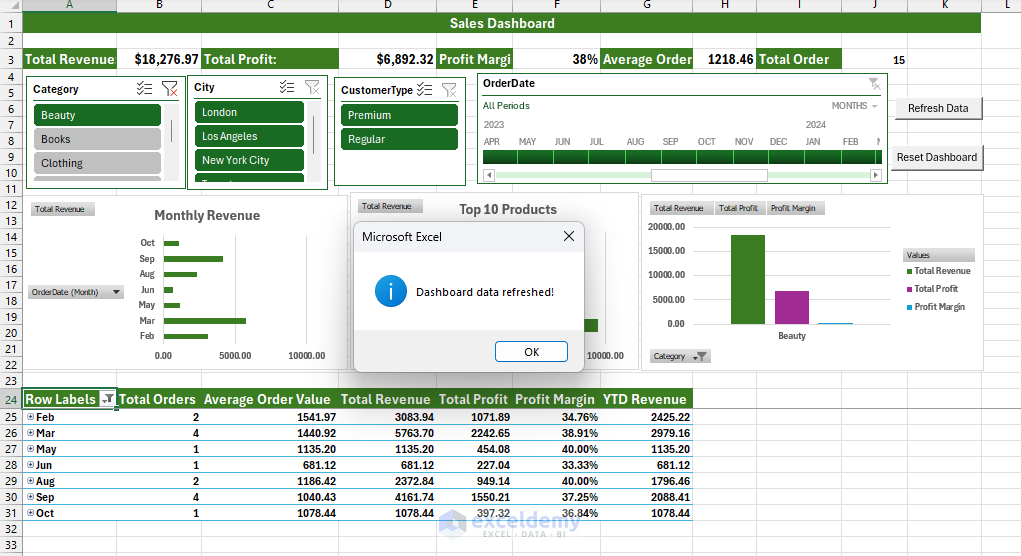
Most dashboards use basic formulas. This creates a true data warehouse with relationships, automated ETL, and enterprise-level calculations—all in Excel.
Detailed Guide: Building Advanced Excel Dashboards With Power Query, Power Pivot, and VBA
2. Project Management Dashboard With Gantt-Like Views
Every great system begins with structure. Excel can serve as a lightweight project management solution that visualizes progress and deadlines in one dynamic dashboard. Instead of plain lists, you can design a Gantt-style timeline that updates automatically as dates or statuses change.
Suppose you’re coordinating a product launch with phases like Planning, Design, Review, and Launch. Track tasks, durations, and progress visually. Turn task data into a visual, self-updating schedule.
Steps:
Set Up the Task Table:
- Set up columns: Task Name, Start Date, End Date, Duration, Phase, Assignee, Progress %
- Calculate Duration:
Calendar days: =C2 - B2 + 1

For working days only: =NETWORKDAYS(B2, C2)
- Add Data Validation:
- Go to the Data tab >> select Data Validation
- Create validation for “Planning, Design, Review, Launch”
Gantt-Like View With Conditional Formatting:
- Across the top row, add sequential project dates: 1-Jan, 2-Jan, 3-Jan … 31-Jan
- Apply conditional formatting rules for each phase:
Planning (Blue): =AND(I$1 >= $C2, I$1 <= $D2, $F2=”Planning”)
Design (Peach): =AND(I$1 >= $C2, I$1 <= $D2, $F2=”Design”)
Review (Light Blue): =AND(I$1 >= $C2, I$1 <= $D2, $F2=”Review”)
Launch (Green): =AND(I$1 >= $C2, I$1 <= $D2, $F2=”Launch”)
Summarize Project Stats:
=COUNTIF(StatusRange,"Completed")

=AVERAGE(PercentCompleteRange)
A live Gantt dashboard that keeps everyone aligned on tasks and deadlines — no project software needed.
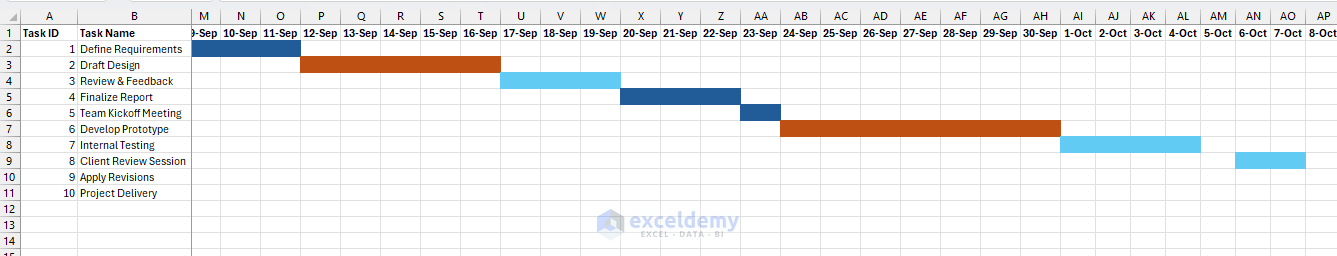
Project management tools cost money and have learning curves. This Excel solution provides professional Gantt charts with full customization control, no subscription fees, and formats perfect for both daily management and executive presentations.
Detailed Guide: How to Use Excel as a Lightweight Project Management Tool With Gantt-Like Views
3. Excel CRM System: Managing Clients, Deals, and Follow-Ups
Excel isn’t just for internal tasks; it can become your relationship manager. You can build a complete customer relationship management (CRM) system with multiple related tables, automated lookups, and pipeline tracking—no subscription fees required.
Build a normalized multi-table CRM that tracks companies, contacts, activities, and deals with clients, and reminds you when to follow up.
Steps:
Set Up Your Tables:
- Store client info (Name, Email, Last Contact Date, Next Follow-Up)
- Create a company table with CompanyID, CompanyName, Industry, and Website
- Create a contact table with all necessary information
- Build an Activity table with proper information and columns
- Create a deals pipeline table with details
Convert to Table:
- Select the data range
- Go to the Insert tab >> select Table (press CTRL + T)
- Check “My data has headers”
- Click OK
- Name it “tblCompanies”
Calculations:
Quick Lookup: =XLOOKUP([@CompanyID], tblCompanies[CompanyID], tblCompanies[CompanyName], "")

Next Follow-Up: =IF([@CreatedOn]="", "", [@CreatedOn] + 7)

Due Date: =IF([@Date]="", "", [@Date] + 7)

Mark Open Deals: =IF(OR([@Stage]="Won", [@Stage]="Lost"), FALSE, TRUE)

Flag Overdue: =AND([@IsOpen], [@CloseDate]<TODAY())
- Add conditional formatting to highlight overdue deals
Create Dashboard With KPIs:
Total Contacts: =COUNTA(tblContacts[ContactID])

Open Pipeline: =SUMIFS(tblDeal[Amount], tblDeal[IsOpen], TRUE)

Win Rate: =COUNTIFS(tblDeal[Stage], "Won")/(COUNTIFS(tblDeal[Stage], "Won")+COUNTIFS(tblDeal[Stage], "Lost"))

Track Total Revenue: =SUMIFS(tblDeal[Amount], tblDeal[Stage], "Won")
- Create a pipeline-by-stage chart (clustered column)
- Use PivotTables for deeper analysis
Add Automated Alerts:
=IF(TODAY()>=[Next Follow-Up],"Overdue","Upcoming")
- Highlight “Overdue” cells in red
A functional CRM system that tracks leads, revenue, and follow-up schedules—all in Excel.
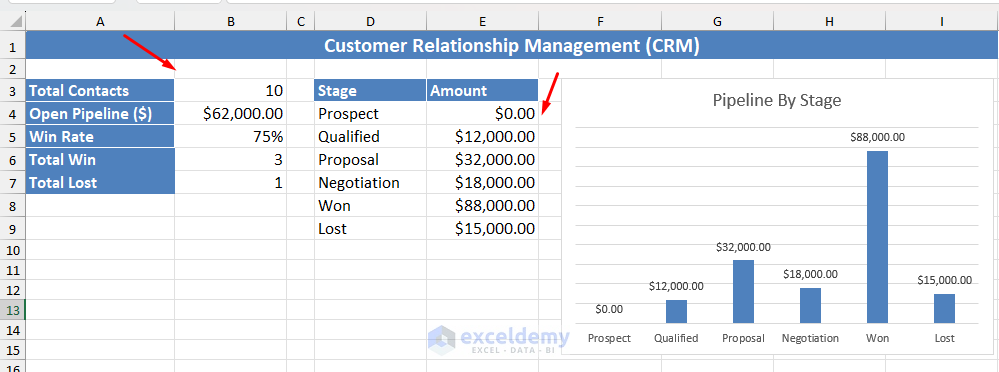
Most Excel databases are single flat tables. This creates proper normalization with foreign keys, automated lookups, and relationship integrity—database principles in a spreadsheet.
Detailed Guide: How to Build a Simple CRM in Excel That Actually Works
4. Monte Carlo Simulation for Modeling Risk and Uncertainty
Business planning always involves uncertainty. Monte Carlo simulation enables you to estimate the probability of various outcomes—such as profit variability, delivery time, or investment returns—through random sampling. It can run thousands of probabilistic scenarios to model uncertainty, assess risk, and support data-driven decisions under variability.
Build a Monte Carlo simulator that runs 1,000+ scenarios to predict profit distribution, calculate confidence intervals, and determine the probability of loss for an e-commerce business.
Steps:
Define Assumptions:
- Columns: Simulation Number, Selling Price, Units Sold, Cost per Unit, Revenue, Total Cost, Profit
- Define key variables with realistic ranges
Generate Random Inputs:
Simulation Number: Use Series (1 to 1000)
Selling Price (normal distribution): =NORM.INV(RAND(), 30, 4.5)

Units Sold (uniform): =RANDBETWEEN(100, 550)

Cost per Unit (uniform): =RANDBETWEEN(10, 18)

Revenue: =B2*C2

Total Cost: =(D2*C2) + 1000 + (E2*0.1)

Profit: =E2 - F2
Analyze Results:
Average Profit: =AVERAGE(G2:G1001)

Minimum (worst case): =MIN(G2:G1001)

Maximum (best case): =MAX(G2:G1001)

Probability of Loss: =COUNTIF(G2:G1001,"<0")/COUNTA(G2:G1001)

95% CI Lower Bound: =PERCENTILE(G2:G1001, 0.025)

95% CI Upper Bound: =PERCENTILE(G2:G1001, 0.975)
Visualize Distribution:
- Select the Profit column
- Go to the Insert tab >> select Histogram
- Analyze shape: normal, skewed, or bimodal
- Identify risk concentration areas
Compare Scenarios: Use Data Tables under What-If Analysis to model different cases.
A probabilistic forecast model that quantifies risk and helps make smarter business decisions.

Monte Carlo simulation typically requires statistical software. Excel’s Data Table feature, combined with its probability and distribution functions, creates a powerful risk analysis tool for financial forecasting, inventory optimization, and project planning.
Detailed Guide: Implementing Monte Carlo Simulation in Excel
5. Machine Learning Models With Solver and Formulas
Machine learning doesn’t have to start in Python or R. Excel’s Solver and array formulas can perform linear regression and simple optimization, making it an excellent introduction to predictive modeling.
You can develop a basic predictive model that learns from data using Solver.
Steps
Prepare Your Dataset:
- Create columns: Advertising Spend (X), Sales Revenue (Y)
- Use realistic data showing a linear relationship
Define the model equation: Predicted Sales = m * Advertising + b
Calculate Predictions: =($D$1*A2)+$D$2

Compute Error: =(Predicted - Actual)^2

Average Error: =AVERAGE(ErrorRange)
Use Solver:
- Objective: Minimize MSE
- Variables: m, b
- Click Solve to optimize
Evaluate Results: Plot Actual vs. Predicted using a scatter chart.
A simple learning model that predicts future outcomes is a stepping-stone toward full machine learning techniques.
Linear Regression:

Logistic Regression:
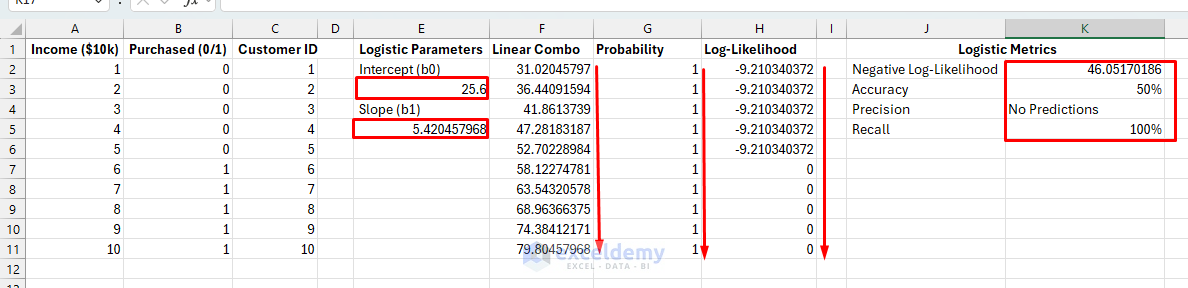
Machine learning is typically done in Python or R. Excel’s Solver with statistical functions proves you can build working machine learning models with complete transparency — perfect for learning fundamentals or quick prototyping without coding.
Detailed Guide: How to Build Lightweight Machine Learning Models in Excel Using Solver and Formulas
Conclusion
In this article, we have shown 5 Excel projects that push the limits of spreadsheets. These five projects prove Excel’s versatility; it can manage your projects, customers, risks, dashboards, and predictions in one ecosystem. Each project pushes Excel’s boundaries in different ways: the dashboard creates enterprise-level BI, the CRM implements database normalization, the Monte Carlo engine performs statistical risk analysis, the Gantt system rivals project management software, and the machine learning models demystify predictive analytics.
Get FREE Advanced Excel Exercises with Solutions!
