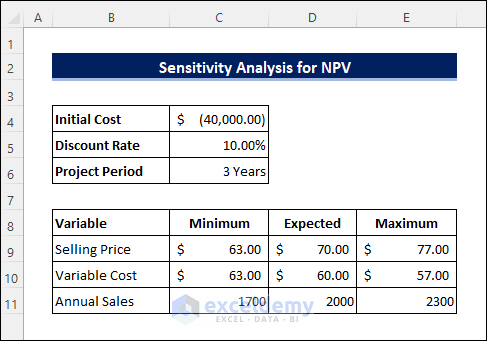
You have a three-year project. The revenue from the project depends on 3 variables: selling price, variable cost, and annual sales. To know how changes in these variables will affect the Net Present Value (NPV) of the project:
Steps 1 – Calculate the Profit Margin
- Enter the following formula in C13 to calculate the margin between cost and sales.
=D9-D10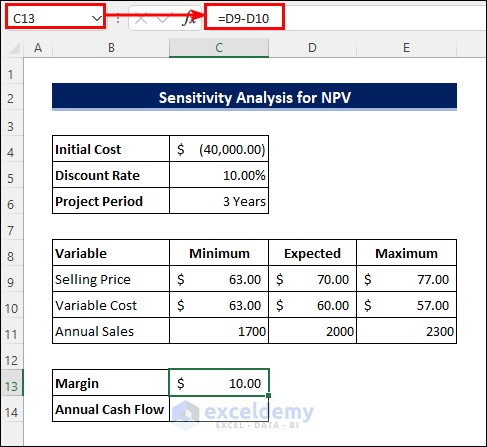
Steps 2 – Estimate the Annual Cash Flow
- Use the following formula in C14 to estimate the annual cash flow.
=C13*D11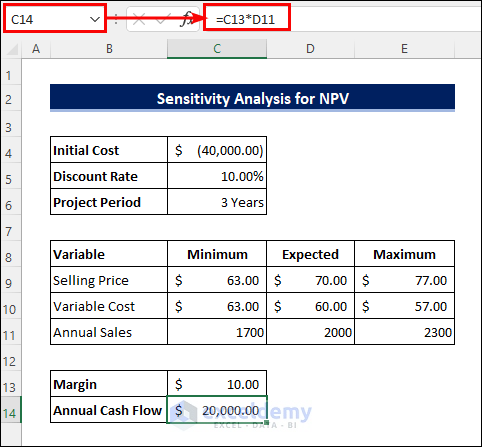
Read More: How to Use What If Analysis in Excel
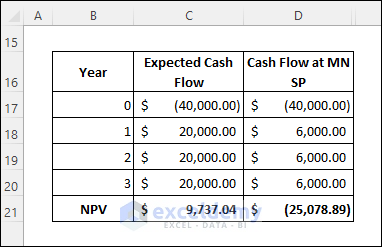
Steps 3 – Create a NPV Table
- Create a table showing yearly cash flows (the numbers in brackets are negative):

- Enter the following formula in C21 to get the NPV based on the expected cash flow.
=NPV($C$5,C18:C20)+C17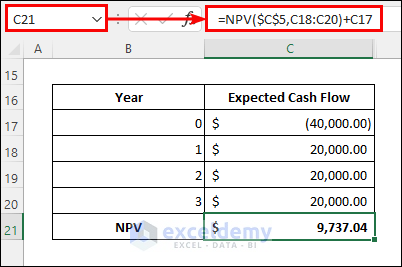
- To forecast how the NPV will change if the selling price falls to a defined minimum, change the formula in C13:
=C9-D10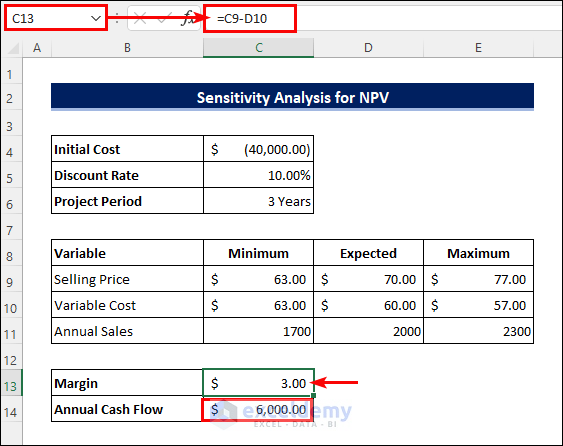
Note:
You can change only one variable at a time and keep the others as expected.
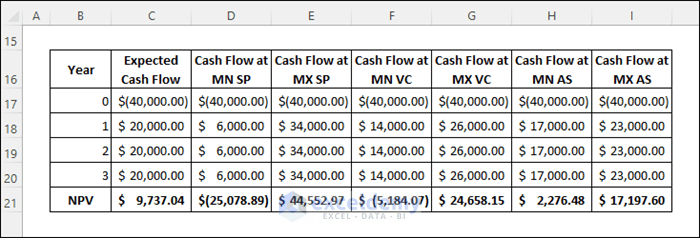
- Extend the NPV table to get the NPV at the minimum selling price.
-
- Change the formula in C14 to know what will happen if the annual sales drop to a minimum. Calculate the margin from the expected values.
=C13*C11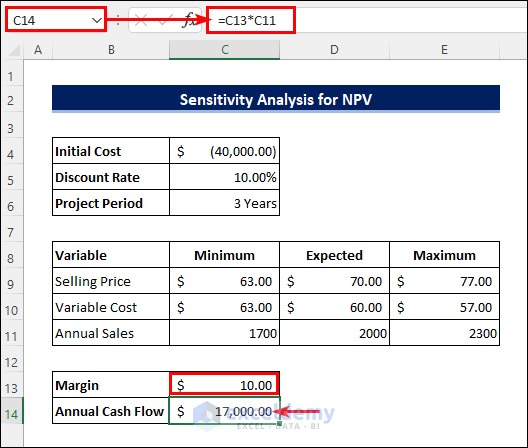
- Change the formulas for a different variable one by one to complete the following table.
Read More: What-If Analysis in Excel with Example
Steps 4 – Perform a Sensitivity Analysis for NPV
- Create another table to compare the changes in the NPV with the changes in the variables. Use the following formula in F24 to see the change in the NPV.
=E24-C24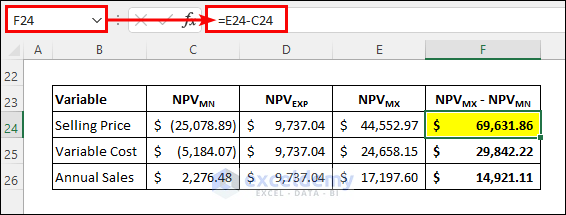
Remarks:
The selling price is the most sensitive variable. You can also calculate that a 20% increase in the selling price may increase the NPV by more than 700%.
Read More: How to Build a Sensitivity Analysis Table in Excel
Download Sample Workbook
Download the free template.
Related Articles
- How to Perform Sensitivity Analysis for Capital Budgeting in Excel
- How to Do IRR Sensitivity Analysis in Excel
- How to Get Sensitivity Report from Solver in Excel
- What If Analysis Data Table Not Working
- How to Delete What If Analysis in Excel
<< Go Back to What-If Analysis in Excel | Learn Excel
Get FREE Advanced Excel Exercises with Solutions!
