The sales run rate is used to estimate a company’s potential future revenue based on its present revenue. It is determined by dividing the total current sales by the number of months that are involved with the current sales and then multiplying that value by 12.
Sales/Revenue Run Rate Formula:
The following formula is used in each of the examples.
Sales run rate can be calculated based on various criteria.
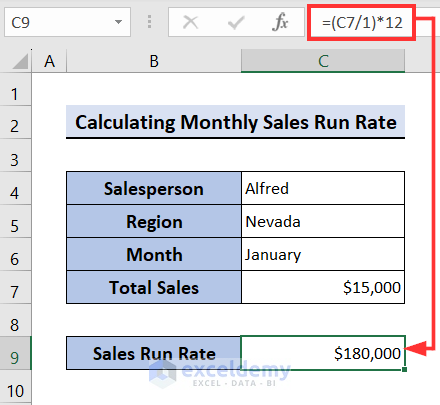
Example 1 – Calculating Monthly Sales Run Rate
In the below example the company has made $15,000 in sales for January. This is used to predict the annual total sales which is the sales run rate.
Steps:
- Select Cell C9, apply the formula below and press Enter.
=(C7/1)*12The annual rate is returned.
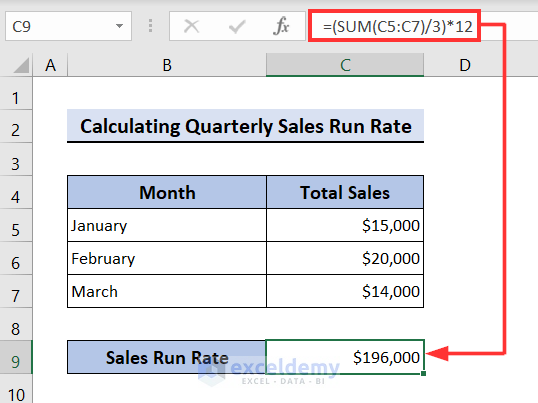
Example 2 – Calculating Quarterly Sales Run Rate
In this example the dataset contains the total sales for January, February, and March, which can be used to calculate the quarterly sales run rate.
Steps:
- Select Cell C9, insert the below formula, and hit Enter.
=(SUM(C5:C7)/3)*12The Current Sales are calculated by finding the SUM(C5:C7) and dividing by the number of months in the period which is 3 then multiplying by 12.
Example 3 – Calculating Half-Yearly Sales Run Rate
This dataset contains total sales from January to June which can be used to calculate the half-yearly sales run rate.
- Select Cell C12 then apply the below formula.
=(SUM(C5:C10)/6)*12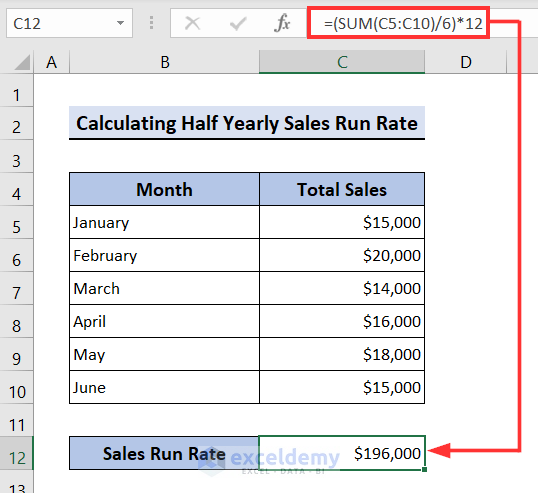
How to Calculate Dynamic Daily Run Rate in Excel
The sample dataset below contains the Actual Sales made for each product before March 10th.
Based on this it is possible to calculate the daily run rate for total days left and working days left to meet the sales target for the end of March.
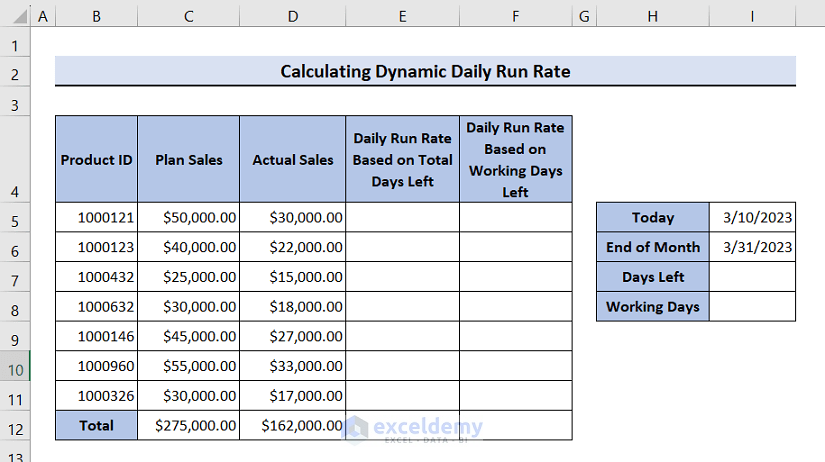
- Begin by calculating the total days left. In Cell I5, the starting date March 10 has been entered in mm/dd/yyyy format and in Cell I6 the end date is March 31.
- Select Cell I7, and insert the below formula.
=I6-I7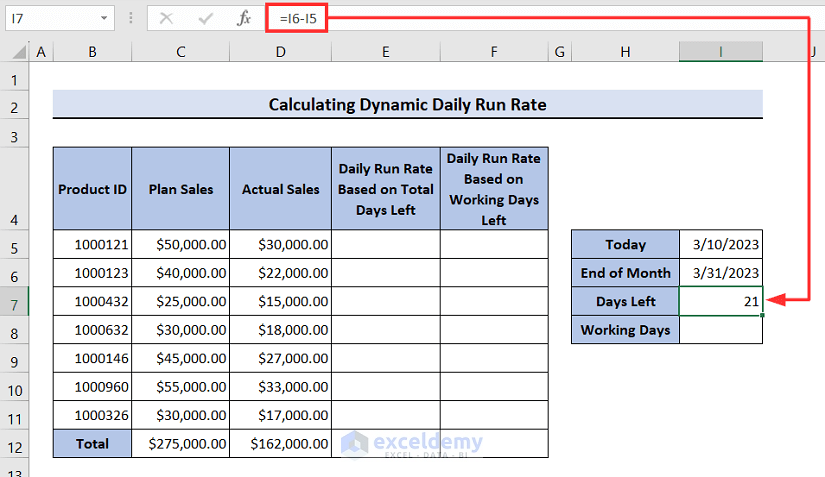
- The NETWORKDAYS function is used to calculate the total working days left.
- Select Cell I8, enter the formula below, and hit Enter.
=NETWORKDAYS(I5,I6)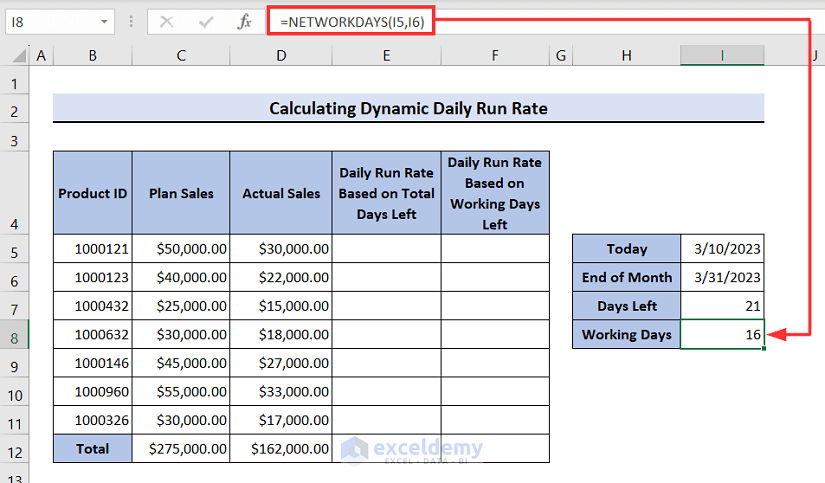
- To calculate the daily run rate based on the total days left for the first product, select Cell E5, enter the formula below, and press Enter.
- Use the Fill handle icon to drag the results down the column.
=(C5-D5)/$I$7![]()
- To determine the daily run rate based on working days left, select Cell F5, insert the formula below, and click on Enter.
- Use the Fill handle icon to drag the results down the column.
=(C5-D5)/$I$8![]()
- To calculate the sum of the daily run rate of all the products, use the SUM function.
- Select Cell E12 enter the below formula and press Enter.
- Use the Fill handle icon to drag right this time.
=SUM(E5:E11)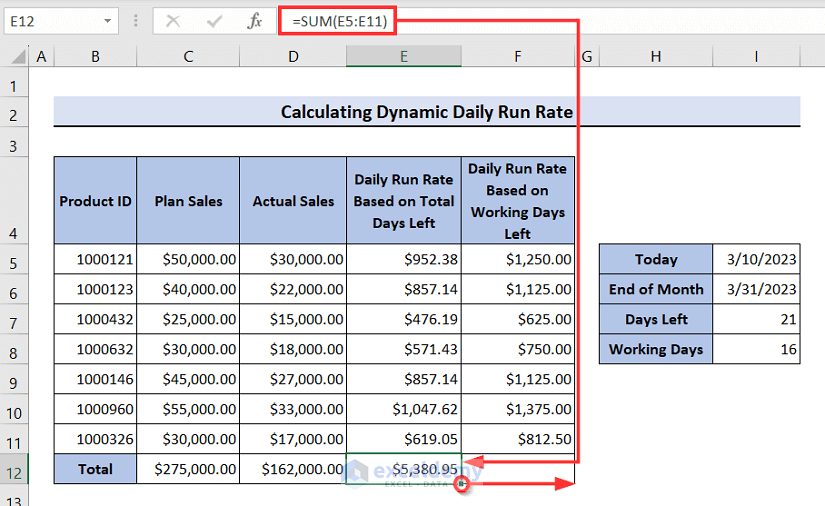
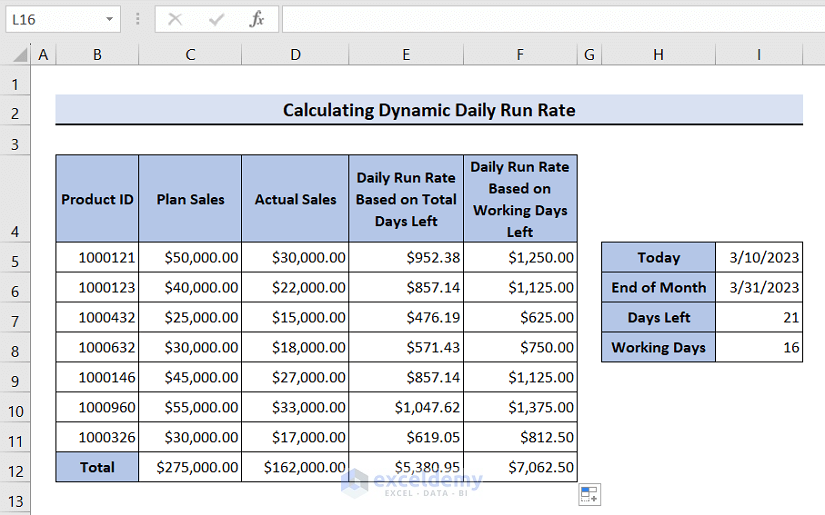
- The dynamic daily run rate is returned as below.
How to Forecast Sales in Excel
Excel’s FORECAST function is the simplest way to forecast sales.
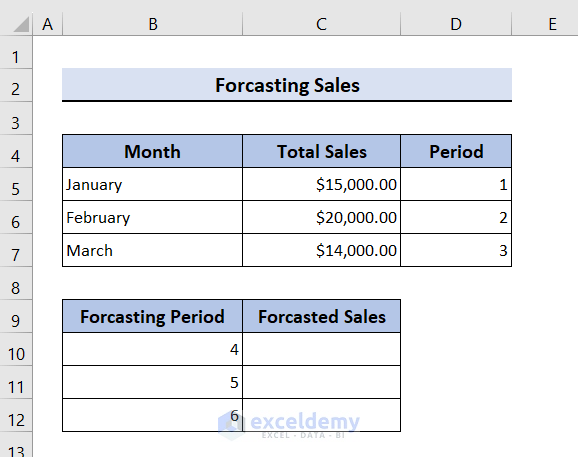
- Select Cell C10 and enter the below formula, then press Enter.
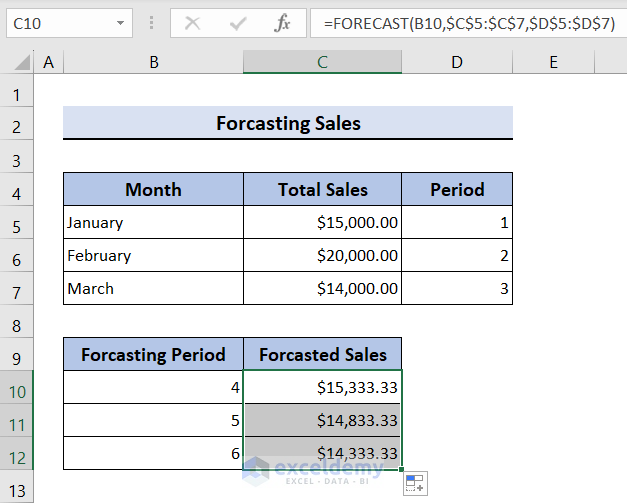
- Use the Fill handle icon to drag the results down the column.
=FORECAST(B10,$C$5:$C$7,$D$5:$D$7)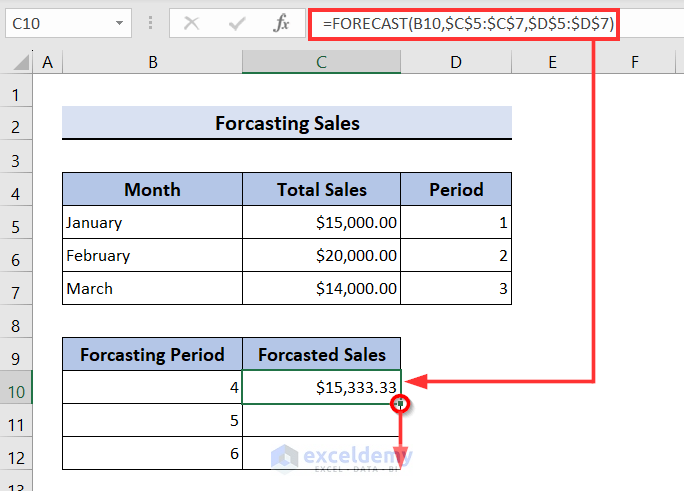
- The forecasted sales for the next three months are returned as below.
Download Practice Workbook
<< Go Back to Sales | Formula List | Learn Excel
Get FREE Advanced Excel Exercises with Solutions!
