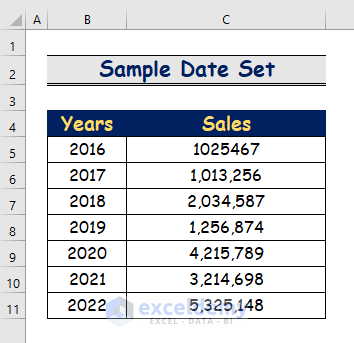
Dataset Overview
We’ve provided a data set containing information about the annual sales. We need to project future sale price.
Method 1 – Apply the FORECAST Function
Step 1 – Insert the x Argument
- Click on cell F4 to insert the x value. Here, x represents the predicted time value in years.
- Enter the following formula:
=FORECAST(F4,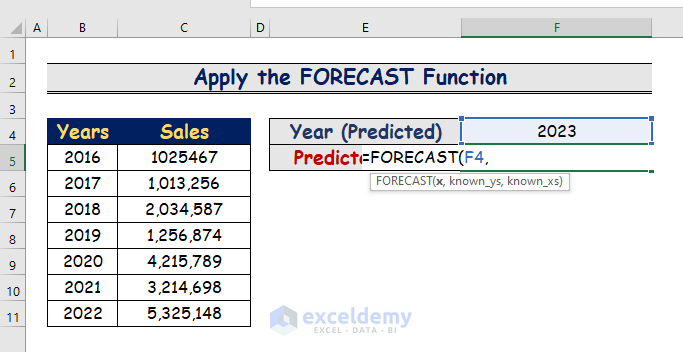
Step 2 – Select Range for known_ys Argument
- Choose the range C5:C11, which contains the previous sales data, as the known_ys argument.
- Enter the formula:
=FORECAST(F4, C5:C11,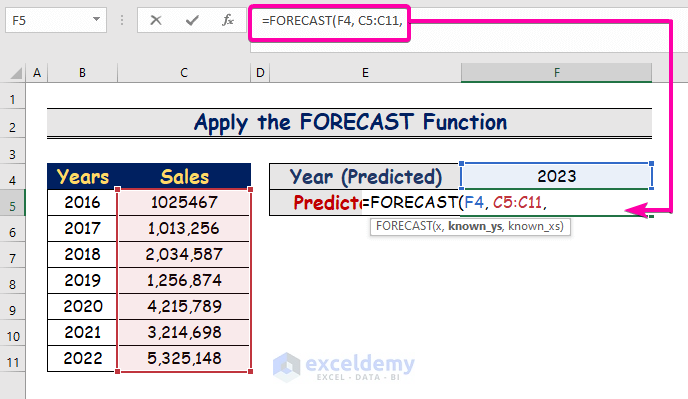
Step 3 – Insert the known_xs Argument
- Select the range B5:B11 and include the years as the known_xs argument.
- The complete FORECAST function formula looks like this:
=FORECAST(F4, C5:C11,B5:B11)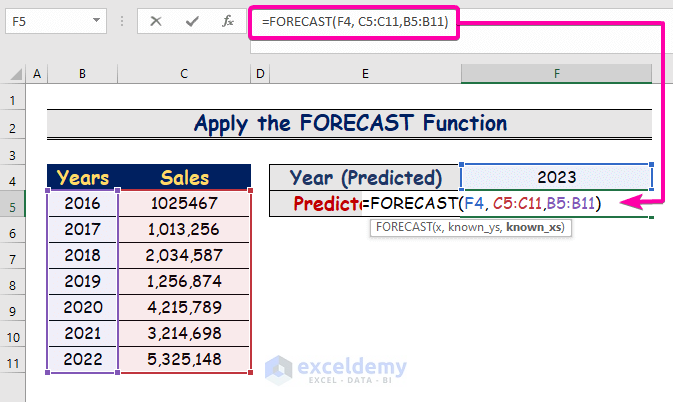
- Press Enter to see the predicted result.
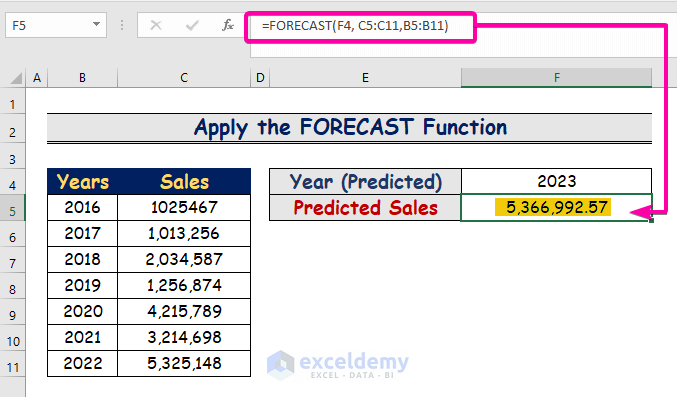
- The predicted result will appear in cell F5 (e.g., 5,366,992.57).
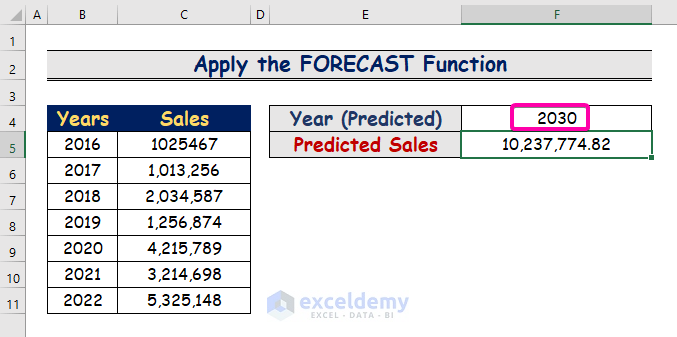
- To get the sales value for a specific year (e.g., 2030), enter that year and find the result in cell F5 (e.g., 10,237,774.82).
Method 2 – Use Forecast Sheet Command
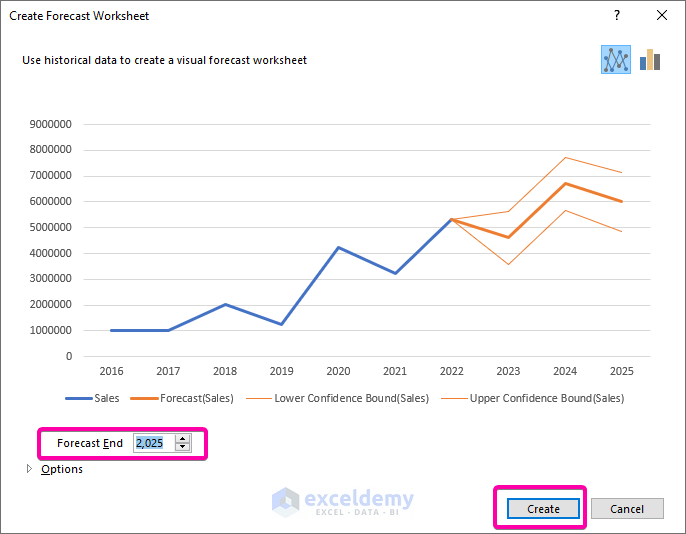
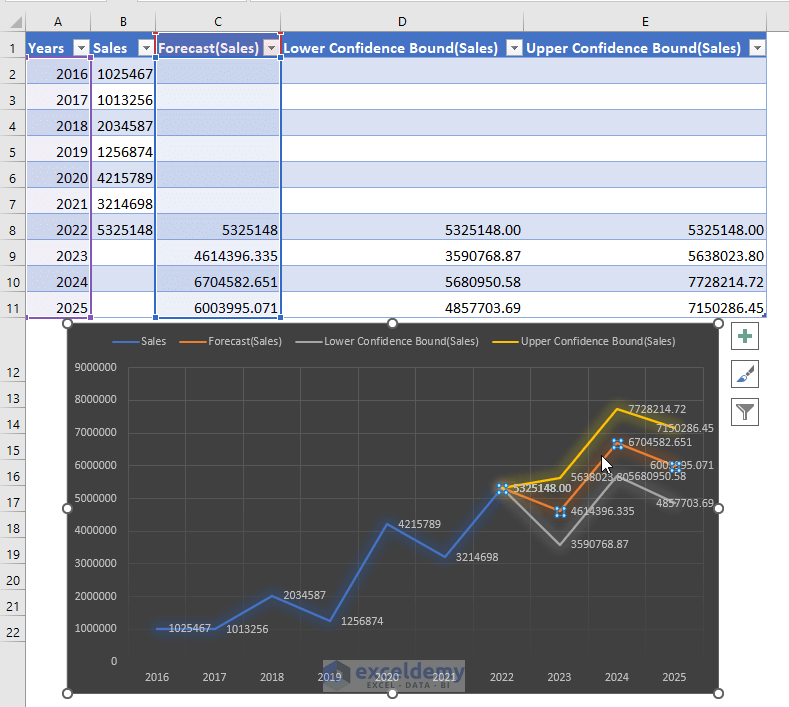
The Forecast Sheet command in Excel allows you to create predictions based on historical data. It generates a graph chart from which we can obtain predicted data for a given time period, as well as the Upper Confidence Bound (highest possible value) and Lower Confidence Bound (lowest possible value).
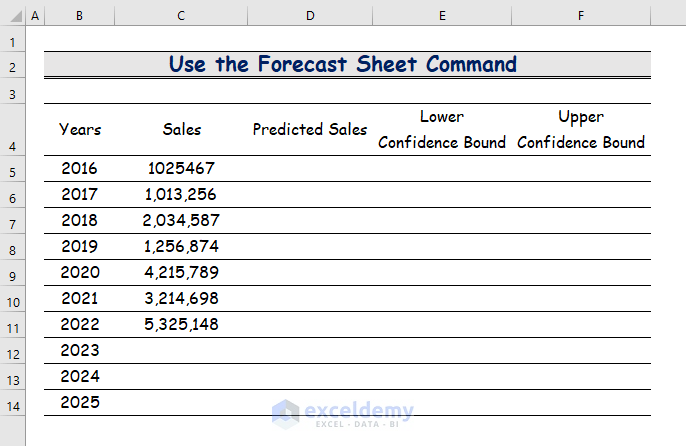
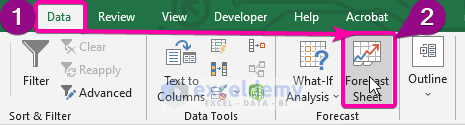
Step 1 – Select Cell
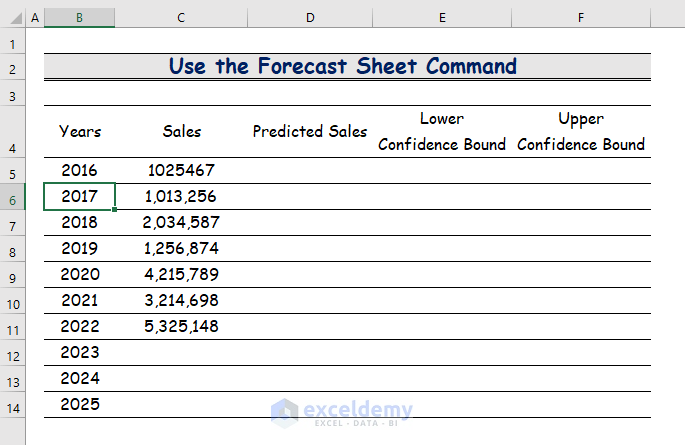
- Click on any cell containing a value from your data set.
Step 2 – Apply Forecast Sheet Command
- Go to the Data tab and select the Forecast Sheet command from the Forecast group.
- A chart will display the data set values.
- Choose the year (e.g., 2025) and set the ending time in the Forecast End box.
- Click the Create button.
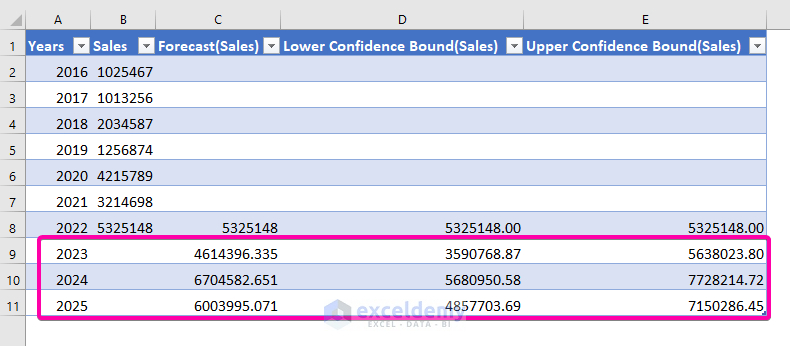
- The Forecast Sheet table will show predicted sales values up to 2025.
- The lowest possible sales value for 2025 is 69, and the highest possible value is 7,150,286.45.
Step 3 – Edit Chart with Labels and Style
- Click on the Chart Element icon.
- Select Data Labels to display labels on the graph.
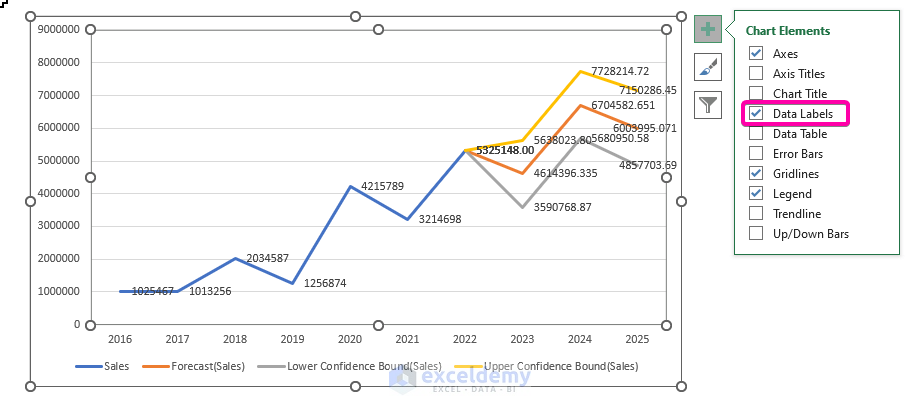
- Choose a preferred style from the Style options.
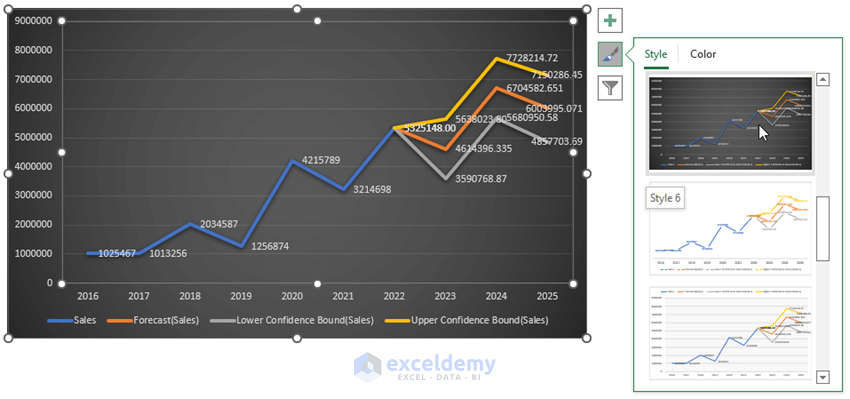
- Clicking on chart lines will highlight corresponding cell values in your data range.
Download Practice Workbook
You can download the practice workbook from here:
<< Go Back to Sales | Formula List | Learn Excel
Get FREE Advanced Excel Exercises with Solutions!
