In this article, I am going to show how we can calculate Pearson’s Coefficient of Skewness in Excel. Excel offers two functions SKEW and SKEW.P to calculate normal skewness or in other words, the Fisher-Pearson coefficient of skewness. However, It doesn’t provide any dedicated function to calculate Pearson’s Coefficient of Skewness. Hence, we need to use multiple functions to calculate Pearson’s Coefficient of Skewness.
The coefficient of Skewness quantifies the degree to which a distribution deviates from being perfectly symmetric. We need to calculate the coefficient of Skewness in many situations such as in Educational Research, Marketing and Consumer Research, Business Decision Making, Financial Analysis, etc.
Download Practice Workbook
Download this practice workbook to exercise while you are reading this article.
What Is Pearson’s Coefficient of Skewness?
Pearson’s Coefficient of Skewness was first introduced by Karl Pearson. It is measured using two following formulas. The first formula is used when you want to measure the asymmetry of the data distribution based on the Mode.
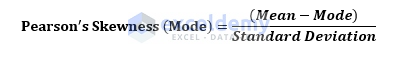
It is usually used when Mode serves as the pivotal point or central point of focus and we need to measure how the data points are spread away from the Mode.
On the other hand, when the Median is the center of our concern or no Mode is found, then we use the following formula.
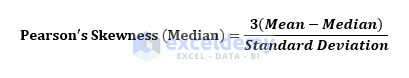
Here, instead of using Mode, Median is used and it is multiplied by 3.
How to Calculate Pearson’s Coefficient of Skewness in Excel: 3 Methods
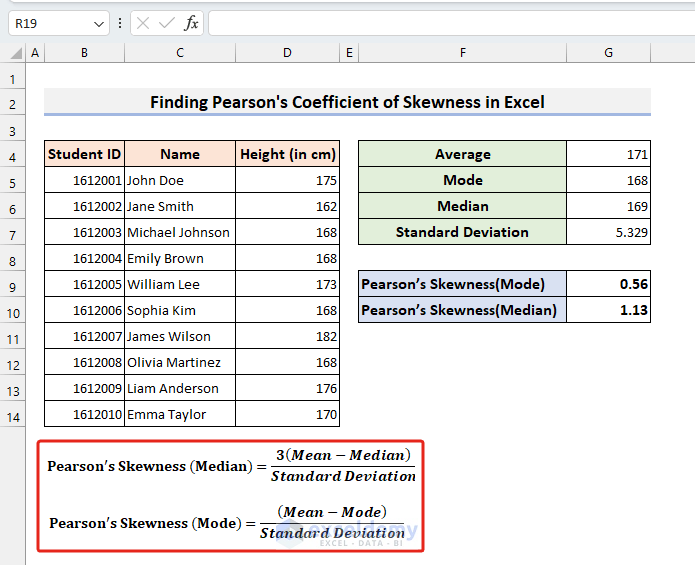
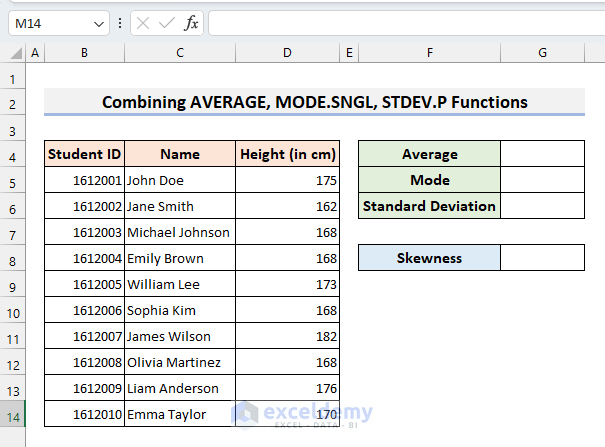
In this section, we will demonstrate 3 useful methods to calculate Pearson’s Coefficient of Skewness in Excel with appropriate illustrations. To illustrate, I have used a small dataset containing the height of 10 students in a class.
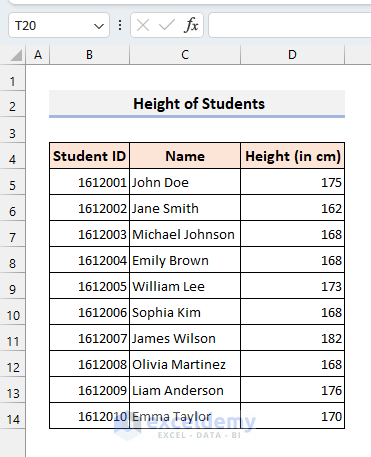
Now, we will calculate Pearson’s Coefficient of Skewness of the heights of the students.
1. Combine AVERAGE, MODE.SNGL, STDEV.P Functions
In the first, example we will calculate Pearson’s Coefficient of Skewness(Mode). As we saw in the previous section, To calculate Pearson’s Coefficient of Skewness(Mode), we need to calculate Mean, Mode, and Standard Deviation. Hence, we will calculate them individually.
- To calculate the Mean, we use the following formula in cell G4.
=AVERAGE(D5:D14)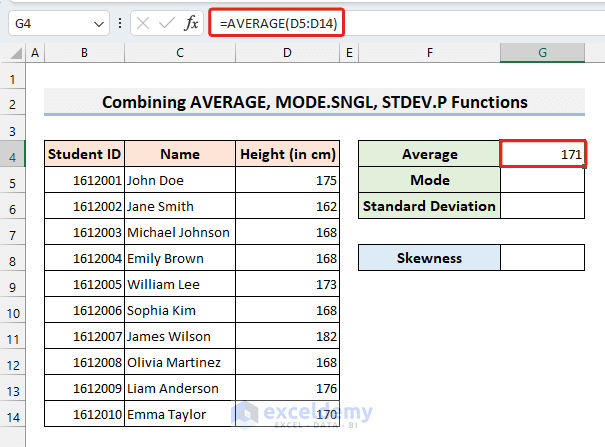
- Now, we use the following formula to calculate the Mode in cell G5.
=MODE.SNGL(D5:D14)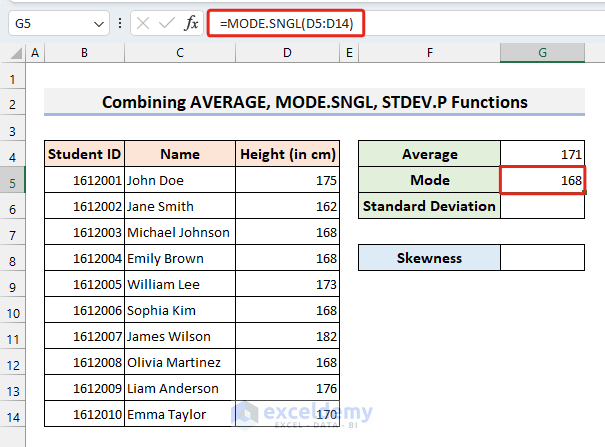
- In the cell G6, we use the following formula to calculate Standard Deviation.
=STDEV.P(D5:D14)
- Finally, in the G8, we use the following formula to calculate Pearson’s Coefficient of Skewness(Mode).
=(G4-G5)/G6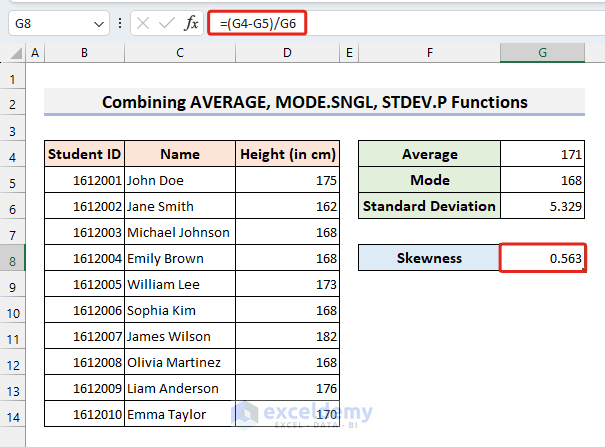
2. Join AVERAGE, MEDIAN, STDEV.P Functions
In the 2nd example, we will calculate Pearson’s Coefficient of Skewness(Median) of the same dataset. To do that, we need to calculate the Mean, Median, and Standard Deviation. Like the first example, we calculate the Mean, Standard Deviation using the same formulas. Then, we calculate the Median using the following formula.
=MEDIAN(D5:D14)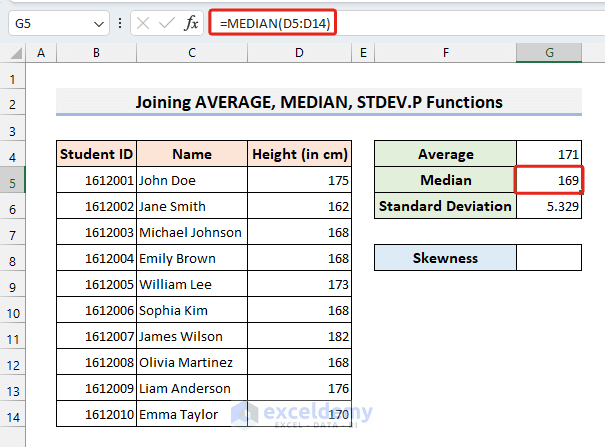
- Now, to calculate Pearson’s Coefficient of Skewness(Median), we use the following formula.
=3*(G4-G5)/G6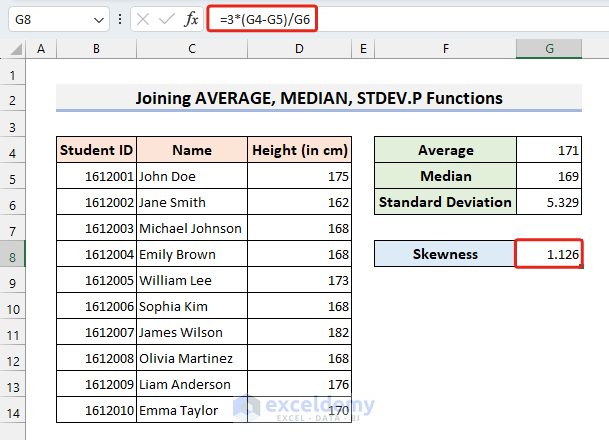
3. Apply VBA Custom Function
Here, in this example, we will write a VBA code to create a custom user-defined function for calculating Pearson’s Coefficient of Skewness. To write VBA code, open the VBA Application for Windows by clicking Alt+F11. Now, insert the following VBA code in a new Module.
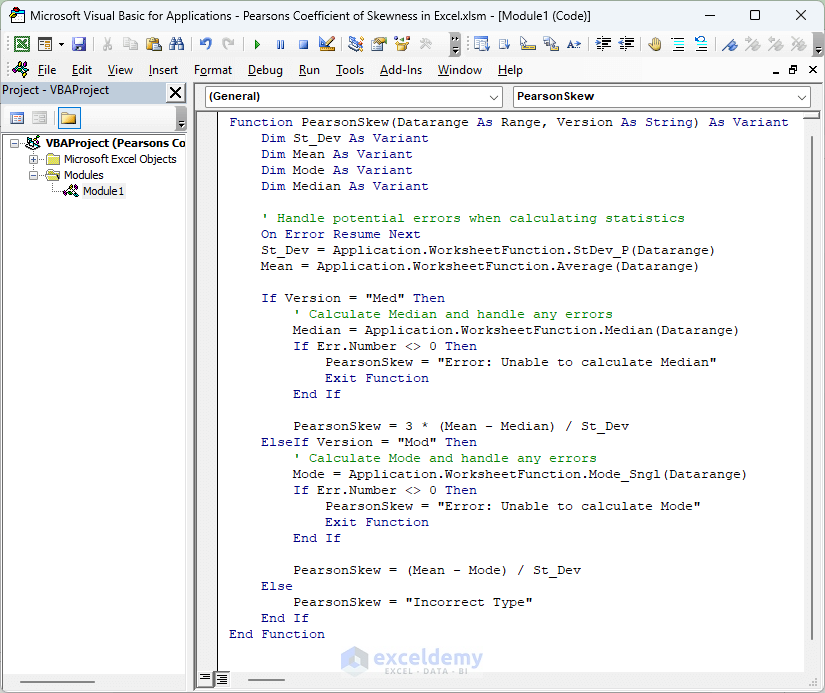
Function PearsonSkew(Datarange As Range, Version As String) As Variant
    Dim St_Dev As Variant
    Dim Mean As Variant
    Dim Mode As Variant
    Dim Median As Variant

    ' Handle potential errors when calculating statistics
    On Error Resume Next
    St_Dev = Application.WorksheetFunction.StDev_P(Datarange)
    Mean = Application.WorksheetFunction.Average(Datarange)

    If Version = "Med" Then
        ' Calculate Median and handle any errors
        Median = Application.WorksheetFunction.Median(Datarange)
        If Err.Number <> 0 Then
            PearsonSkew = "Error: Unable to calculate Median"
            Exit Function
        End If

        PearsonSkew = 3 * (Mean - Median) / St_Dev
    ElseIf Version = "Mod" Then
        ' Calculate Mode and handle any errors
        Mode = Application.WorksheetFunction.Mode_Sngl(Datarange)
        If Err.Number <> 0 Then
            PearsonSkew = "Error: Unable to calculate Mode"
            Exit Function
        End If

        PearsonSkew = (Mean - Mode) / St_Dev
    Else
        PearsonSkew = "Incorrect Type"
    End If
End Function- In this VBA code, I created a new user-defined function named PearsonSkew. It takes 2 arguments. The first argument, Datarange, takes the range of the dataset. The 2nd argument, Version, takes a string type value. If you give “Mod” in the 2nd argument, the PearsonSkew function will calculate Pearson’s Coefficient of Skewness(Mode). On the other hand, if you give “Med” in the 2nd argument, then it will calculate Pearson’s Coefficient of Skewness(Median) version.
- Now, we apply the new Custom function, PearsonSkew, to calculate Pearson’s Coefficient of Skewness(Mode).
=PearsonSkew(D5:D14,"Mod")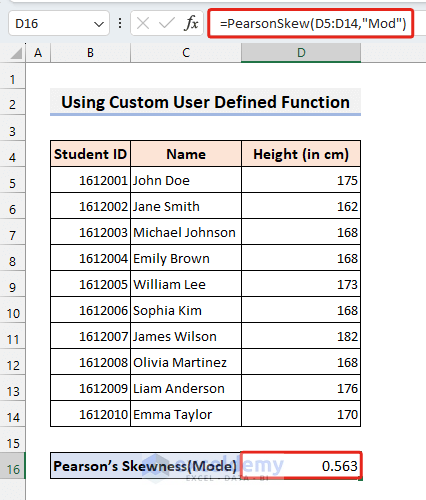
For finding Pearson’s Coefficient of Skewness(Median), we use the following formula.
=PearsonSkew(D5:D14,"Med")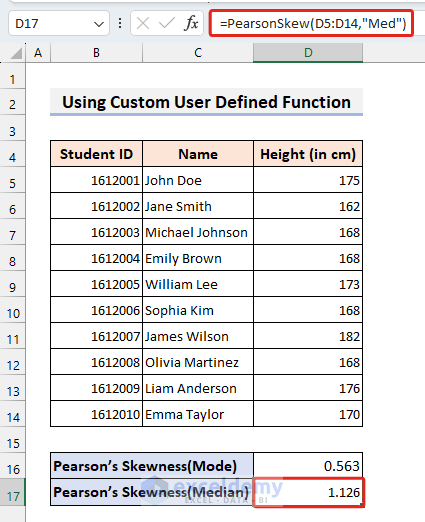
In this way, we can easily determine the two versions of Pearson’s Coefficient of Skewness using the PearsonSkew function.
Things to Remember
- Sometimes no Mode value is found in Dataset. On that occasion, we can not determine Pearson’s Coefficient of Skewness(Mode). Hence, we can only calculate Pearson’s Coefficient of Skewness(Median).
- In the Custom function PearsonSkew, we must write the 2nd argument inside the quotation.
Frequently Asked Questions
1. How do you find the Pearson coefficient of skewness?
You can find the Pearson coefficient of skewness using our custom functions (shown in Example 3) or using multiple functions (shown in Examples 1 & 2)
2. What does skewness value in Excel mean?
The skewness value quantifies the degree to which a distribution deviates from being perfectly symmetric. The skewness value of 0 means the data points are distributed completely symmetrically around the center point (Mode/Median). A positive skewness value means that the data points are more spread on the higher/positive/right side from the center point. A negative skewness value means that the data points are more spread on the lower/negative/left side from the center point.
Conclusion
In this article, I tried to give a brief introduction to the coefficient of skewness and showed some effective ways of calculating the Pearson coefficient of skewness in Excel. If you find this article helpful, please share it with your friends. Moreover, do let us know if you have any queries in the comment section. Goodbye!
Get FREE Advanced Excel Exercises with Solutions!
