Linear programming is used to determine the optimal value that satisfies all the constraints and conditions specified by the problems. The Excel Solver can find the solutions to Linear Programming problems.
Consider the following business problem:
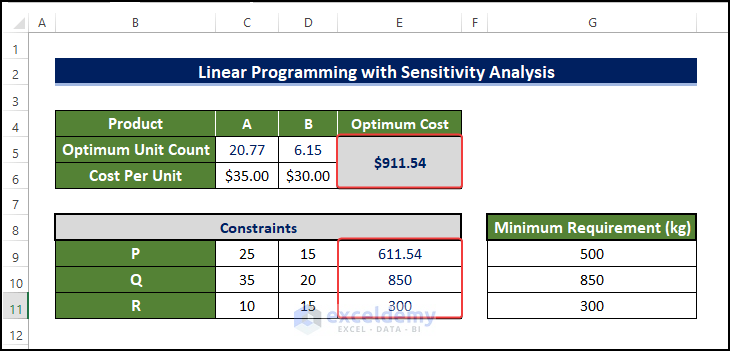
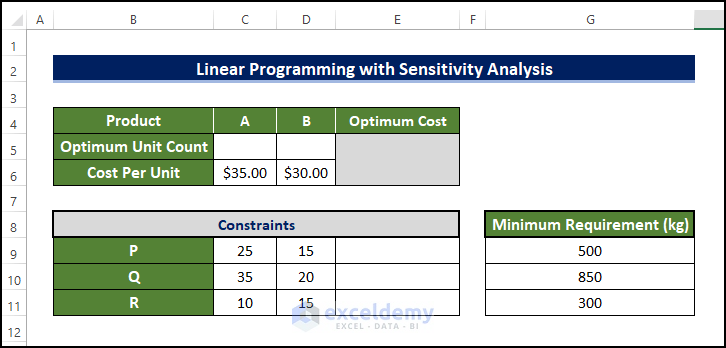
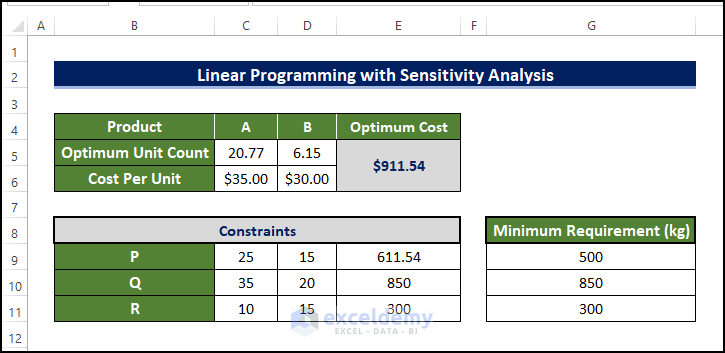
A manufacturer has two kinds of products, ‘A’ & ‘B’. A unit of product A requires three raw materials, P 25 kg, Q 35 kg, and R 10 kg. Product B requires P 15 kg, Q 20 kg, and R 15 kg. The Manufacturer needs a minimum of P 500 kg, Q 850 kg, and R 300 kg. If A costs $35 per unit and B costs $30 per unit, how many units of each product should the manufacturer blend to meet the minimum raw material requirements at the lowest possible, and what is the price?
STEP 1 – Enable the Solver in Excel
- Go to File ➤ Options.
- Select Add-ins.
- Choose Excel Add-ins in Manage.
- Click Go.
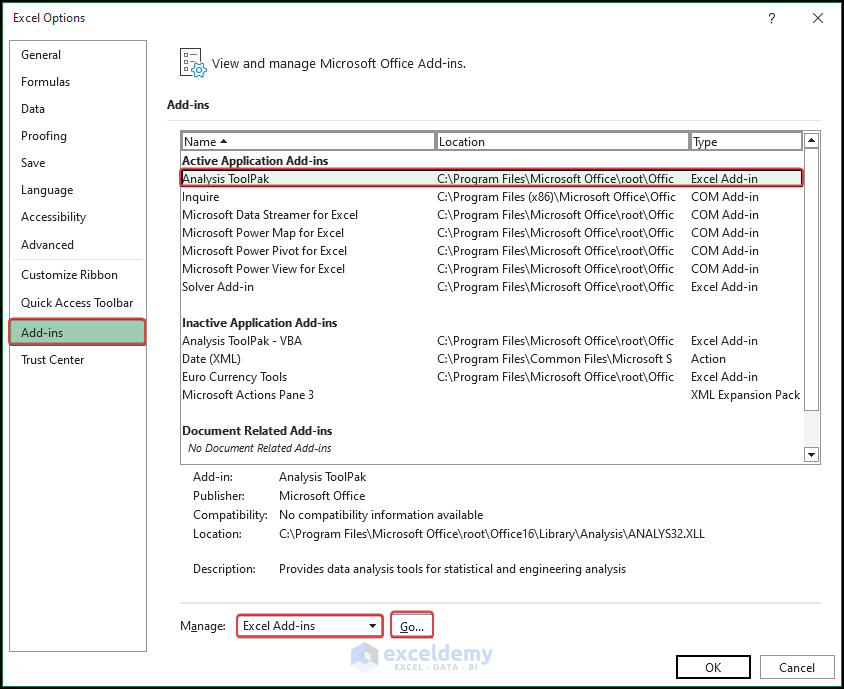
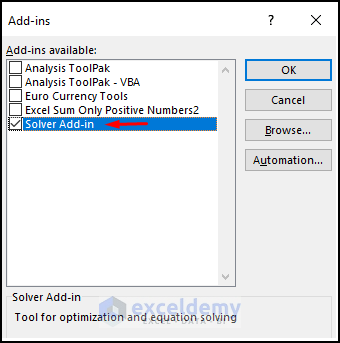
- In the Add-ins dialog box, check Solver Add-in.
- Click OK.
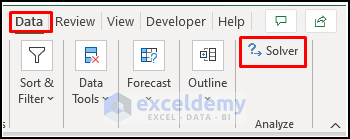
The Solver program is displayed in Analyze in the Data tab.
Read More: How to Use Excel Solver for Linear Programming
STEP 2 – Enter the Constraints
You’ll blend x units of product A and y units of B. The total cost will be $35x + $30y. This is the objective function and you want to minimize this cost. At the same time, you have to meet the requirements: 25x + 15y >= 500, 35x + 20y >= 850, 10x+15y >= 300, x >= 0 and y >= 0 are the constraints:
- Enter the costs per-unit of A and B.
- Enter the materials.
- Enter the minimum required amounts.
STEP 3 -Create an Excel Formula
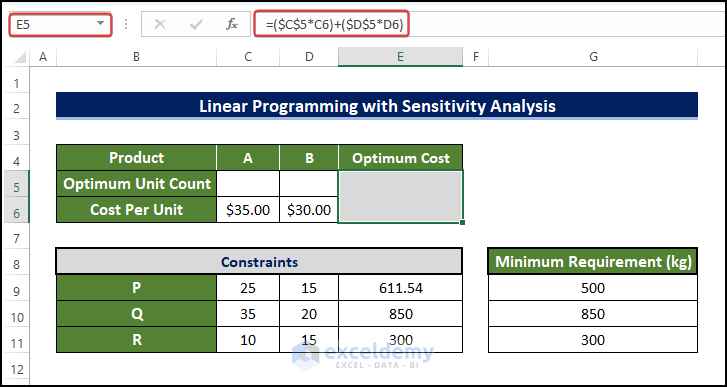
- Enter the value of x in C5 and y in D5.
- Select E6 and enter the formula:
=($C$5*C6)+($D$5*D6)
- Press Enter.
- It’ll return 0 or blank as C5 and D5 are empty.
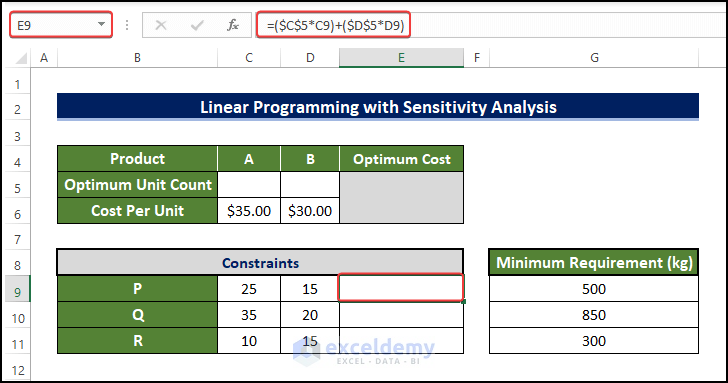
- Select E9 and enter the formula:
=($C$5*C9)+($D$5*D9)
- Press Enter to see the values.
- Drag down the Fill Handle to see the result in the rest of the cells.
- The results are 0, as C5 and D5 are empty.
STEP 4 -Solve Linear Programming with Sensitivity Report
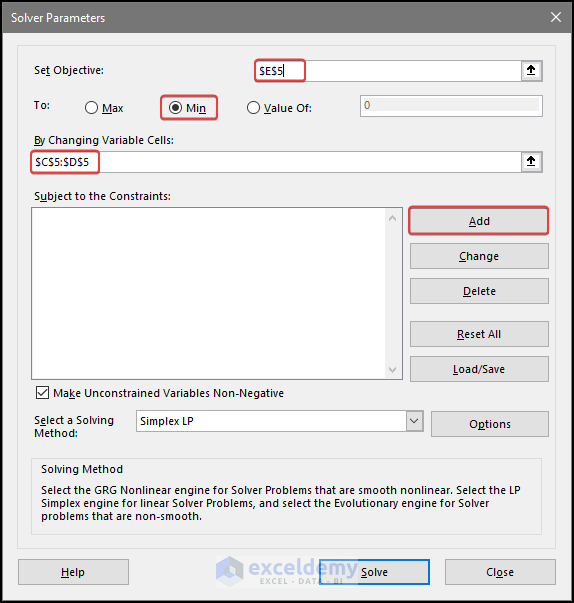
- Select Solver in the Data tab.
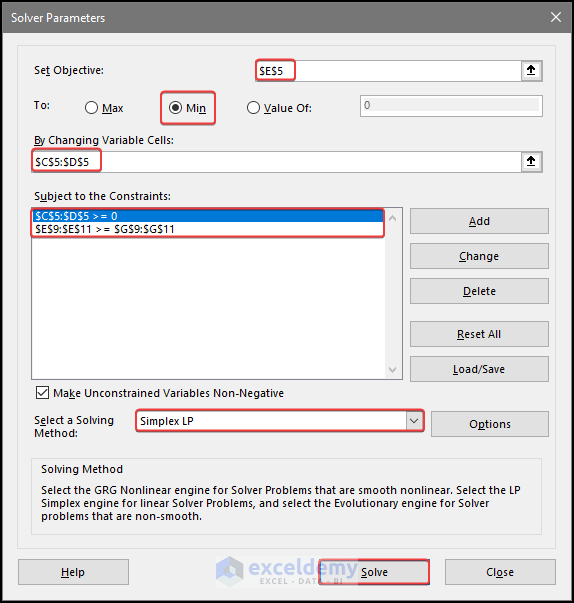
- In the Solver Parameters dialog box, choose E6 in Set Objective.
- Select Min.
- Select C5:D5 as variable cells.
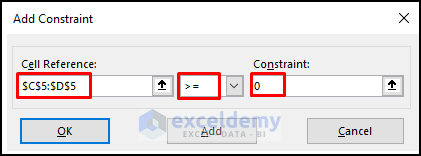
- Click Add to add the constraints.
- In the Add Constraint dialog box, choose C5:D5.
- Select >= (greater than or equal to).
- Enter 0 in Constraint:.
- Click Add.
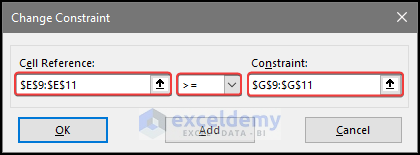
- Choose E9:E11 as the minimum requirement constraints.
- Select >= .
- Select G9:G11 in Constraint:.
- Click OK.
- You’ll see the constraints.
- Click Solve.
- In the dialog box, select Keep Solver Solution.
- Select Sensitivity in Reports.
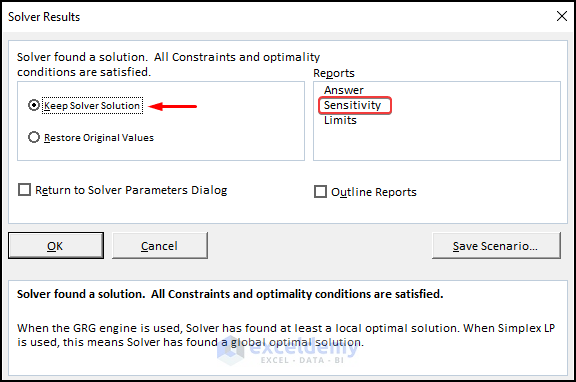
- Click OK.
This is the output.
Read More: How to Find Optimal Solution in Linear Programming Excel
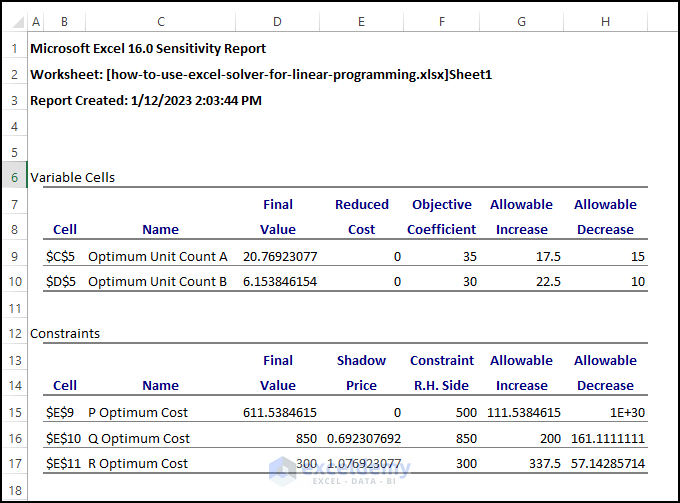
Interpreting the Sensitivity Analysis in Excel
A Sensitivity analysis report shows how variables can be changed or altered and to what extent.
Here, allowable increases and decreases show how the optimal value outcome can be altered and still remain optimal.
Download Practice Workbook
Download the following workbook.
Related Articles
- How to Calculate Shadow Price Linear Programming in Excel
- Perform Mixed Integer Linear Programming in Excel
- How to Graph Linear Programming in Excel
- How to Do Linear Programming in Excel
- How to Solve Integer Linear Programming in Excel
- How to Solve Blending Linear Programming Problem with Excel Solver
<< Go Back to Excel Linear Programming | Solver in Excel | Learn Excel
Get FREE Advanced Excel Exercises with Solutions!
