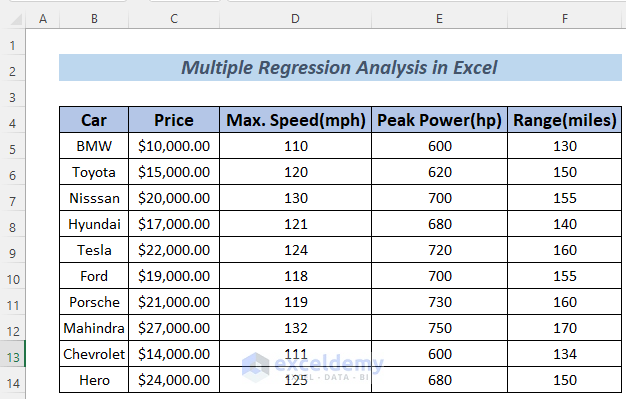
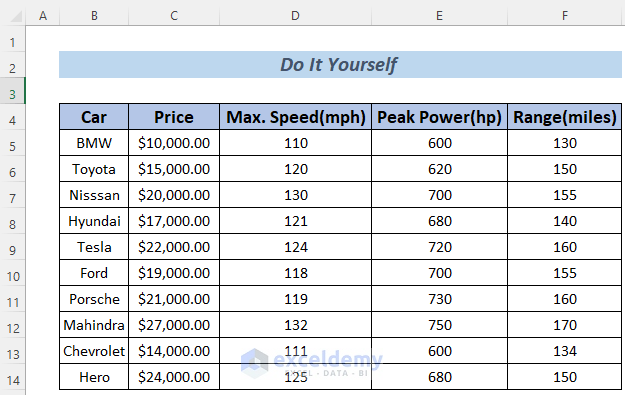
In the dataset, we have some information about some cars: their names, prices, maximum speeds in miles per hour, the peak power their engine can produce, and the maximum range of distance they can travel without refilling their tank.
What Is Multiple Regression?
Multiple regression is a statistical technique used to analyze the relationship between a dependent variable and multiple independent variables. Its primary purpose is to predict the behavior of the dependent variable based on the corresponding independent variables.
In other words, multiple regression helps us understand how changes in one or more independent variables impact the outcome of the dependent variable. By examining these relationships, we can make predictions and gain insights into complex data patterns.
Remember that multiple regression assumes a linear relationship between the variables, and it plays a crucial role in various fields such as economics, social sciences, and business analytics.
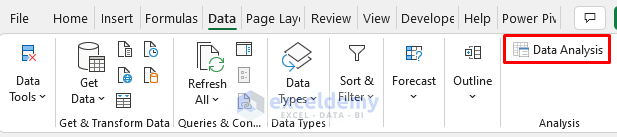
Step 1: Enable the Data Analysis Tab
By default, the Data tab in Excel does not include the Data Analysis ribbon. To activate it, follow these steps:
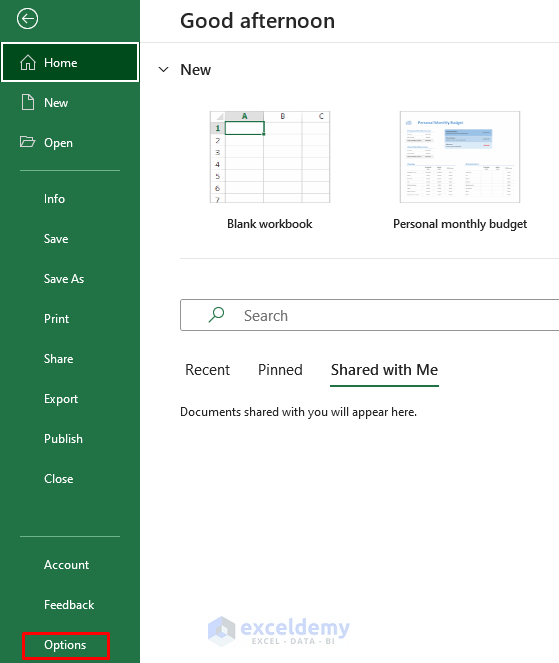
- Go to File > Options.
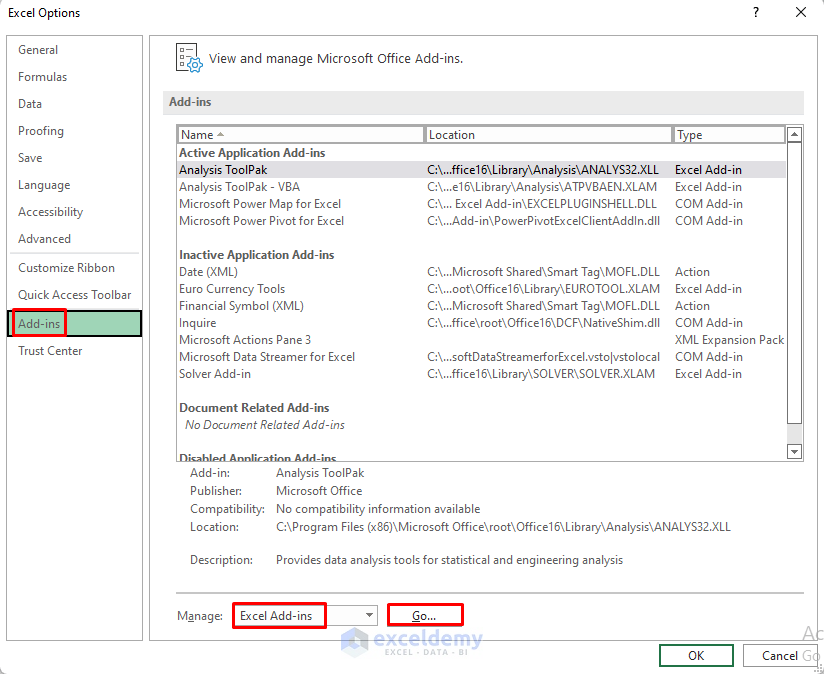
- Select Add-ins.
- Click on Excel Add-ins and then click Go.
- In the Add-ins available: section, check Analysis ToolPak.
- Click OK.
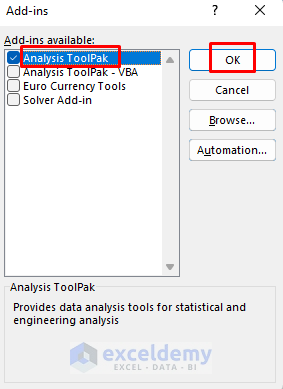
Once you’ve done this, the Data Analysis feature will appear in the Data tab.
Step 2: Creating the Multiple Regression Analysis in Excel
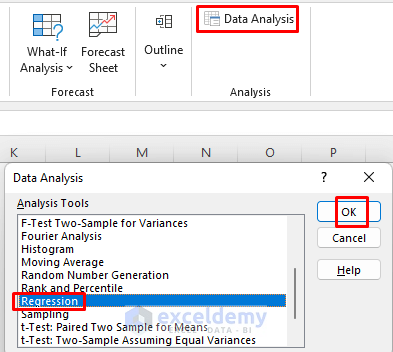
- Access the Data Analysis Feature:
- Go to the Data tab in Excel.
- Select the Data Analysis feature.
- Regression Dialog Box:
- A dialog box will appear. Choose Regression and click OK.
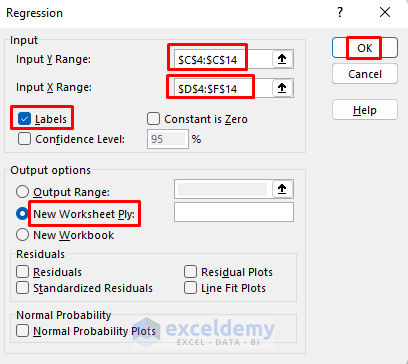
- Define Variables:
- In the Regression dialog box, we’ll predict car prices based on their maximum speed, peak power, and range.
- Specify the range of dependent variables (Input Y Range). In your case, this would be cells C4:C14 (containing car prices).
- Next, select the range of independent variables (Input X Range). For your dataset, this would be cells D4:F14 (containing maximum speed, peak power, and range).
- Output Options:
- Check the Labels box.
- Choose New Worksheet Ply in the Output Options. If you prefer the analysis in the current sheet, specify a cell reference for the Output Range.
- Optionally, select Residuals if you want to perform further analysis.
- View the Regression Analysis:
- After completing the steps, you’ll see the regression analysis in a new sheet.
- Format the analysis according to your preference.
Now you have successfully performed multiple regression analysis in Excel! Feel free to explore the insights from your data.
A Brief Discussion about Multiple Regression Analysis in Excel
When conducting regression analysis, various parameters yield important insights. Let’s delve into what each of these signifies.
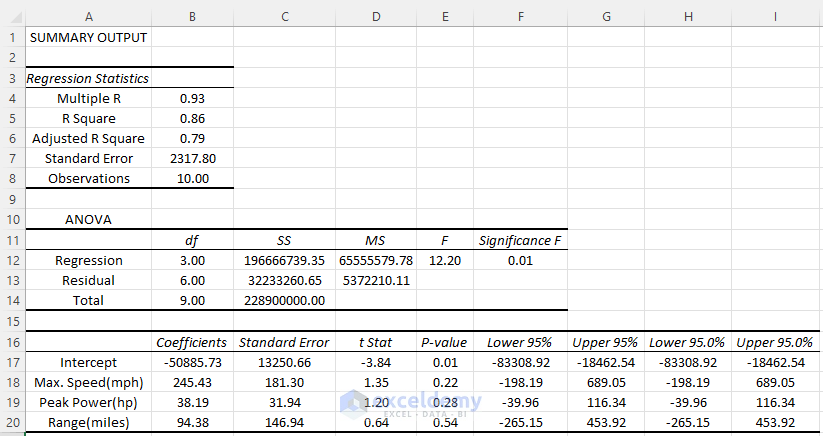
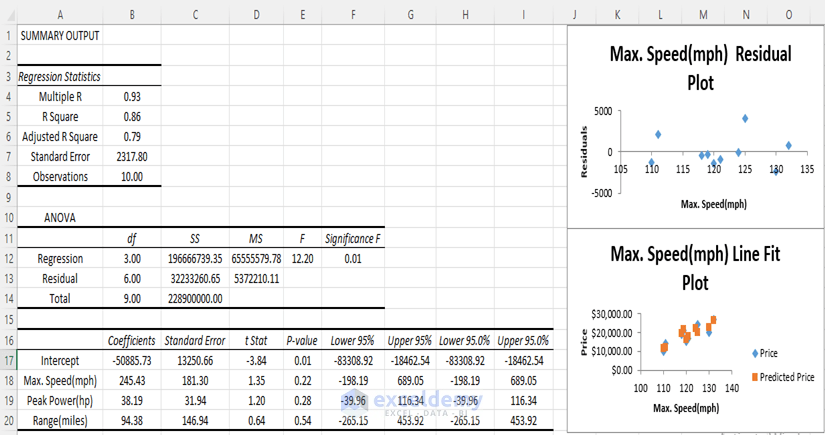
Regression Statistics
In this section, we encounter values for several parameters:
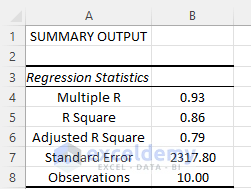
- Multiple R: This refers to the Correlation Coefficient that determines how strong the linear relationship among the variables is. The range of values for this coefficient is (-1, 1). The strength of the relationship is proportionate to the absolute value of Multiple R.
- R Square: It is another Coefficient to determine how well the regression line will fit. It also shows how many points fall on the regression line. In this example, the value of R2 is 86, which is good. It implies that 86% of the data will fit the multiple regression line.
- Adjusted R Square: This is the adjusted R squared value for the independent variables in the model. It is suitable for multiple regression analysis and so for our data. Here, the value of Adjusted R Square is 79.
- Standard Error: This determines how perfect your regression equation will be. As we are doing a random regression analysis, the value of Standard Error here is pretty high.
- Observations: The number of observations in the dataset is 10.
Analysis of Variance (ANOVA)
In the ANOVA analysis section, we also see some other parameters.
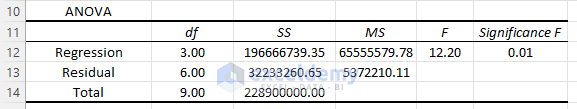
- df: The ‘degrees of freedom’ is defined by df. The value of df here is 3 because we have 3 types of independent variables.
- SS: SS refers to the sum of squares. If the Residual Sum of the Square is much smaller than the Total Sum of Square, your data will fit in the regression line more conveniently. Here, the Residual SS is much smaller than Total SS, so we can surmise that our data may fit in the regression line in a better way
- MS: MS is the mean square. The value of Regression and Residual MS is 78 and 5372210.11 respectively.
- F and Significance F: These values determine the reliability of the regression analysis. If the Significance F is less than 05, the multiple regression analysis is suitable to use. Otherwise, you may need to change your independent variable. In our dataset, the value of Significance F is 0.01 which is good for analysis.
Regression Analysis Output
Here, I will discuss the output of Regression Analysis.
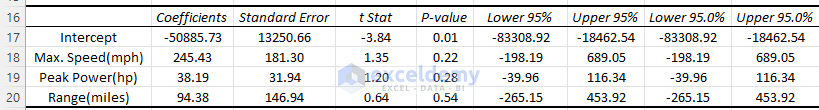
1. Coefficients and Others
In this section, we get the value of coefficients for the independent variables- Max. Speed, Peak Power and Range. We can also find the following information for each coefficient: its Standard Error, t Stat, P-value and other parameters.
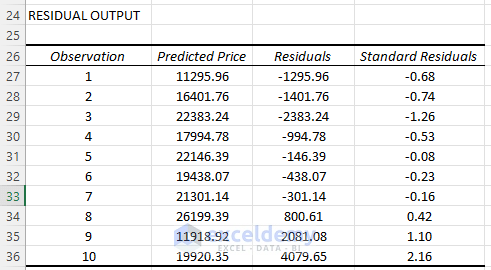
2. Residual Output
The Residual Values help us to understand how much the predicted price deviates from its actual value and the standard value of residuals that would be acceptable.
3. Prediction by Regression Analysis:
The way the prediction by regression analysis works is given below.
Say, we want to predict the price of the first car according to its independent variables. The independent variables are the Max. Speed, Peak Power and Range whose values are 110 miles per hour, 600 horsepower and 130 miles, respectively. The corresponding regression coefficients are 245.43, 38.19 and 94.38. The y intercept value is -50885.73. So the predicted price will be 245.43*110+38.19*600+94.38*130-50885.73≈11295.
According to the dataset of this article, if you want to predict a car’s price which has a maximum speed of x mph, peak power of y hp and range of z miles, the predicted price will be 245.43*x+38.19*y+94.38*z.
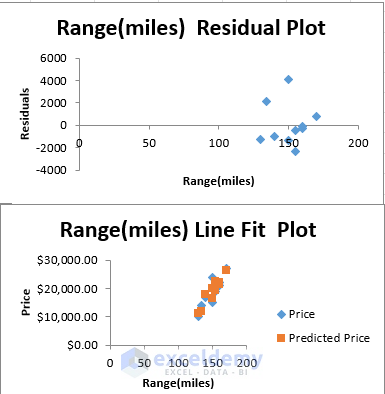
Using a Graph to Understand Multiple Linear Regression in Excel
If you want to visualize the regression line of your data, let’s go through the procedure below to learn about multiple linear regression.
Steps:
- Access Data Analysis:
- Go to the Data tab in Excel.
- Click on the Data Analysis feature.
- Regression Dialog Box:
- A dialog box will appear. Select Regression and click OK.
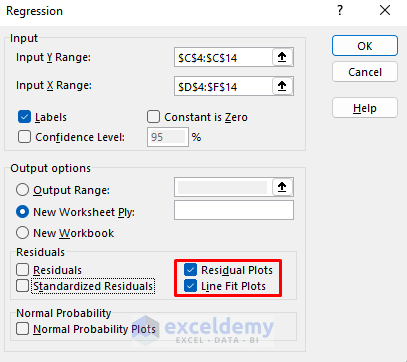
- Choose Visualization Options:
- In the next dialog box, select Residual and Line Fit Plots.
- Click OK.
- View the Graphs:
-
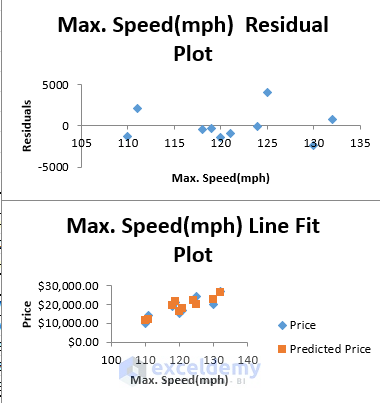
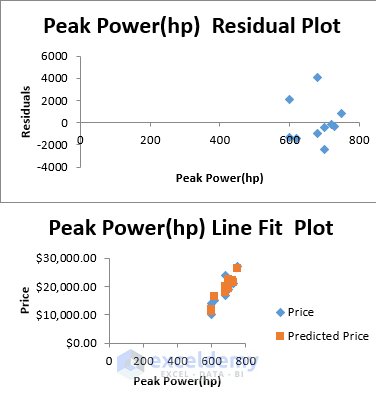
- After completing the steps, a new sheet will display the graph of the regression line fits based on the variables: Max. Speed, Peak Power, and Range.
-
- You’ll see separate plots for each variable.
Read More: How to Do Linear Regression in Excel
Practice Section
Here is the dataset of this article to enable you to analyze multiple linear regression on your own.
Download Practice Workbook
You can download the practice workbook from here:
Related Articles
- How to Calculate P Value in Linear Regression in Excel
- Interpret Linear Regression Results in Excel
- How to Do Logistic Regression in Excel
- How to Interpret Regression Results in Excel
- How to Plot Least Squares Regression Line in Excel
- How to Do Simple Linear Regression in Excel
- How to Interpret Multiple Regression Results in Excel
<< Go Back to Regression Analysis in Excel | Excel for Statistics | Learn Excel
Get FREE Advanced Excel Exercises with Solutions!
