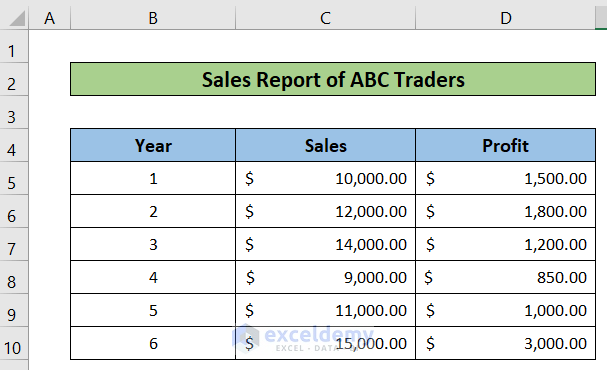
This is our sample dataset.
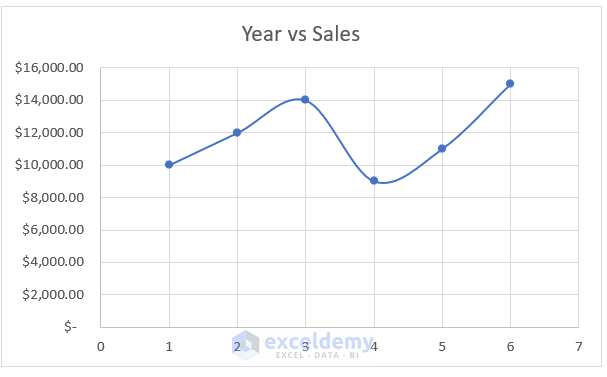
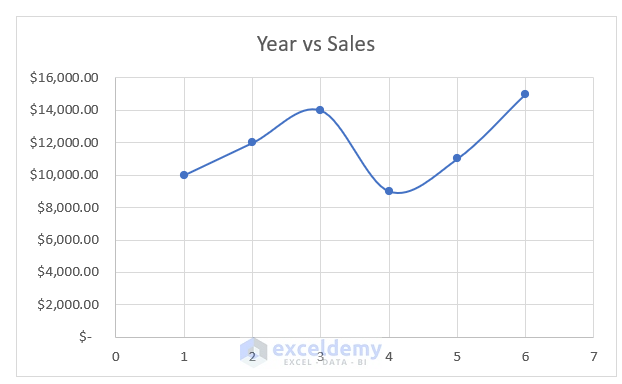
The image below shows Year vs Sales curve generated from the dataset.
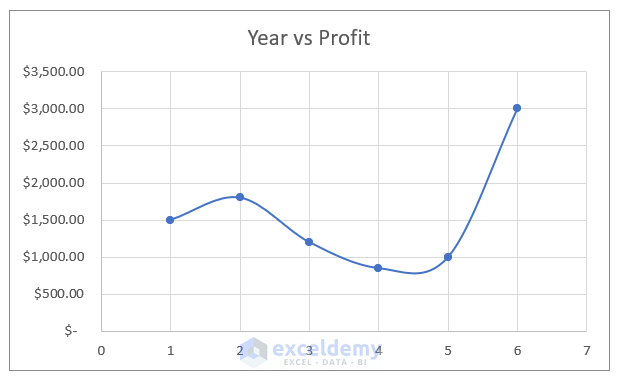
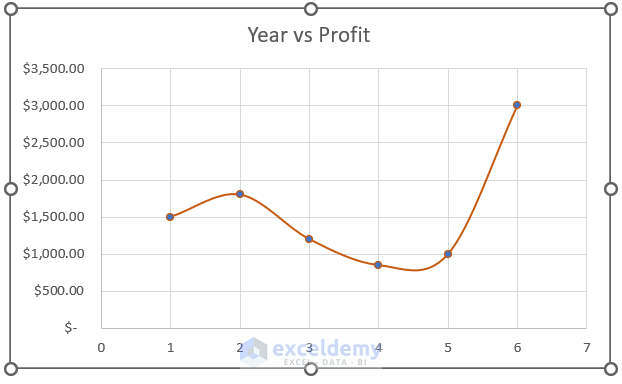
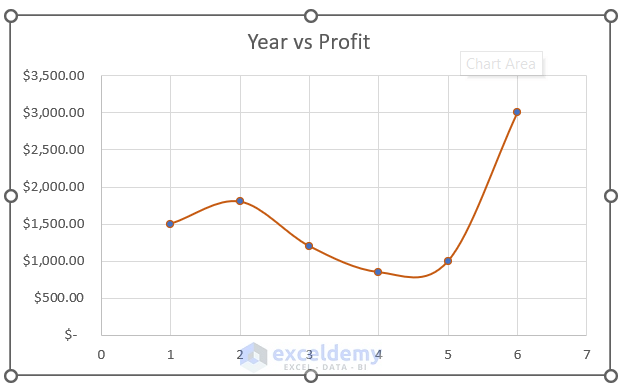
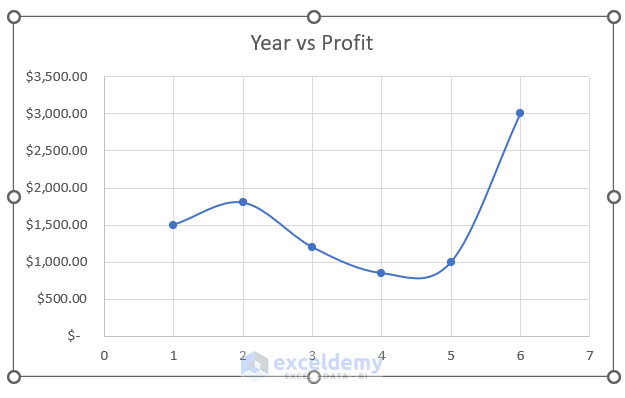
The next image is the Year vs Profit curve generated from the dataset. 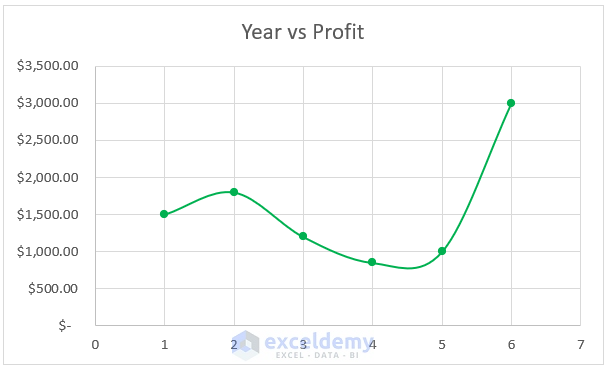
The format of both of the curves are different. We need to convert the charts in the same format.
Method 1 – Introducing Paste Special Option to Copy Chart Format in Excel
Steps:
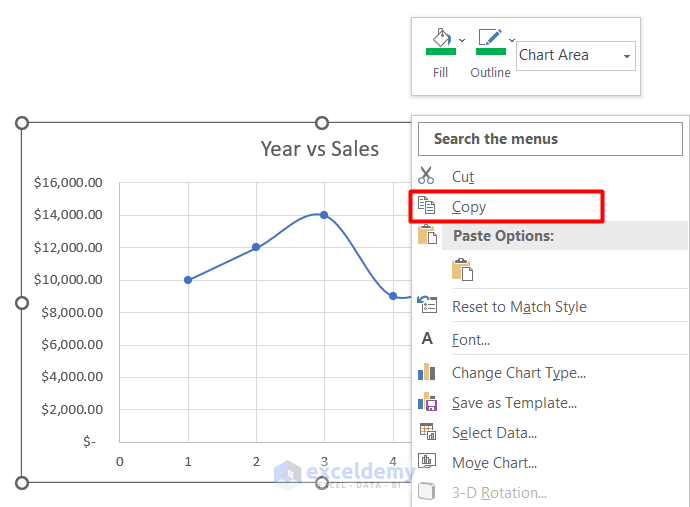
- Select the chart by clicking on it.
- Right-click and Copy.
- Select the curve to be formatted.
- Go to the Home tab of the toolbar.
- Select the paste option.
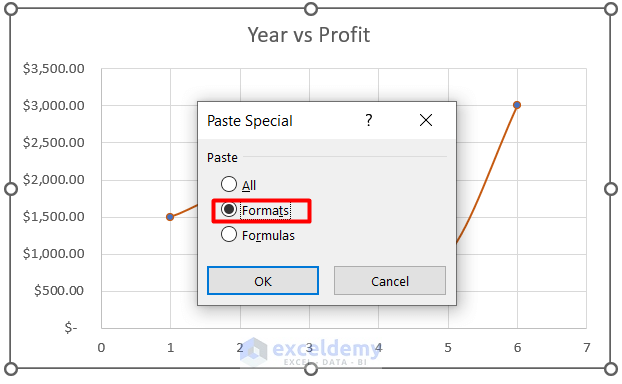
- Select Paste Special.
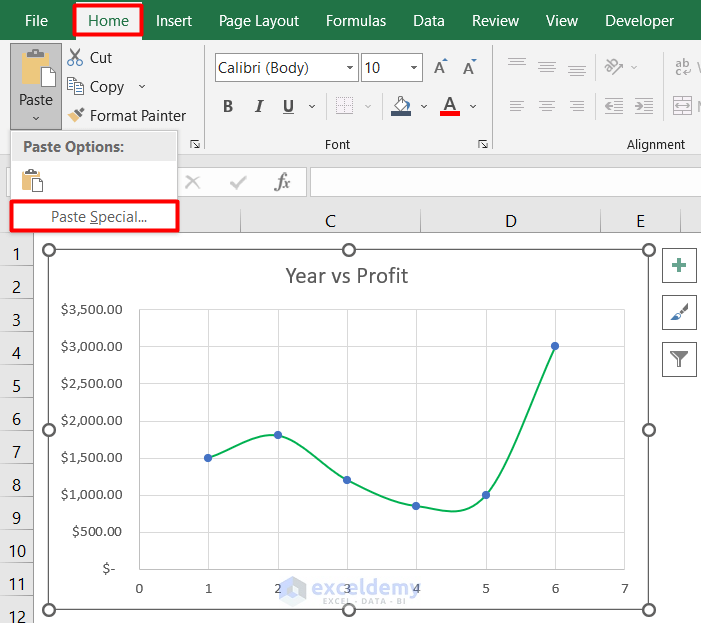
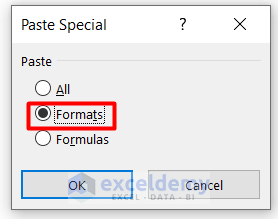
- A window will pop up, select the Formats option.
- Press OK.
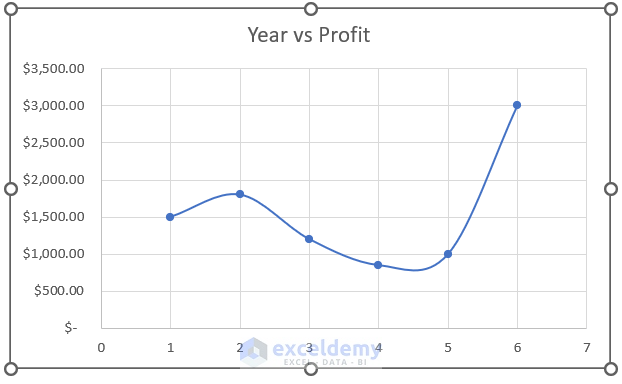
- You will get the formatted curve as shown below.
Method 2 – Copying Chart Format in Excel by Using the Keyboard Shortcut
In the images below, you can see two curves without the same format. We will use these two curves to copy the chart format in Excel.
Steps:
- Select the following curve and copy the curve using Ctrl + C.
- Select the following curve to change the format.
- Press the Alt + E + S.
- A Paste Special window will pop up.
- Select Formats.
- Result will be as shown in the image below.
Read More: How to Duplicate Chart with Different Data in Excel
Method 3 – Creating a Template to Copy Chart Format in Excel
Steps:
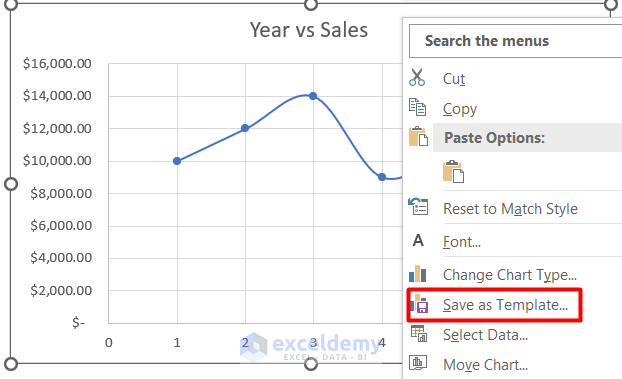
- Select the chart first.
- Right-click on the mouse.
- A window will pop up.
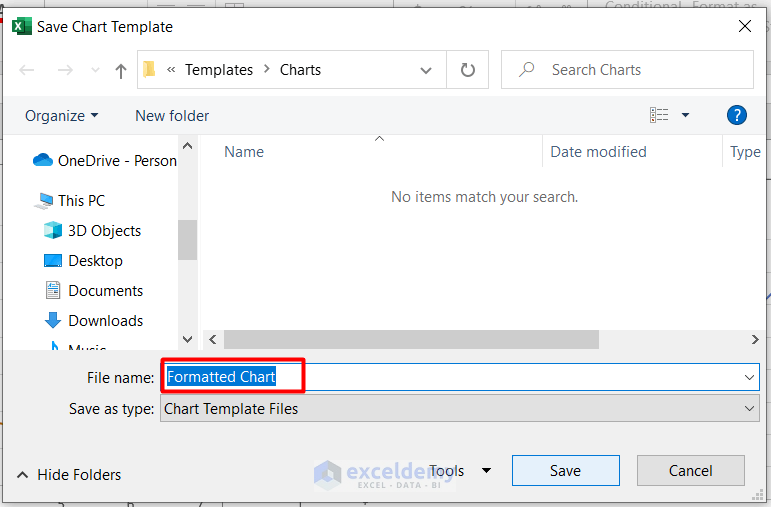
- Select the Save as Template.
- Enter any name in the File Name option.
- Press Save.
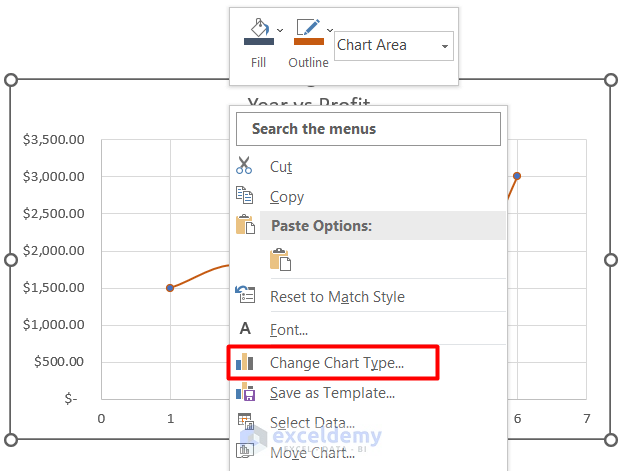
- Select the Year vs Profit chart.
- Right-click and select the Change Chart Type….
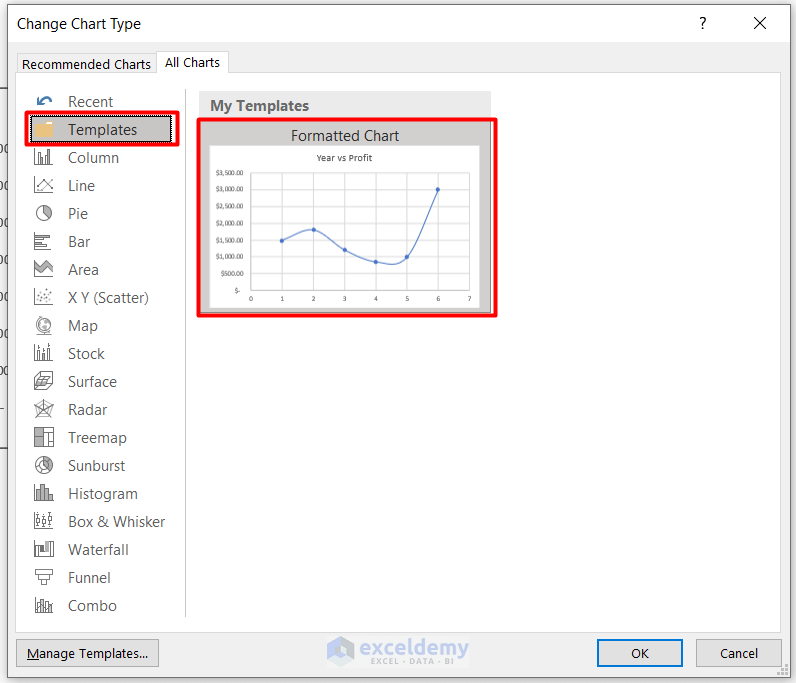
- Select the Templates option option.
- Select Formatted Chart.
- Press OK.
- Result will be as shown in the image below.
Download Practice Workbook
Please download the workbook to practice yourself.
Related Articles
- How to Copy Chart in Excel Without Linking Data
- How to Copy Chart Without Source Data and Retain Formatting in Excel
<< Go Back To Copy Chart in Excel | Excel Charts | Learn Excel
Get FREE Advanced Excel Exercises with Solutions!
