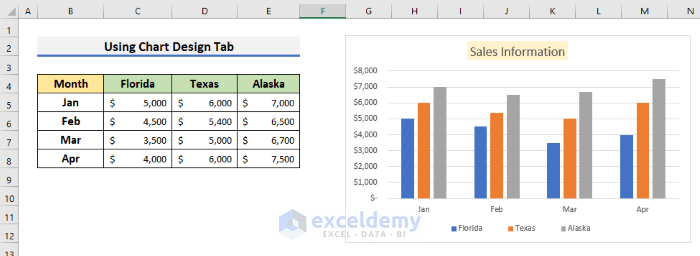
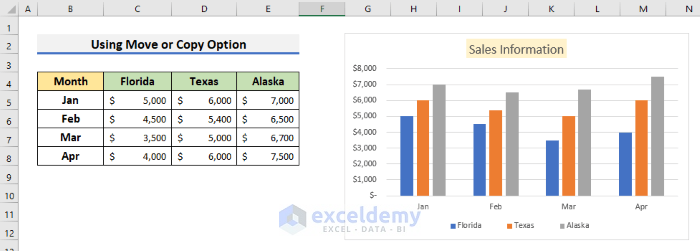
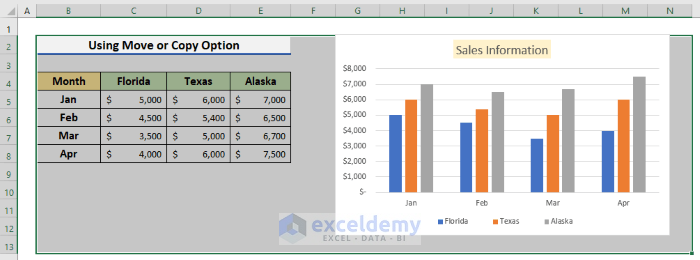
In our sample dataset, we have information about a company’s sales in three US states in four consecutive months (January, February, March, and April) and a chart that represents this information. We want to duplicate the chart for a second, similar dataset, but simply copying and pasting the dataset does not allow us to modify the chart accordingly. Rather, it preserves the shape of the original dataset. Let’s duplicate the chart with the new dataset using 2 different methods.
Method 1 – Using the Chart Design Tab
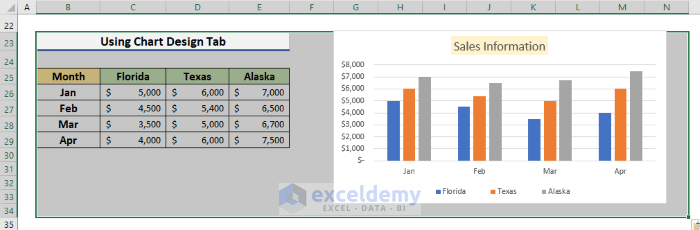
We can select which data is represented in a chart from the Chart Design tab.
Steps:
First we prepare the dataset.
- Insert the data in an Excel sheet and make a chart. Here, we use the range B4:E8 to insert the sales information.
- Create a sales information chart of the data using the Insert tab.
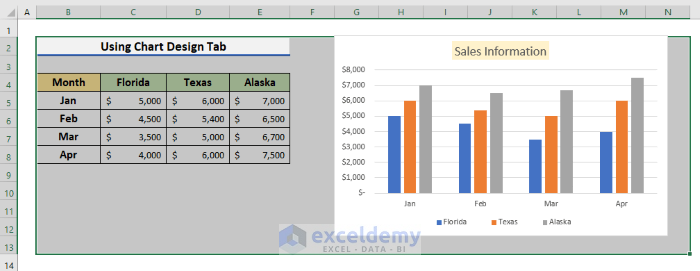
- Select the range that covers the dataset and the chart. Here, cells B2:N13, as these cells contain our data.
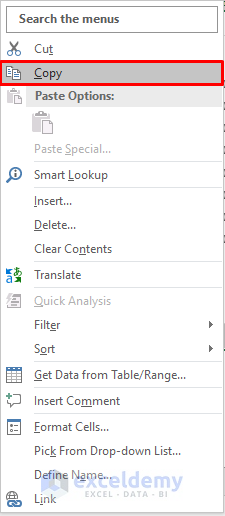
- Press CTRL+C to copy the range. Or, right-click on your mouse and click Copy from the context menu.
- Select a blank space in the same sheet to place the data and chart.
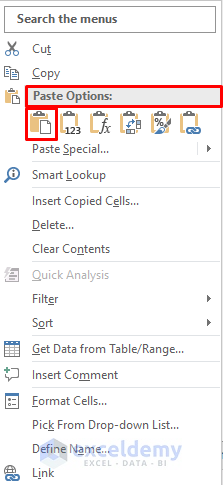
- Press CTRL+V to paste. Or, right-click on the mouse and select Paste from the context menu.
The copied data is inserted in the specified place, but the chart still represents the previous dataset.
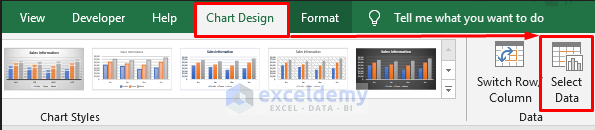
- Click on the chart.
- From the Chart Design tab in the ribbon, click on Select Data.
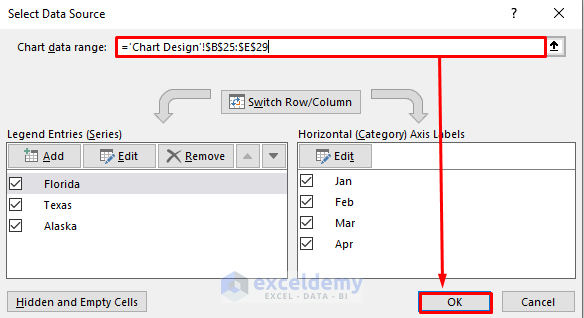
The Select Data Source window opens.
Here, Chart data range indicates which dataset is used to plot the chart.
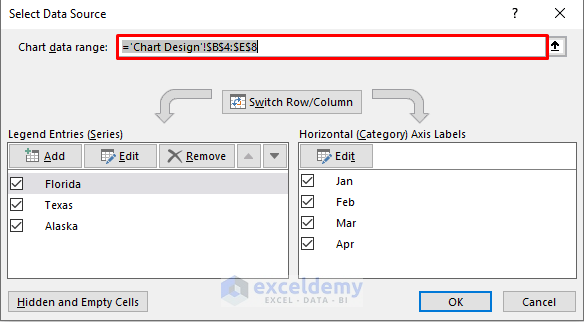
A broken dotted line can be seen on the sheet indicating the chart’s dataset. Let’s change it.
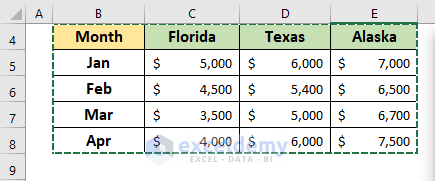
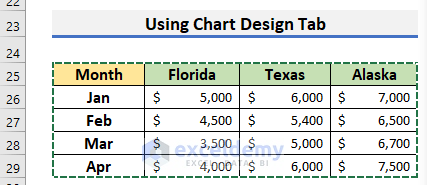
- Select the new dataset, namely the range B25:E29.
Automatically, the Chart data range will be changed to the new selection.
- Click OK.
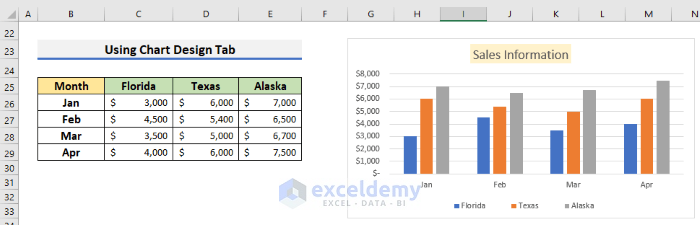
Our dataset and chart are ready.
- To check if the duplicated chart represents the second set of data, change the sales of Florida state in January from $5000 to $3000.
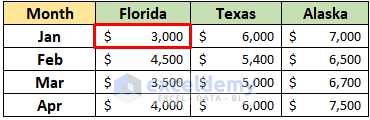
Automatically, the chart also shows the changed value of $3000 from $5000 in Florida in January.
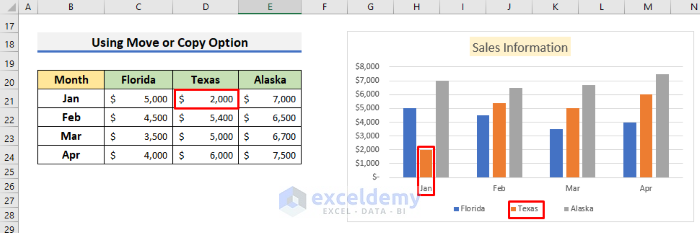
Method 2 – Using the Move or Copy Option
We can also duplicate the chart with different data on another sheet entirely.
Steps:
- Insert the original dataset in the range B4:E8.
- Create a Chart using the Insert tab.
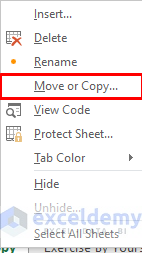
- Select the sheet and right-click on it.
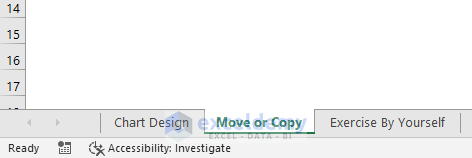
- Select Move or Copy from the Context Menu.
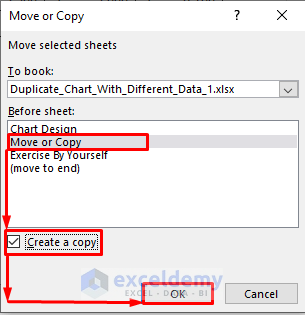
The Move or Copy dialog box will pop up.
- Select Move or Copy as we want the new sheet to be created before our main sheet.
- Click on Create a Copy.
- Click on OK.
- A new sheet will be created, a copied version of our dataset and Chart.
- Select the dataset and chart, namely the range B2:N13.
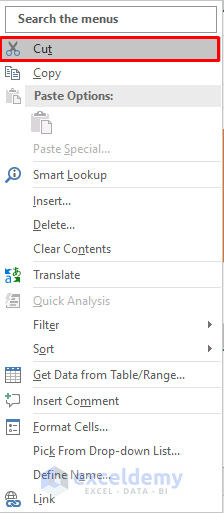
- Press CTRL + X to cut the range. Or, right-click the mouse and select Cut from the context menu.
- Below the original dataset, select a location to duplicate the information (here, cell B18).
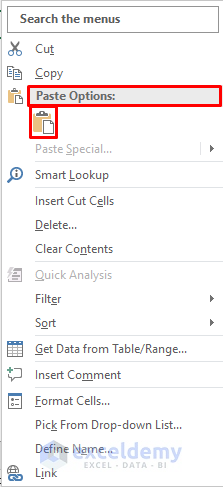
- Press CTRL + V. Or, right-click on the mouse and select “Paste” from the context menu.
Our desired dataset and chart are pasted in the specified location.
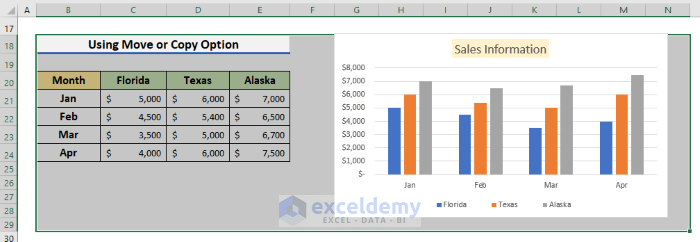
To check if the chart represents the new data, we can change a value in the duplicated dataset and see if the chart also changes.
- Change the sales of January month in Texas state from $6000 to $2000.
The chart also shows that January month’s Texas sales have changed from $6000 to $2000.
Read More: How to Copy Chart Without Source Data and Retain Formatting in Excel
Download Practice Workbook
Related Articles
<< Go Back To Copy Chart in Excel | Excel Charts | Learn Excel
Get FREE Advanced Excel Exercises with Solutions!
