Step 1: Forecasting Total Cash Inflows
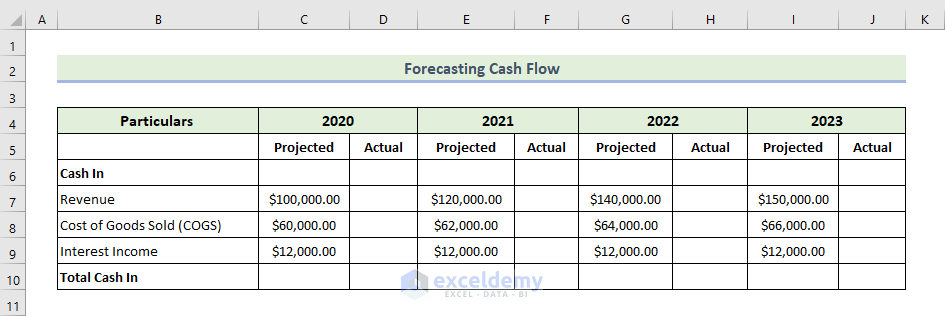
We will calculate each particular given’s value in the following dataset. There was a 20% understatement in revenues for the projected value in the following dataset.
- Enter the following formula to calculate the actual revenue in 2020:
=C7*1.2
- Press Enter.
You will get actual revenue value in 2020.
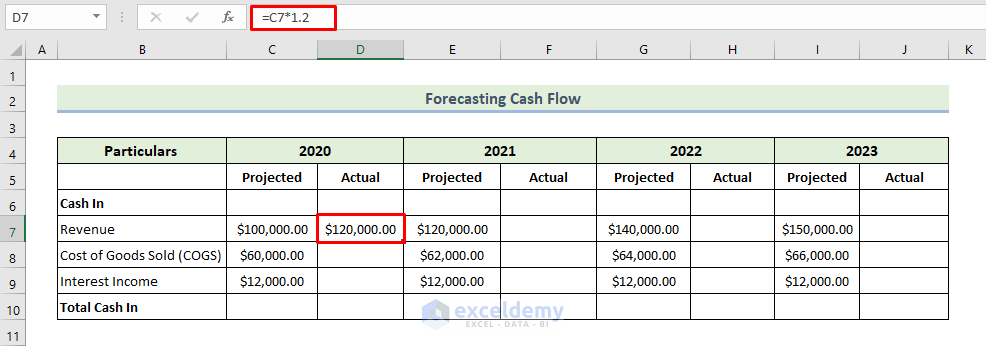
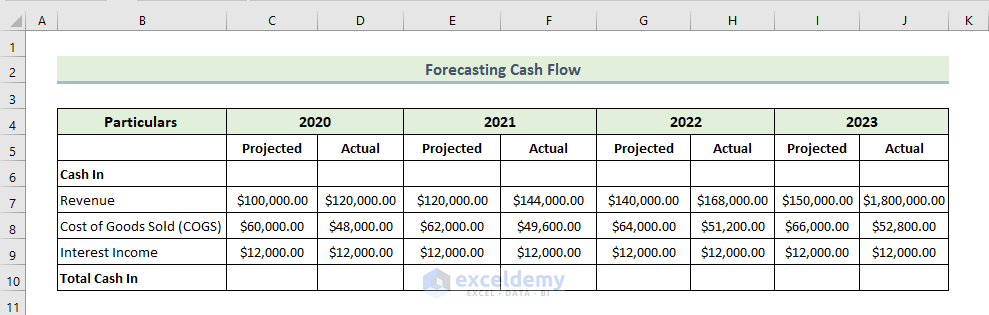
We will use a similar formula for other years. Consequently, we will get the following revenue row, as shown below. In this dataset, the costs of goods sold were overstated by 20% compared to the projected value.
- Enter the following formula to calculate the actual costs of goods sold in 2020:
=C8*0.8
- Press Enter.
You will get the actual costs of goods value in 2020.
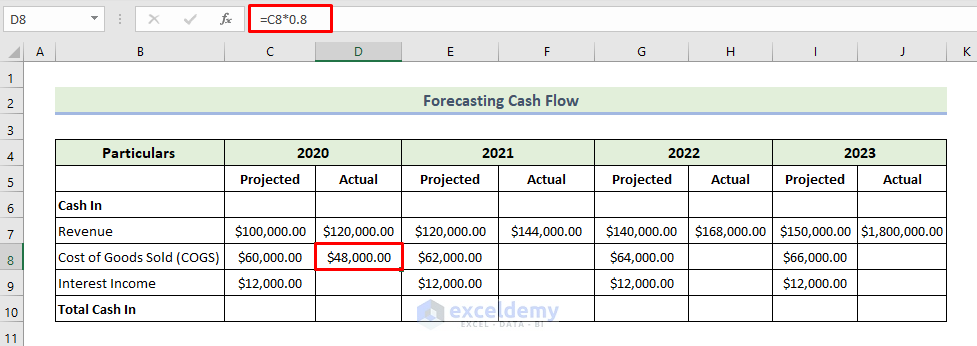
We will use a similar formula for other years. We will get the following costs of goods sold as shown below.
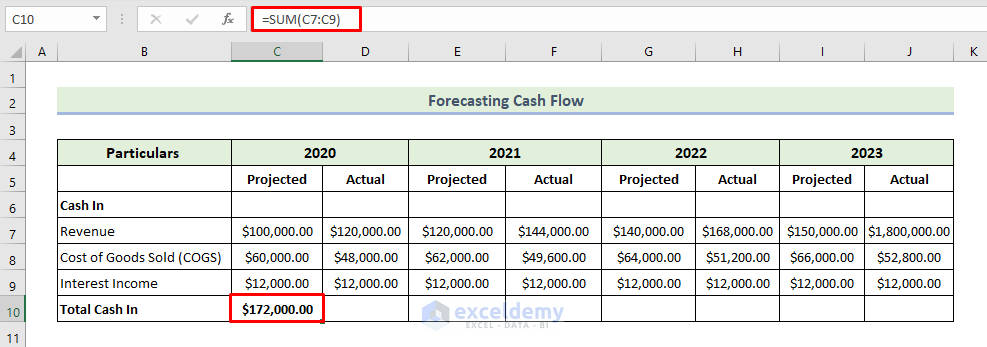
- Enter the following formula to calculate the total cash for 2020:
=SUM(C7:C9)
- Press Enter.
You will get the total cash in for 2020.
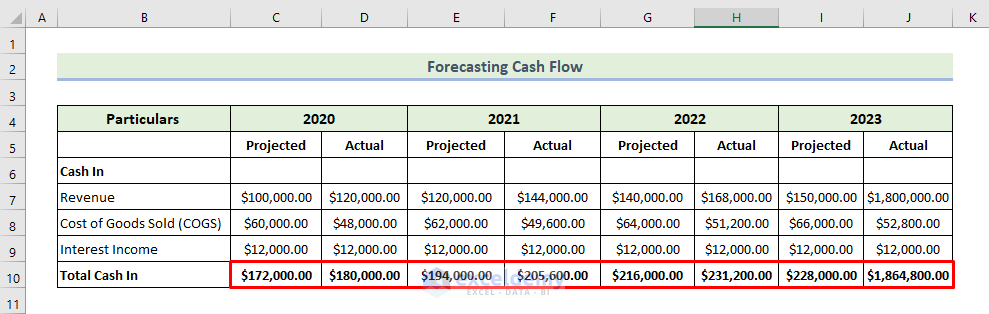
- Drag the Fill Handle icon to the right to fill other cells with the formula.
You will get the following total cash in a row.
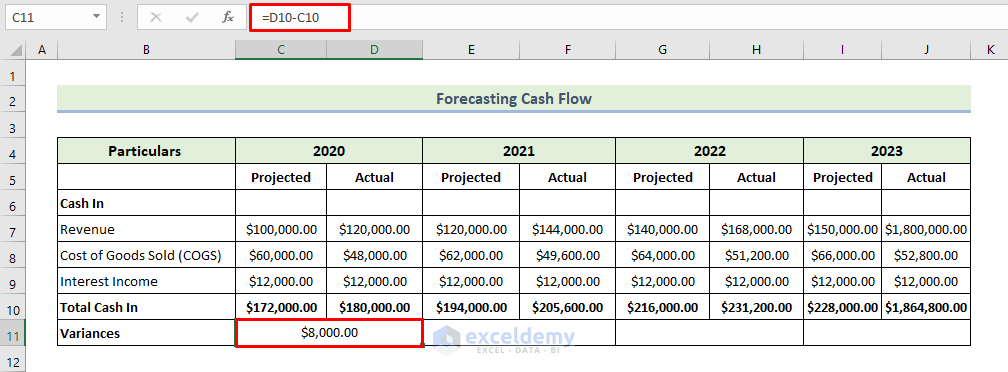
We will calculate the variance between each particular’s actual and projected values for each year.
- Enter the following formula to calculate the variance between each individual’s actual and projected values for 2020:
=D10-C10
- Press Enter.
You will get the variance for 2020.
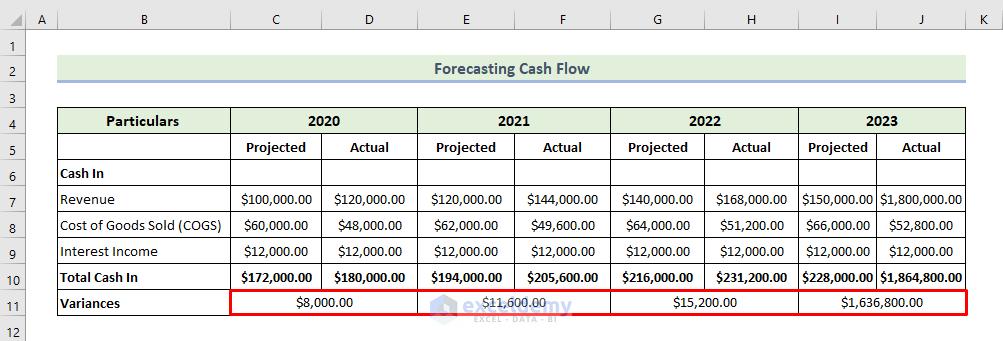
- Drag the Fill Handle icon to the right to fill other cells with the formula.
You will get the following total variance row. The positive variance indicates that cash is on hand more than was originally forecast.
Read More: How to Calculate Annual Cash Flow in Excel
Step 2: Forecasting the Total Cash Outflows
We will calculate the actual value of each particular given in the following dataset. There was a 10% understatement of all the particulars of the projected value in this dataset.
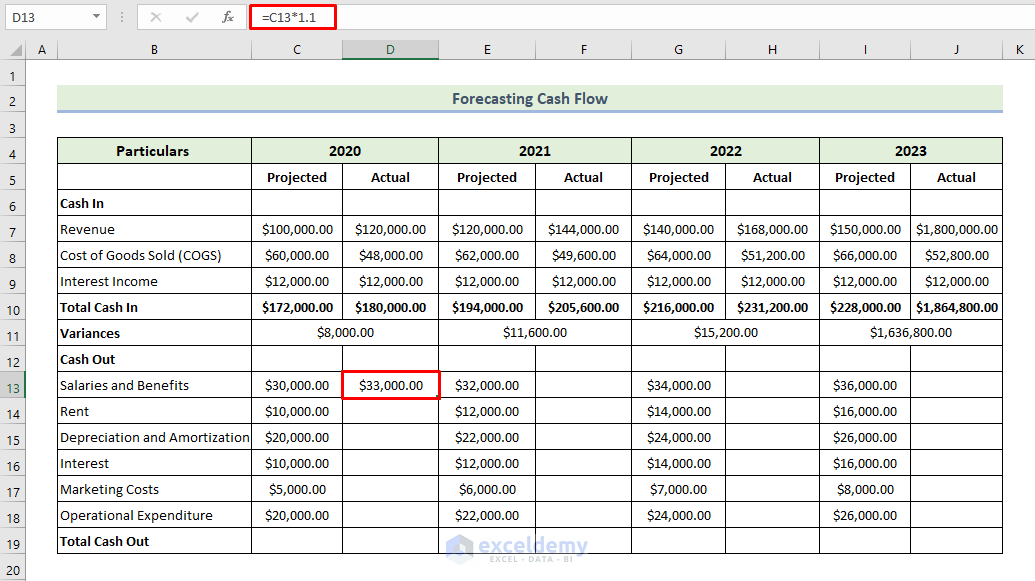
- Enter the following formula to calculate the actual salaries and benefits in 2020:
=C13*1.1
- Press Enter.
You will get actual salaries and benefits in 2020.
- Drag the Fill Handle icon to fill other cells with the formula.
You will get the following actual cash-out particulars for 2020.
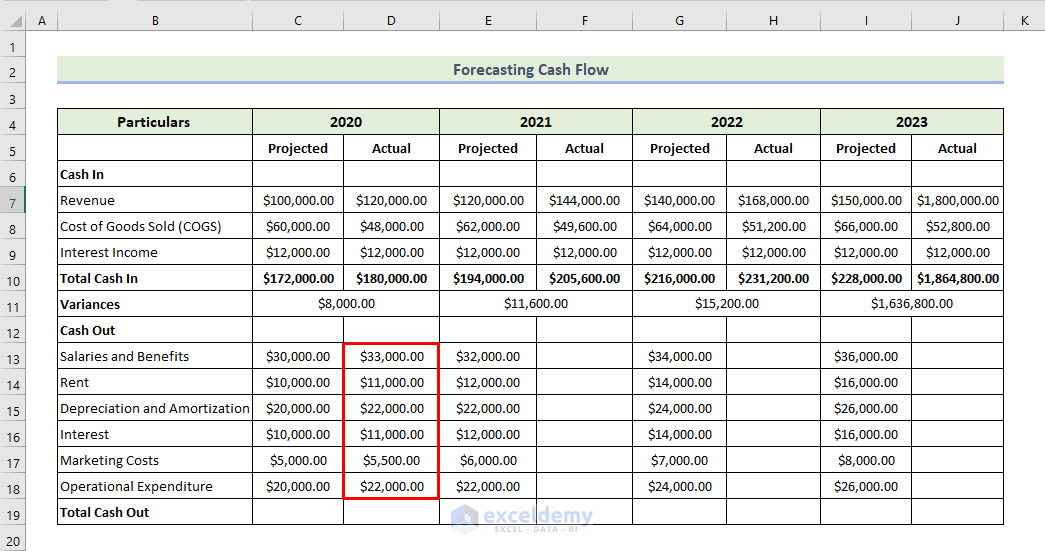
- Follow the same formula to find out the out year’s actual cash-out particulars because there was a 10% understatement of all the particulars of the projected value in this dataset.
You will get the following dataset.
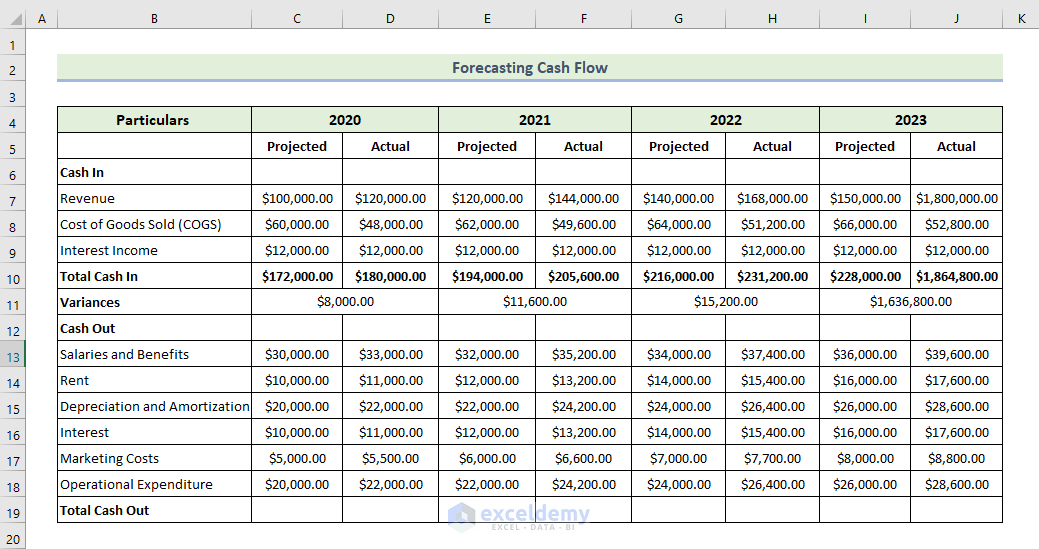
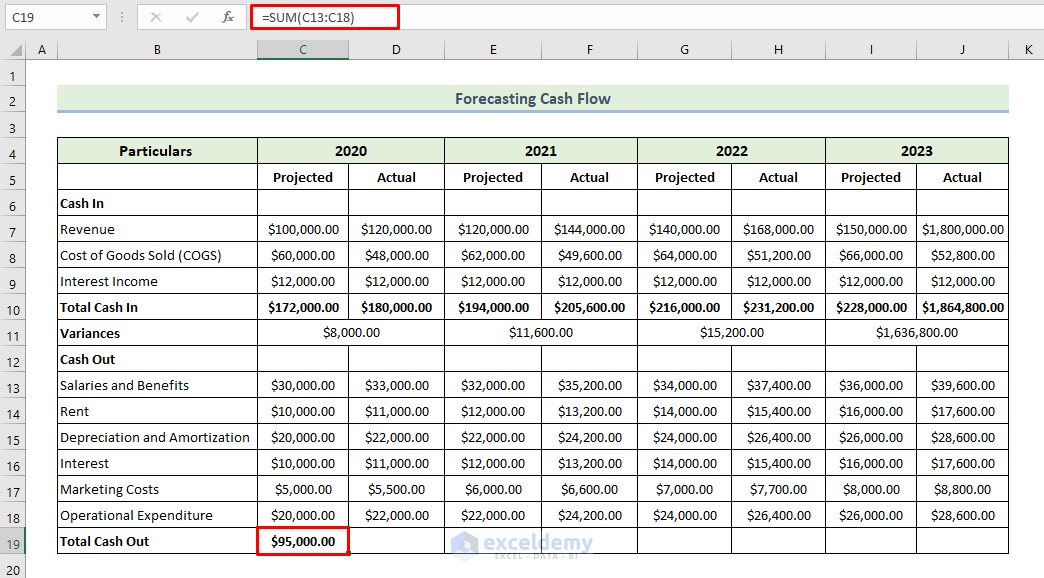
We will calculate the total cash out for each year of the projected and its actual value.
- Enter the following formula to calculate the total cash out for 2020:
=SUM(C13:C18)
- Press Enter.
You will get the total cash out for 2020.
- Drag the Fill Handle icon to the right to fill other cells with the formula.
You will get the following total cash out of a row.
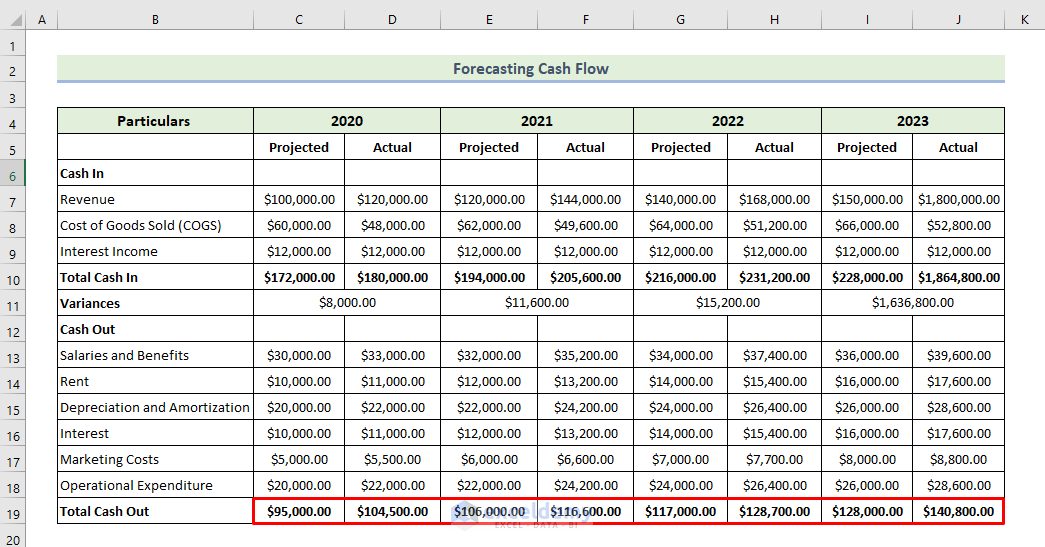
Wwe will calculate the variance between the actual and projected values of each particular for each year.
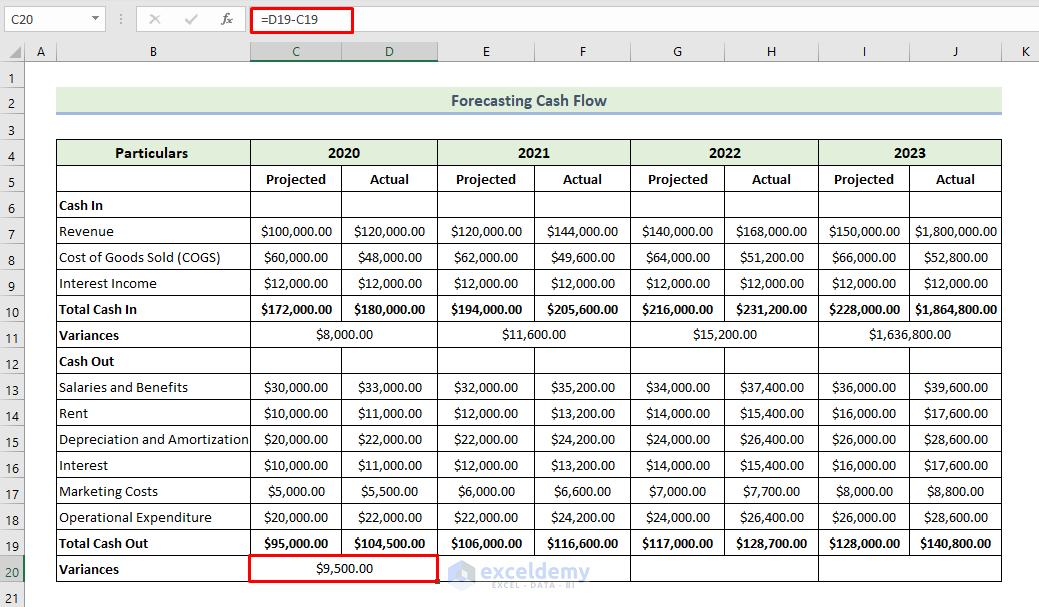
- Enter the following formula to calculate the variance between each individual’s actual and projected values for 2020:
=D19-C19
- Press Enter.
You will get the variance for 2020.
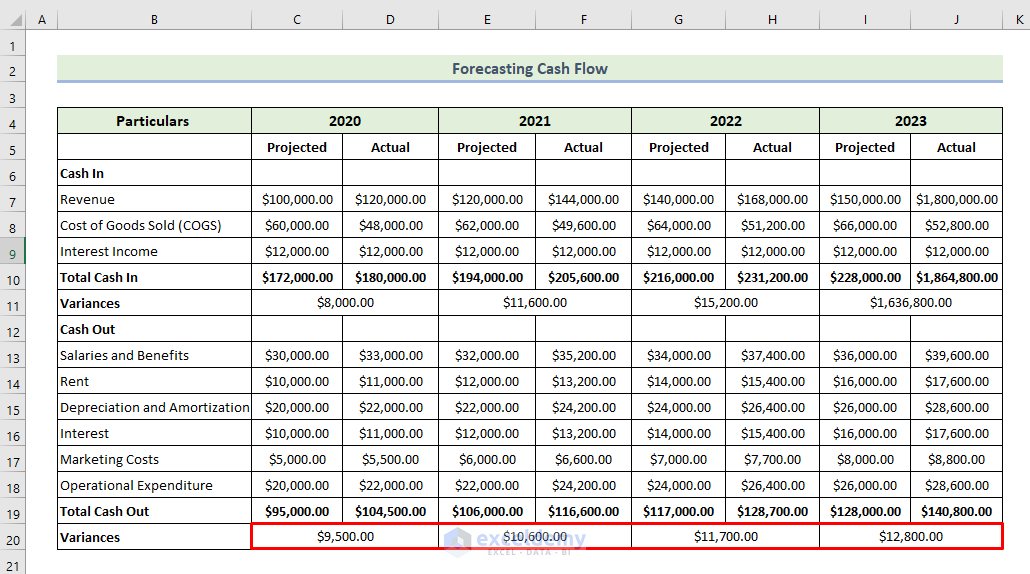
- Drag the Fill Handle icon to the right to fill other cells with the formula.
You will get the following total variances row. As a result of the positive variance, it appears that cash is on hand more than originally forecasted.
Read More: How to Calculate Incremental Cash Flow in Excel
Step 3: Obtaining the Net Change in Cash to Forecast Cash Flow in Excel
We will calculate the net change in cash in the following dataset.
- Enter the following formula to calculate the net change in cash in 2020:
=C10-C19
- Press Enter.
You will get a net change in cash in 2020.
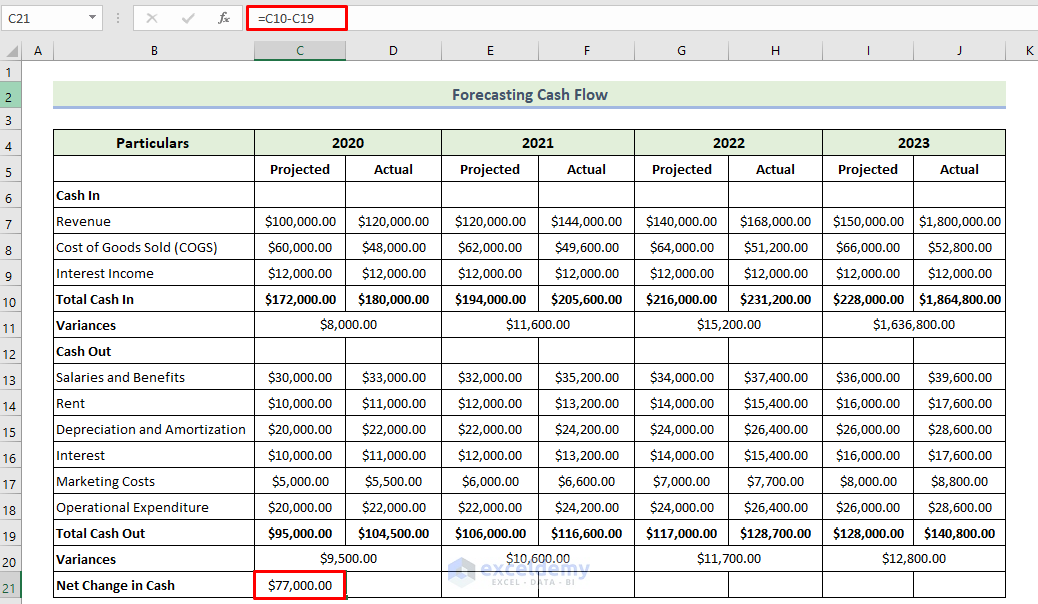
- Drag the Fill Handle icon to the right to fill other cells with the formula.
You will get the following net change in the cash row.
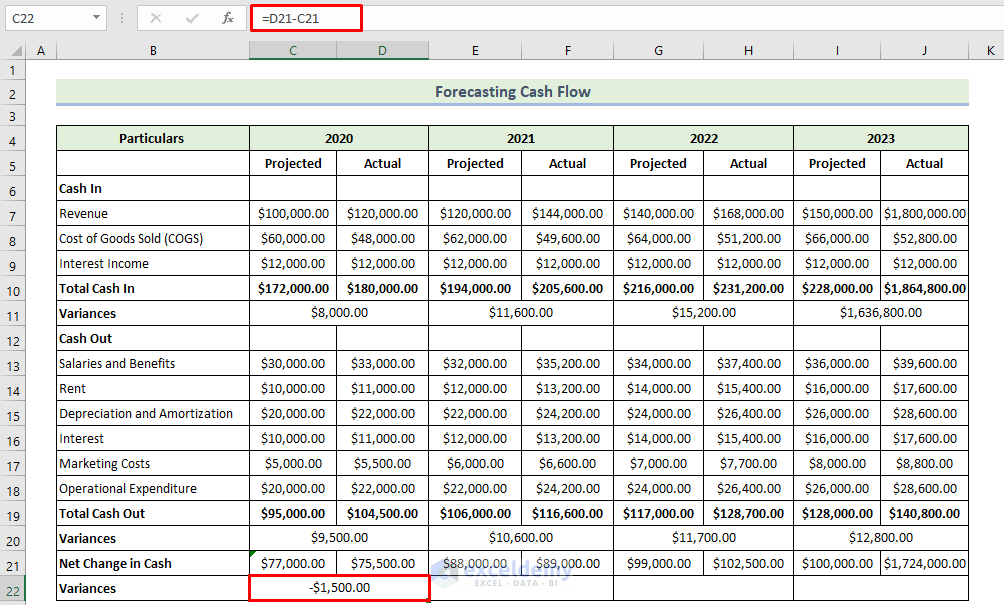
We will calculate the variance between the actual and projected values of each particular for each year.
- Enter the following formula to calculate the variance between each individual’s actual and projected values for 2020:
=D21-C21
- Press Enter.
You will get the variance for 2020.
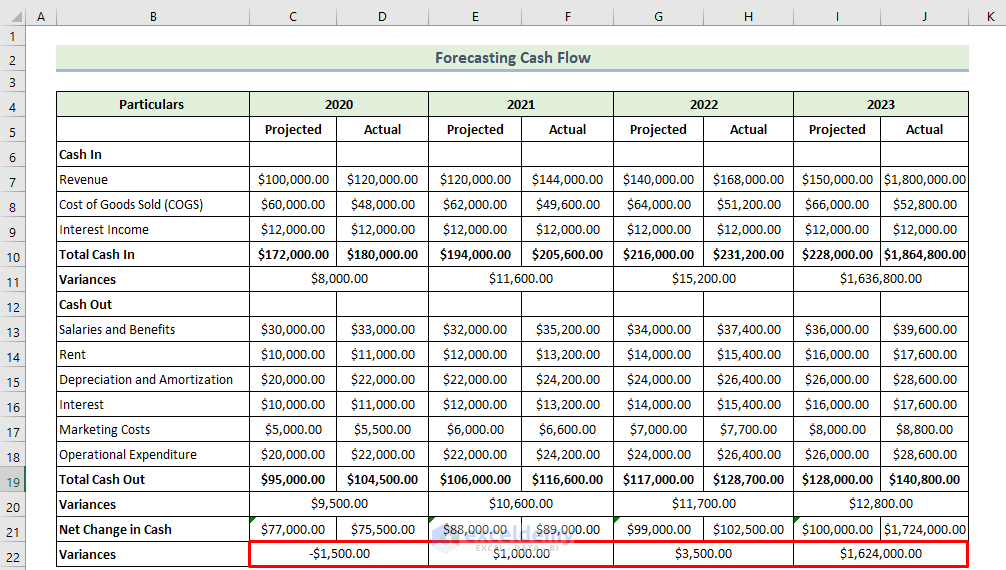
- Drag the Fill Handle icon to the right to fill other cells with the formula.
You will get the following variance row. The positive variance indicates that cash is on hand more than originally forecasted.
Read More: How to Calculate Discounted Cash Flow in Excel
Download the Practice Workbook
Download this practice workbook to exercise while you are reading this article. It contains all the datasets in different spreadsheets for a clear understanding. Try yourself while you go through the step-by-step process.
Related Articles
- How to Calculate Free Cash Flow in Excel
- How to Calculate Cumulative Cash Flow in Excel
- How to Draw a Cash Flow Diagram in Excel
- How to Track Cash Flow in Excel
- How to Create a Personal Cash Flow Statement in Excel
- How to Calculate Operating Cash Flow Using Formula in Excel
- How to Calculate Payback Period in Excel
- How to Calculate Payback Period with Uneven Cash Flows
- How to Apply Discounted Cash Flow Formula in Excel
- How to Calculate Operating Cash Flow in Excel
<< Go Back to Excel Cash Flow Formula | Excel Formulas for Finance | Excel for Finance | Learn Excel
Get FREE Advanced Excel Exercises with Solutions!
