Introduction to Cash Flow Diagrams
- Cash flow diagrams represent cash transactions over time.
- They’re commonly used in finance, engineering, and economics.
- Key elements include initial investments, maintenance costs, project earnings, and salvage value.
- Engineers and management accountants use them for decision-making and break-even analysis.
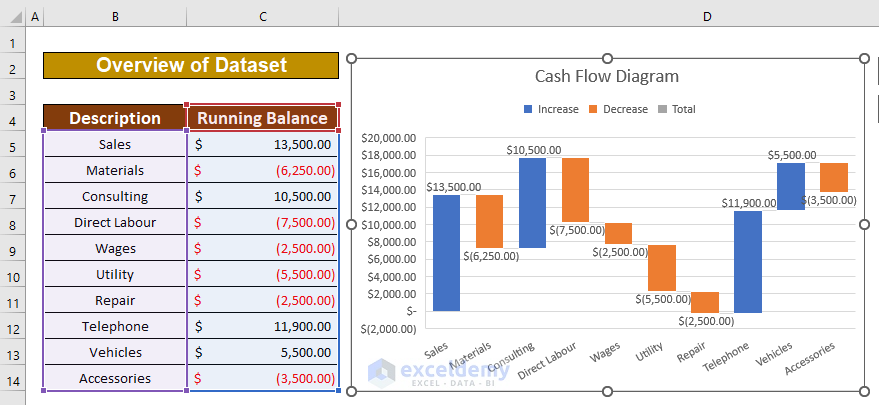
Dataset Overview
- Suppose we have an XYZ group dataset with income and expense information.
- Columns B and C contain descriptions and running balances, respectively.
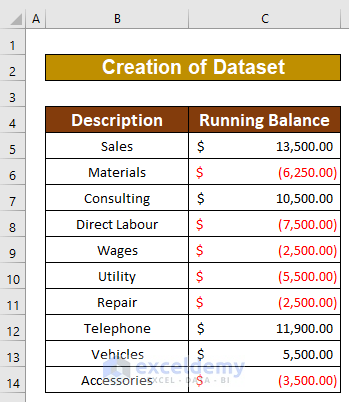
Step 1 – Create a Dataset
- Set up a dataset with relevant parameters (income, expenses, etc.).
Read More: How to Calculate Annual Cash Flow in Excel
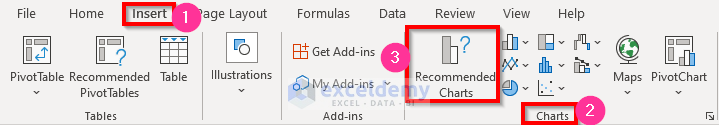
Step 2 – Insert a Chart
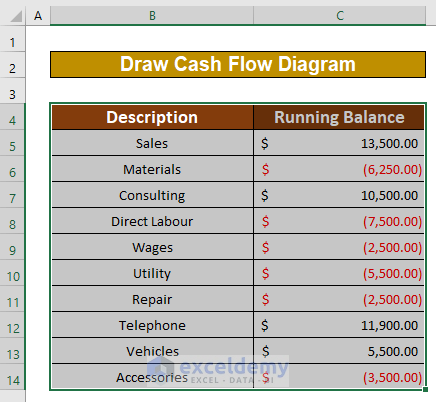
- Select the data range (e.g., B4 to C14) for your cash flow.
- Go to the Insert tab, choose Charts, and select Recommended Charts.
Read More: How to Calculate Incremental Cash Flow in Excel
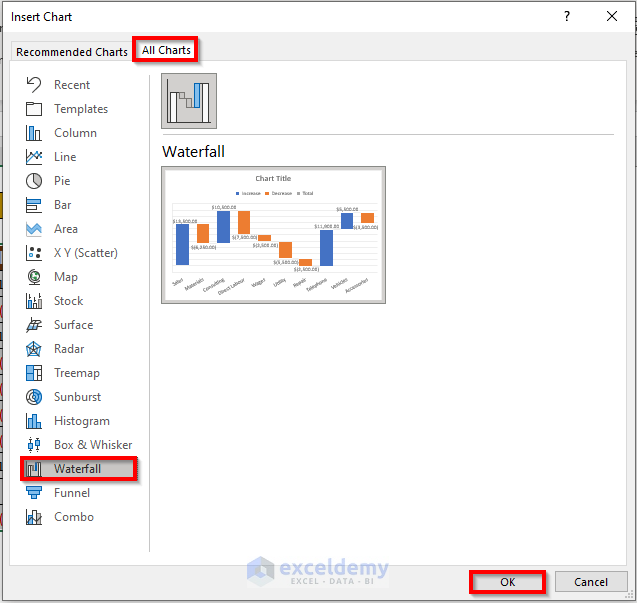
Step 3 – Using a Waterfall Chart
- In the Insert Chart dialog, select All Charts.
- Choose the Waterfall option and click OK.
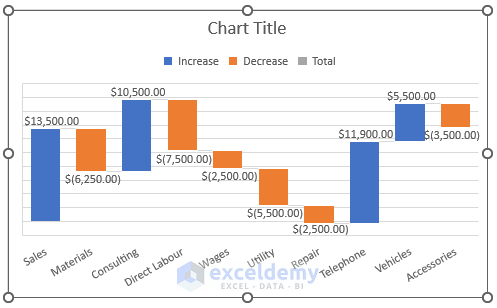
A cash flow diagram has been created using the dataset.
Read More: How to Calculate Discounted Cash Flow in Excel
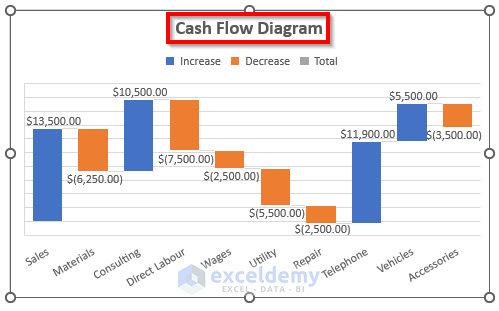
Step 4 – Add a Title
- Give your chart the title Cash Flow Diagram.
Read More: How to Forecast Cash Flow in Excel
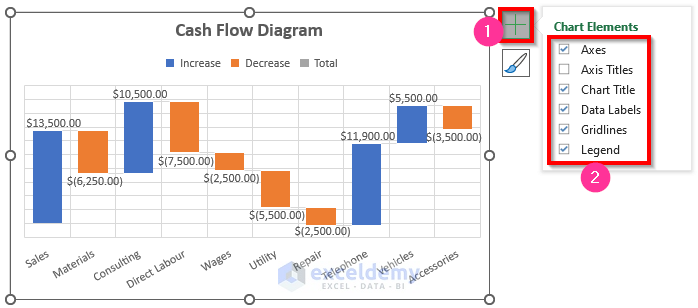
Step 5 – Format the Diagram
- Click anywhere on the chart to format it.
- Customize labels, colors, and other visual aspects.
Read More: How to Calculate Cumulative Cash Flow in Excel
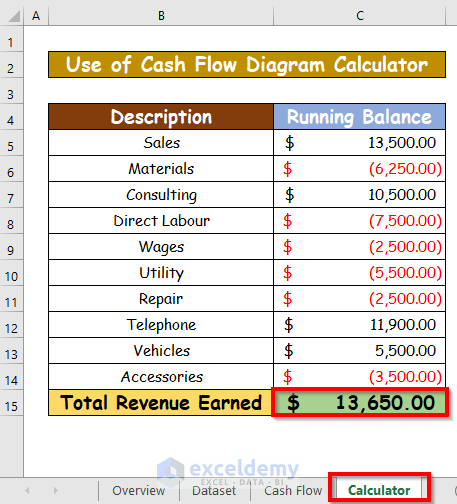
Cash Flow Diagram Calculator
- Use the workbook as a calculator.
- Explore the Calculator sheet, input values for sales, materials, labor, etc.
- It will calculate total revenue based on the cash flows.
Download Practice Workbook
You can download the practice workbook from here:
Related Articles
- How to Track Cash Flow in Excel
- How to Create a Personal Cash Flow Statement in Excel
- How to Calculate Operating Cash Flow Using Formula in Excel
- How to Calculate Free Cash Flow in Excel
- How to Calculate Payback Period in Excel
- How to Calculate Payback Period with Uneven Cash Flows
- How to Apply Discounted Cash Flow Formula in Excel
- How to Calculate Operating Cash Flow in Excel
<< Go Back to Excel Cash Flow Formula | Excel Formulas for Finance | Excel for Finance | Learn Excel
Get FREE Advanced Excel Exercises with Solutions!
