Excel PRICE function is under financial functions, calculates the price of per $100 face value of a bond that pays interest periodically.
Quick overview of Excel PRICE Function
In this article, we’ll discuss the instances and tricks to enable you to use the PRICE function more efficiently.
PRICE Function in Excel: Syntax
⦽ Function Objective:
The PRICE function calculates the breakeven price per $100 face value of a bond or security.
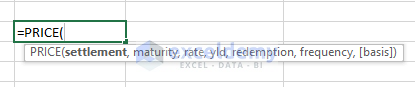
⦽ Syntax:
PRICE(settlement, maturity, rate, yld, redemption, frequency, [basis])
⦽ Arguments Explanation:
| Argument | Required/Optional | Explanation |
|---|---|---|
| settlement | Required | The date when the bond or security is purchased. It must be after the bond’s issue date. |
| maturity | Required | Purchased bond or security’s maturity date. It indicates when the bond or security will expire. |
| rate | Required | Annual coupon rate of the bond or security. |
| yld | Required | Per annum yield of the bond or security. |
| redemption | Required | Redemption value of the bond or security (per $100 face value) |
| frequency
|
Required | Number of coupon payments per annum.
In case of Annual Payments, Frequency = 1; Semi-annual Payments, Frequency= 2; Quarterly Payments, Frequency= 4. |
| [basis]
|
Optional | Type of day count basis specified in the bond or security. |
🔄 Day Count Basis [basis]:
| [basis] | Day Count Basis/Optional |
|---|---|
| 0 or Omitted | US (NASD) 30/360 |
| 1 | Actual/actual |
| 2 | Actual/360 |
| 3 | Actual/365 |
| 4 | European 30/360 |
⦽ Return Parameter:
Return the bond or maturity price against per $100 face value.
⦽ Applies To:
Microsoft Excel version 2003, Excel MAC version 2011, and onwards.
Understanding the PRICE Function: How it Works?
PRICE indicates the price of a bond or security. The bond or security PRICE is the discounted value offered in the present that ensures future cash inflows.
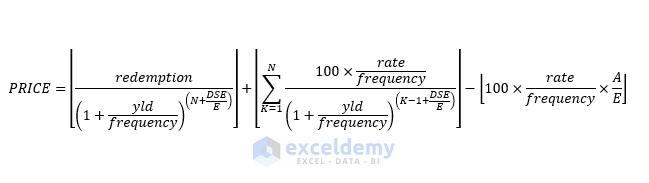
🔄 When N>1, PRICE is determined by the following equation
🔄 In case of N=1, then the equation becomes
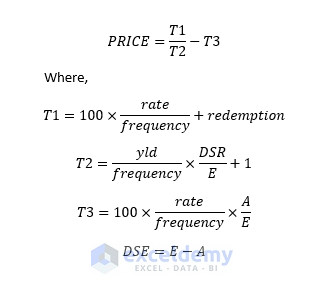
⏩ DSC = number of days from settlement to next coupon date
⏩ E = number of days in coupon period in which the settlement date falls
⏩ A = number of days from the beginning of the coupon period to the settlement date.
Example 1: Calculating Corporate Bond Price Using the PRICE Function in Excel
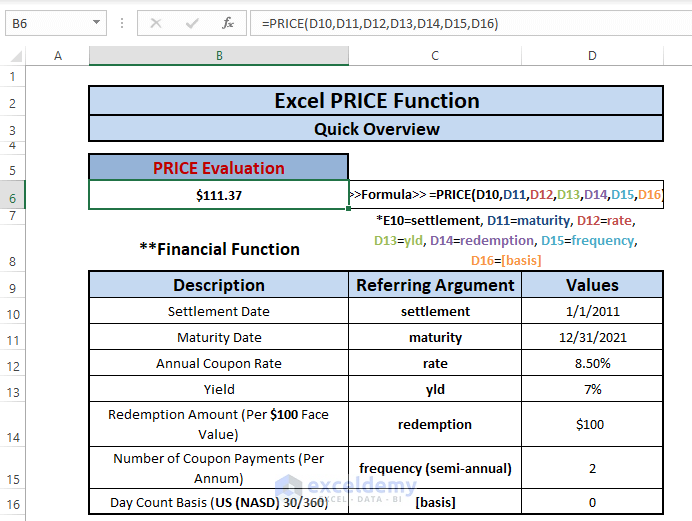
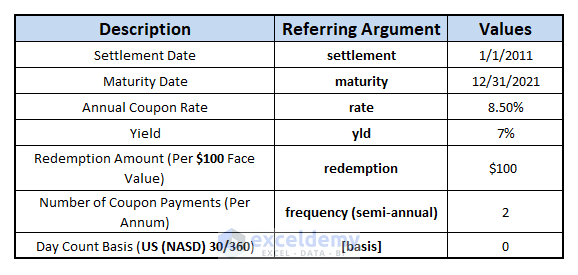
Let’s say, we want to calculate a corporate bond price that has a face value of $100. The bond was purchased on 1 January 2011. Other required or optional arguments are shown in the following image.
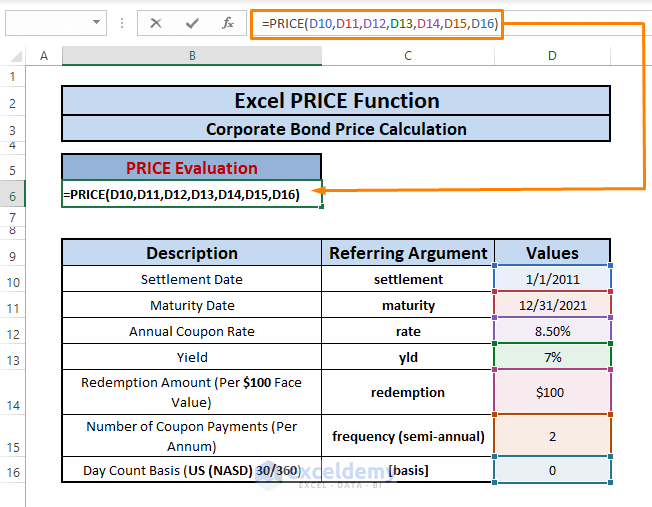
 ➧ Paste the below formula in any blank cell (i.e., B6).
=PRICE(D10,D11,D12,D13,D14,D15,D16)In the formula,
D10=settlement
D11=maturity
D12=rate
D13=yld
D14=redemption
D15=frequency
D16=[basis]
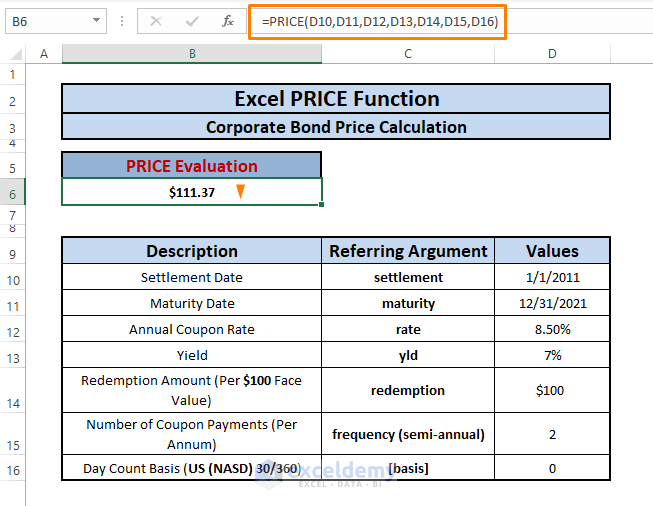
➧ Hit ENTER and you’ll get the Price of the corporate bond per $100 face value.
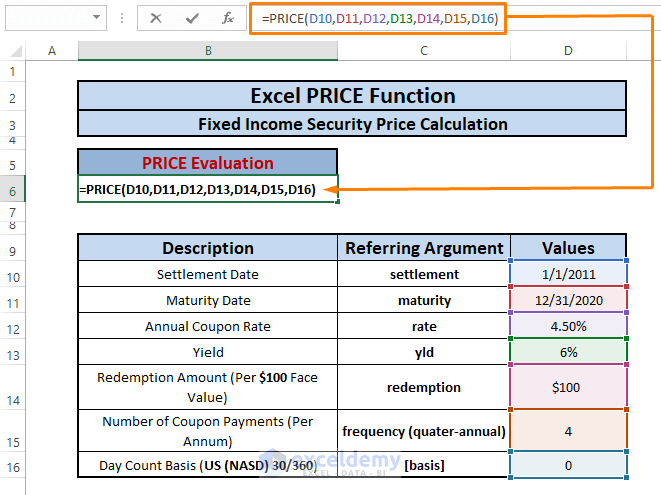
Example 2: Calculating Fixed-Income Security with Excel Price Function
The fixed-income security price calculation is similar to the corporate bond price calculation. However, fixed-income securities have much lower annual coupon rates than corporate bonds. Also, fixed-income securities have lower Yield percentages as shown in the following image.
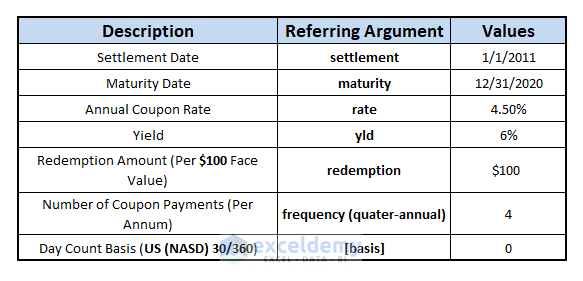 Values offered in the above image are subject to different bond types. There are multiple variations of argument values such as annual coupon rate, yield rate, and the number of coupon payments (i.e., frequency). These variable changes depend on bond types, as you can see for fixed-income security, the number of coupon payments can be offered quarterly.
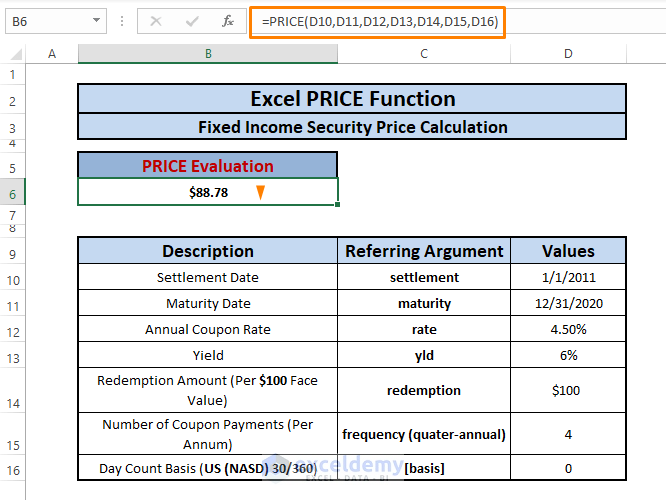
➧ Write the following formula in any random cell (i.e., B6).
=PRICE(D10,D11,D12,D13,D14,D15,D16)All the cell references declare the same arguments as they do in the previous example.
➧ Press ENTER then the security price appears against per $100 face value as shown in the below picture.
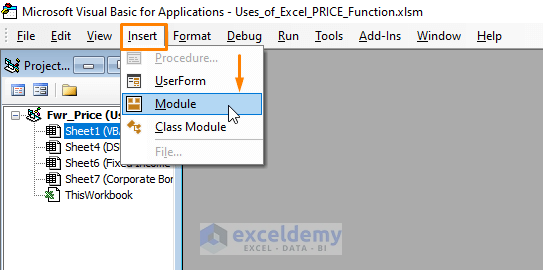
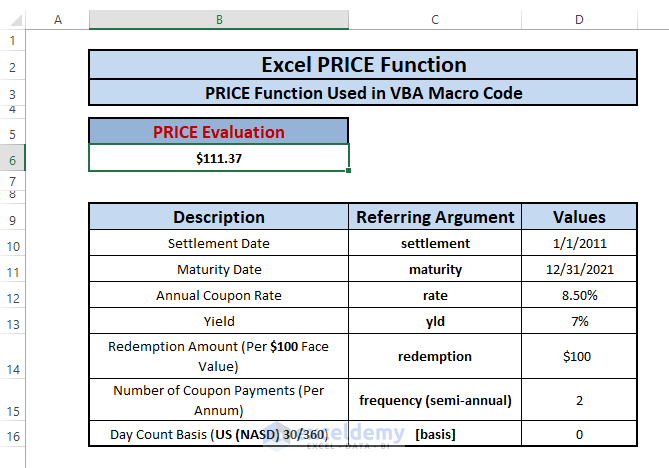
Example 3: Applying the PRICE Function in VBA
We can use the PRICE function in VBA Macro Code to come up with price value for any bond or securities face value. The PRICE function has its own Macro format.
Application.Worksheetfunction.Price(settlement,maturity,rate,yld,redemption,frequency,basis)➧ Press ALT+F11 to open up Microsoft Visual Basic window. In the Microsoft Visual Basic Window, Select Insert > Choose Module.
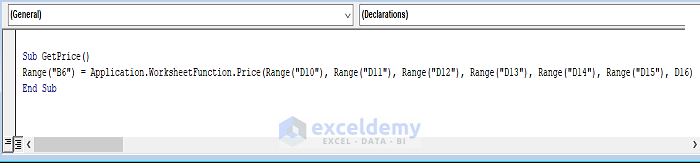
➧ In the Module, Paste the following VBA Macro Code then Press F5 to run the code.
Sub GetPrice()
Range("B6") = Application.WorksheetFunction.Price(Range("D10"), Range("D11"), Range("D12"), Range("D13"), Range("D14"), Range("D15"), D16)
End Sub
➧ Back to the worksheet, you’ll see the Price value in cell B6.
In our calculation, we follow United States’ (US) financial instances to demonstrate the example. You can use different preferences that are offered to you in the calculation.
⧭ Things to Keep in Mind
🔄 The #NUM! error occurs when
➤ The settlement date happens to be greater or equal to the maturity date.
➤ You provide invalid argument values. If you assign the annual coupon or yield rate less
than zero, frequency and basis to any number except 0,1,2,3,4.
🔄 The #VALUE! error occurs when
➤ The given dates (i.e., settlement and maturity date) are in invalid date format.
➤ Assign arguments to any non-numeric values.
Download Excel Workbook
Conclusion
I hope the above-described uses of the PRICE function intrigue you to use the function more efficiently. If you have further queries or feedback, please let me know in the comment section.
<< Go Back to Excel Functions | Learn Excel

