Are you trying to move the X-axis of your Excel chart to the bottom? There are so many cases where you need to place the X-axis or horizontal axis at the bottom of the chart. In this article, I will demonstrate how to move the X-axis to the bottom of an Excel chart. I will use the Microsoft Excel 365 version. So, let’s get started.

How to Move Excel Chart X Axis to Bottom: 2 Simple Methods
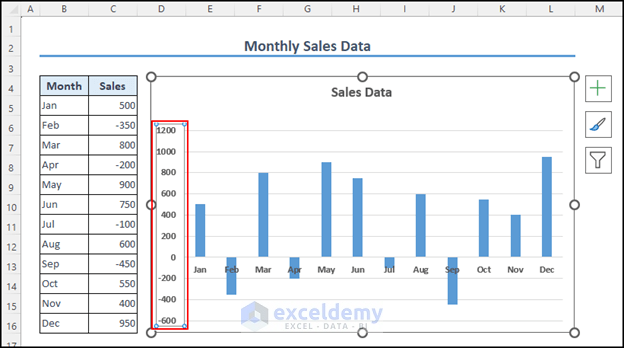
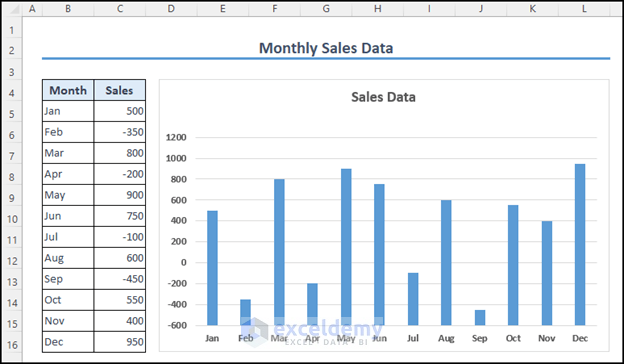
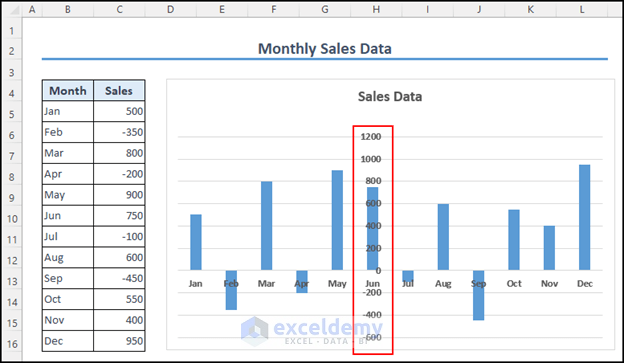
Here, I have a dataset that represents the monthly sales of a company. There are negative values as well in the Sales column. You can see in the bar chart that the horizontal axis, or X-Axis is located in the middle of the chart. This format is not suitable for reading the data. So, if you move the X-axis to the bottom, the chart will be more reader-friendly. I will explain two methods for how to move the Excel chart’s X-axis to the bottom.

Method 1: Replace X Axis of Excel Chart to the Bottom by Moving Label Position
Follow these simple steps to replace the X-Axis from the bottom:
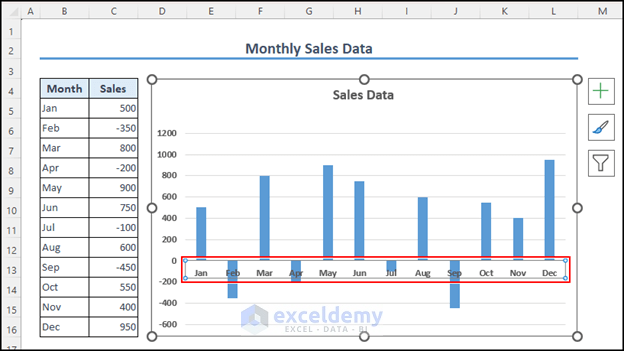
- First, click the horizontal or X-axis of the chart.
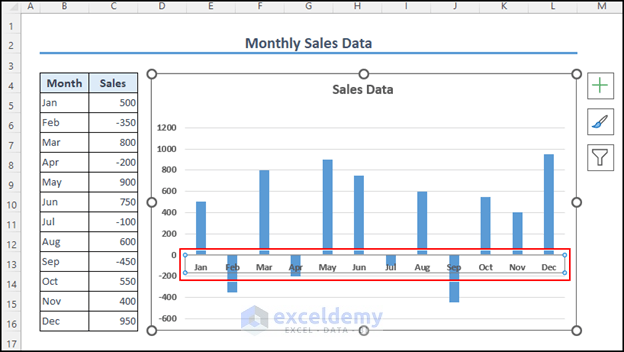
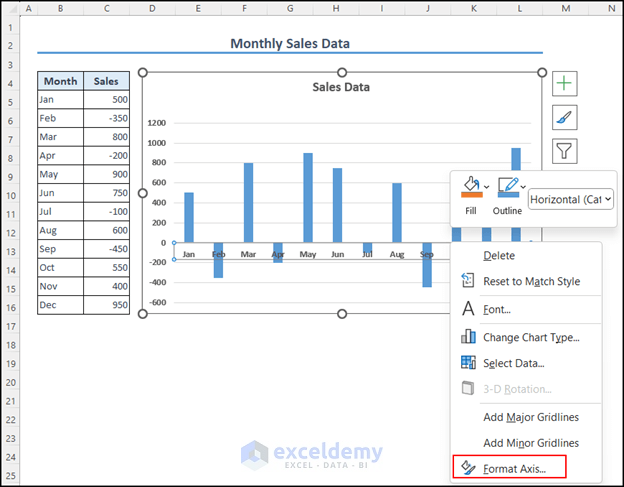
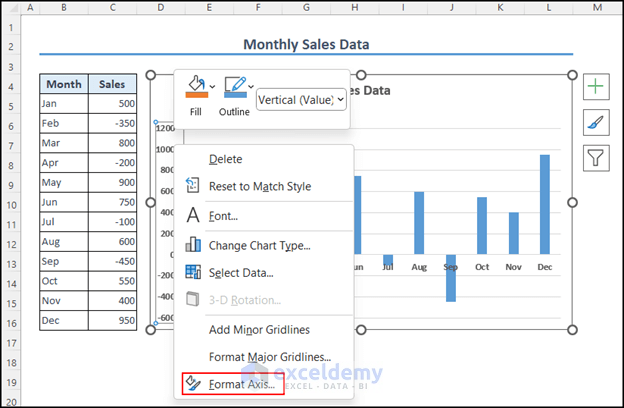
- Next, right-click on the X-axis.
- Select the Format Axis option which is marked on the image.
- Format Axis pane will appear.
- Now, from the Axis Options, select Labels.
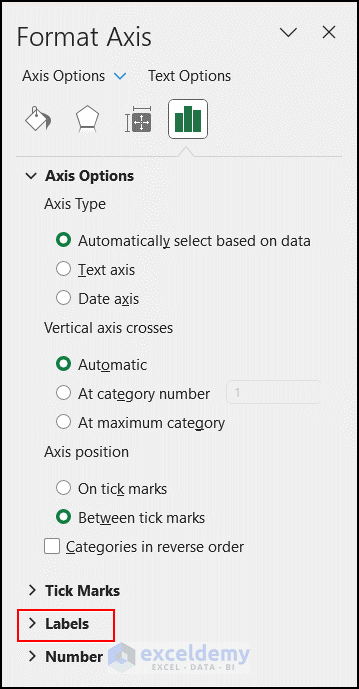
- Then, click on Labels.
- Label Position option is by default set as Next to Axis.
- Change this to Low.

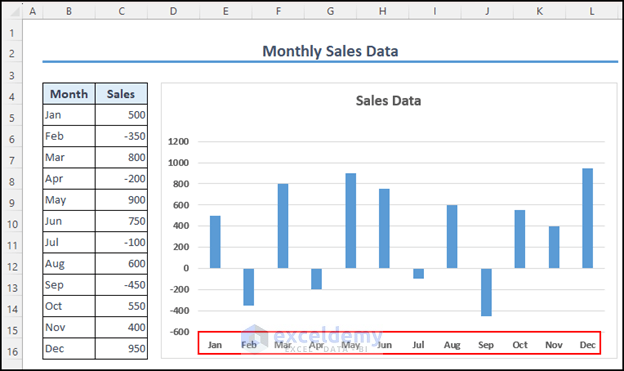
- As a result, X-Axis is now moved to the bottom.
Method 2: Move Excel Chart X Axis to the Bottom by Changing the value of the Horizontal Axis
This is another method of moving the X-axis to the bottom. Go through the steps below:
- To begin, select the vertical axis or Y-axis of the column chart.
- Afterward, right-click on the vertical axis.
- Select Format Axis from the options.
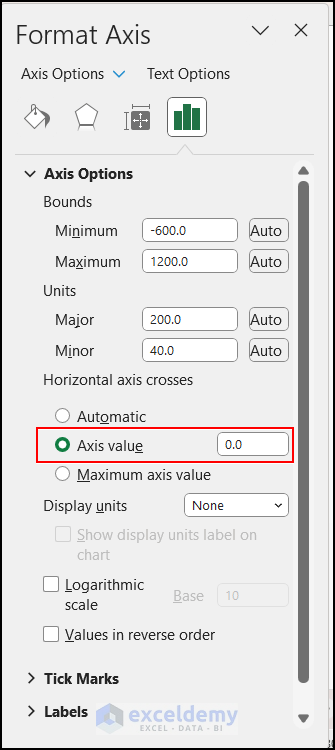
- Format Axis pane will appear.
- Click on Axis Value under Horizontal axis crosses.
- Axis Value is set as 0 here. You have to change this.
- Change the Axis value to the lowest value of your dataset. In my dataset, the Sales value of -600 is the lowest so I am changing Axis Value to -600.
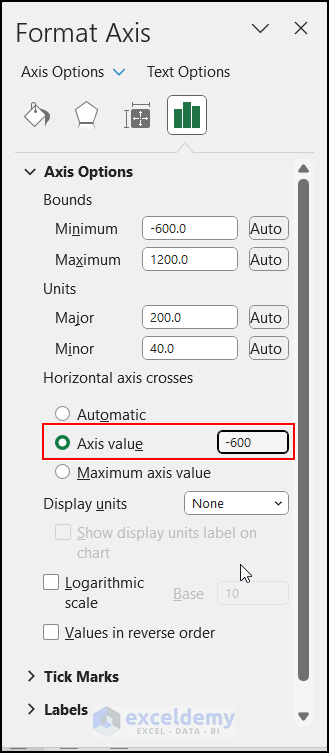
- Therefore, the Excel chart X axis has moved to the bottom.
How to Move Y-Axis in the Middle of the Graph in Excel
Sometimes, you need to place the vertical axis, or Y-axis in the middle of the chart. Now, I will demonstrate how to move the Y-axis in the middle of the graph. The following are the steps:
- Initially, select the horizontal axis of the chart.
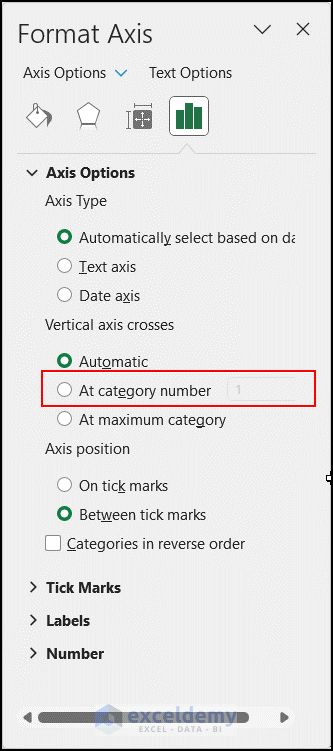
- Then, right-click on the horizontal axis and select the Format Axis

- In the Axis option, under vertical axis crosses, Automatic is selected by default.
- Click on At category number.
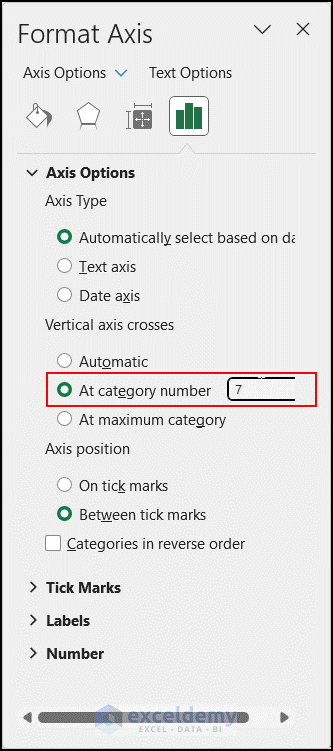
- There are 12 months in the X-axis, and I want to bring the vertical axis in the middle. So I have changed the At category number to 7, the approximate middle value. Depending on the range of your X-axis, change this number so that the Y-axis will remain in the middle.
- Thus, the Y axis has moved to the middle of the chart.
Conclusion
I have explained 2 easy methods of moving the X-axis to the bottom in Excel charts. I hope that by following the article, you will be able to move the X-axis to the bottom of the Excel chart. If you face any difficulty regarding this topic, please leave a comment so that I can help.
Related Articles
<< Go Back To Formatting Chart Elements in Excel | Excel Chart Elements | Excel Charts | Learn Excel
Get FREE Advanced Excel Exercises with Solutions!
