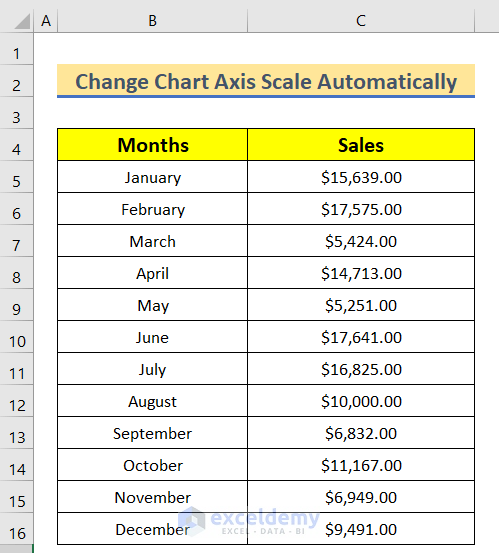
Here is the overview of our dataset.
Introduction to Chart Axis Scale in Excel
Charts typically have two axes that are used to measure and categorize data. In Microsoft Excel, the horizontal (category) axis is known as X-axis, and the vertical(category) axis is known as Y-axis. Data can be plotted along a chart’s depth using the depth axis, which is a third axis seen in the 3-D columns, 3-D cones, or 3-D pyramid charts. Horizontal (Category) axes are absent from pie and doughnut charts as well as radar charts.
Method 1 – Using the Format Axis Feature to Change the Chart Axis Scale in Excel
Step 1: Creating a Dataset for X and Y axis
Enter Data in B4 and C4.
Step 2: Insert a 2-D Column Chart
- Click B4.
- Go to the Insert tab >> Click scatter and insert the Bar Chart.
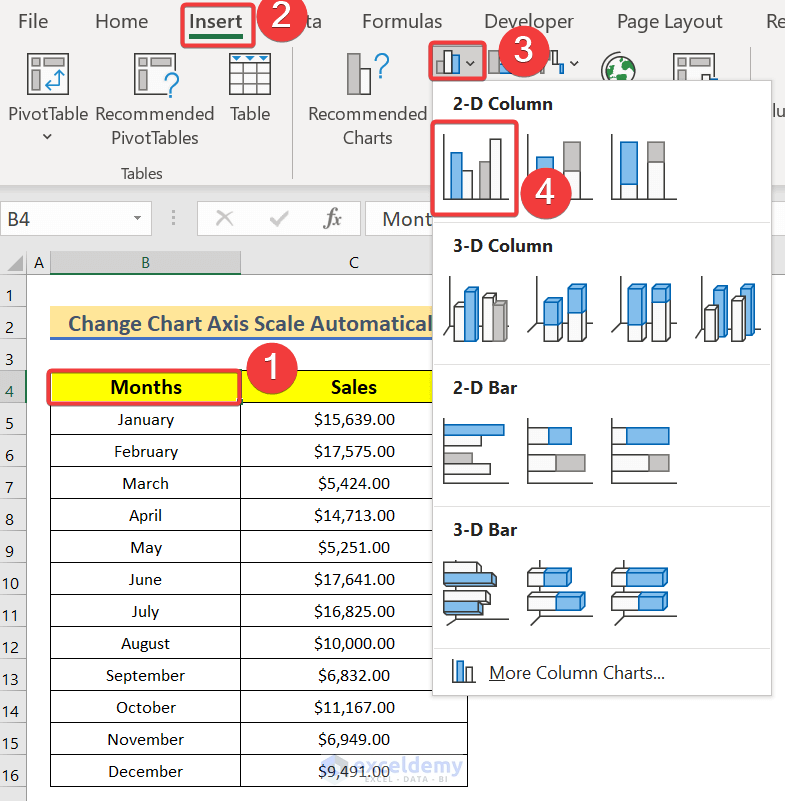
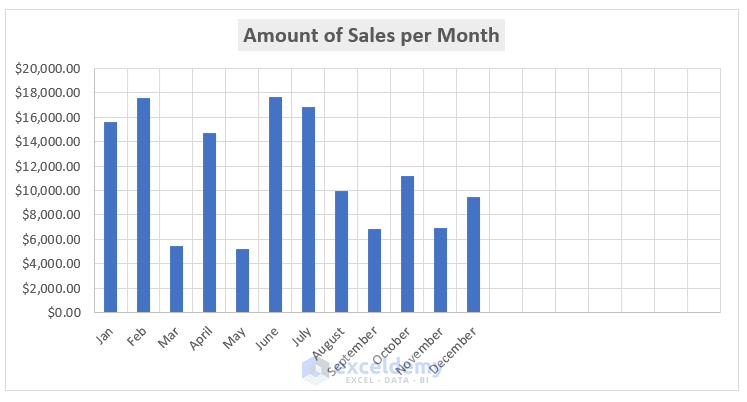
- The Bar Chart will be displayed.
Step 3: Changing the Chart Axis Scale Automatically
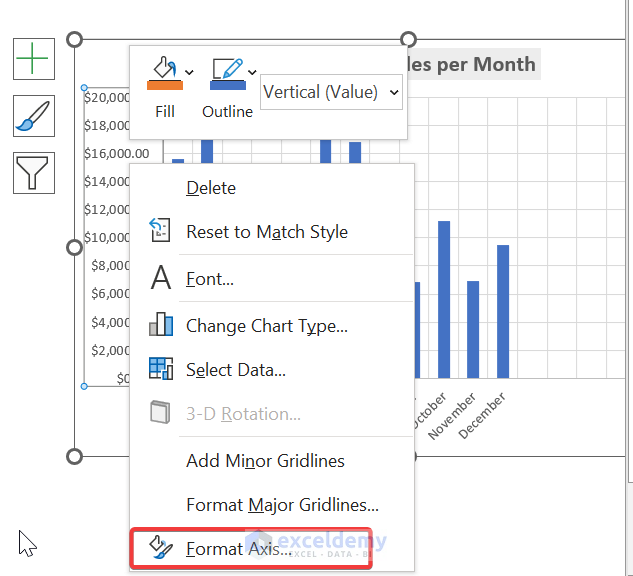
- Select the vertical values of the scatter chart and right click.
- Select Format Axis.
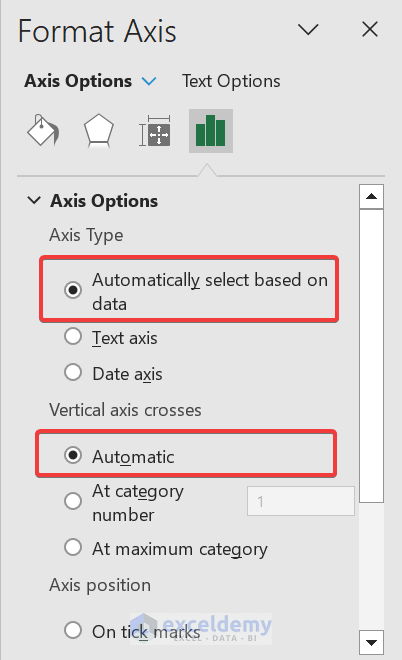
- In Format Axis, select Axis options.
- In Units >> Enter 3000.
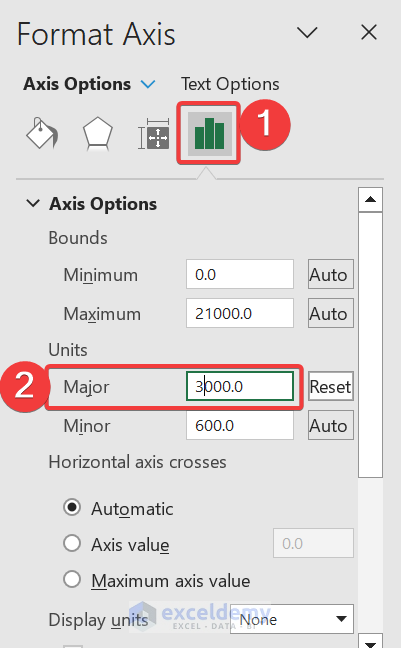
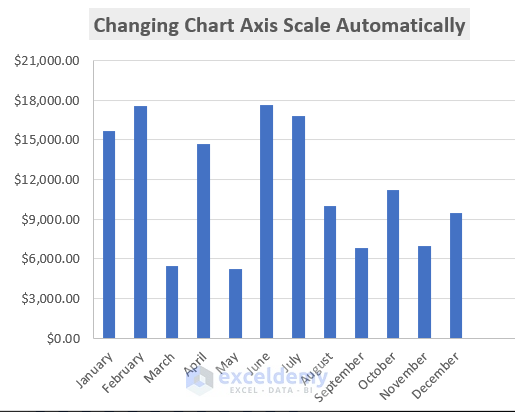
- The Maximum Bounds will change to 21000 automatically, and the scale of the y-axis changes will change to 3000.
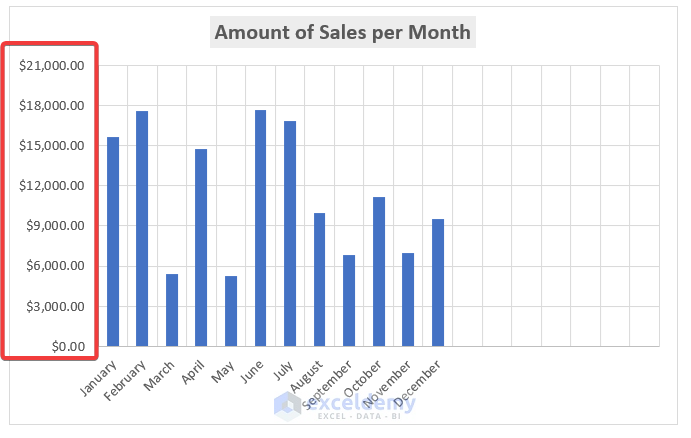
- Observe the GIF image below.
 You can’t change the x-axis scale, because text was used instead of values in the horizontal category.
- In Format Axis you should keep the Axis Type and the Vertical Axis Crosses.
You can also go to Format Axis by right-clicking.
Read More: How to Change Axis Scale in Excel
Method 2 – Running an Excel VBA Code to Change the Chart Axis Scale Automatically
Step 1:
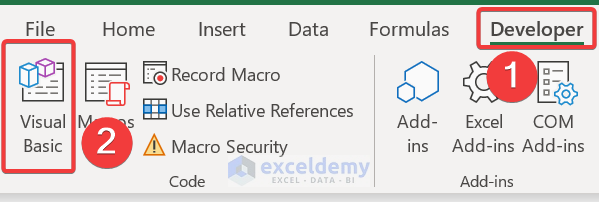
- Go to the Developer tab.
Developer → Visual Basic
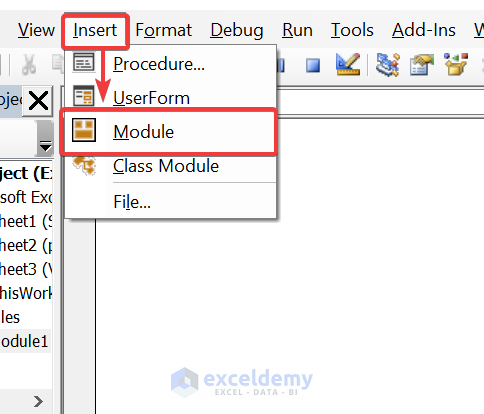
- In Microsoft Visual Basic for Applications, insert a module.
Insert → Module
Step 2:
- Enter the VBA code.
Function ChartAxisScale(sheetName As String, chartName As String, MinOrMax As String, _
    ValueOrCategory As String, PrimaryOrSecondary As String, Value As Variant)
Dim chart As chart
Dim text As String
'Set the function to control the chart
Set chart = Application.Caller.Parent.Parent.Sheets(sheetName) _
    .ChartObjects(chartName).chart
'Set Primary axis Value
If (ValueOrCategory = "Value" Or ValueOrCategory = "Y") _
    And PrimaryOrSecondary = "Primary" Then
    With chart.Axes(xlValue, xlPrimary)
        If IsNumeric(Value) = True Then
            If MinOrMax = "Max" Then .MaximumScale = Value
            If MinOrMax = "Min" Then .MinimumScale = Value
        Else
            If MinOrMax = "Max" Then .MaximumScaleIsAuto = True
            If MinOrMax = "Min" Then .MinimumScaleIsAuto = True
        End If
    End With
End If
'Set Primary axis Category
If (ValueOrCategory = "Category" Or ValueOrCategory = "X") _
    And PrimaryOrSecondary = "Primary" Then
    With chart.Axes(xlCategory, xlPrimary)
        If IsNumeric(Value) = True Then
            If MinOrMax = "Max" Then .MaximumScale = Value
            If MinOrMax = "Min" Then .MinimumScale = Value
        Else
            If MinOrMax = "Max" Then .MaximumScaleIsAuto = True
            If MinOrMax = "Min" Then .MinimumScaleIsAuto = True
        End If
    End With
End If
'Set secondary axis value
If (ValueOrCategory = "Value" Or ValueOrCategory = "Y") _
    And PrimaryOrSecondary = "Secondary" Then
    With chart.Axes(xlValue, xlSecondary)
        If IsNumeric(Value) = True Then
            If MinOrMax = "Max" Then .MaximumScale = Value
            If MinOrMax = "Min" Then .MinimumScale = Value
        Else
            If MinOrMax = "Max" Then .MaximumScaleIsAuto = True
            If MinOrMax = "Min" Then .MinimumScaleIsAuto = True
        End If
    End With
End If
'Set secondary axis category
If (ValueOrCategory = "Category" Or ValueOrCategory = "X") _
    And PrimaryOrSecondary = "Secondary" Then
    With chart.Axes(xlCategory, xlSecondary)
        If IsNumeric(Value) = True Then
            If MinOrMax = "Max" Then .MaximumScale = Value
            If MinOrMax = "Min" Then .MinimumScale = Value
        Else
            If MinOrMax = "Max" Then .MaximumScaleIsAuto = True
            If MinOrMax = "Min" Then .MinimumScaleIsAuto = True
        End If
    End With
End If
If IsNumeric(Value) Then text = Value Else text = "Auto"
ChartAxisScale = ValueOrCategory & " " & PrimaryOrSecondary & " " _
    & MinOrMax & ": " & text
End Function
Sub Axis_Scale()
End Sub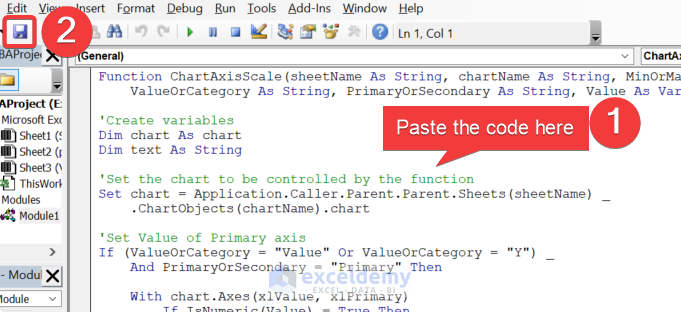
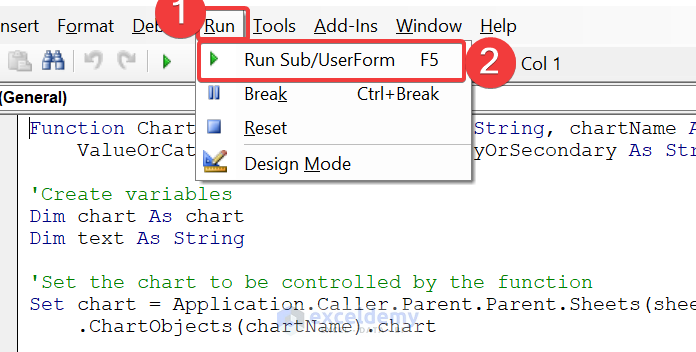
- Run the VBA:
Run → Run Sub/UserForm
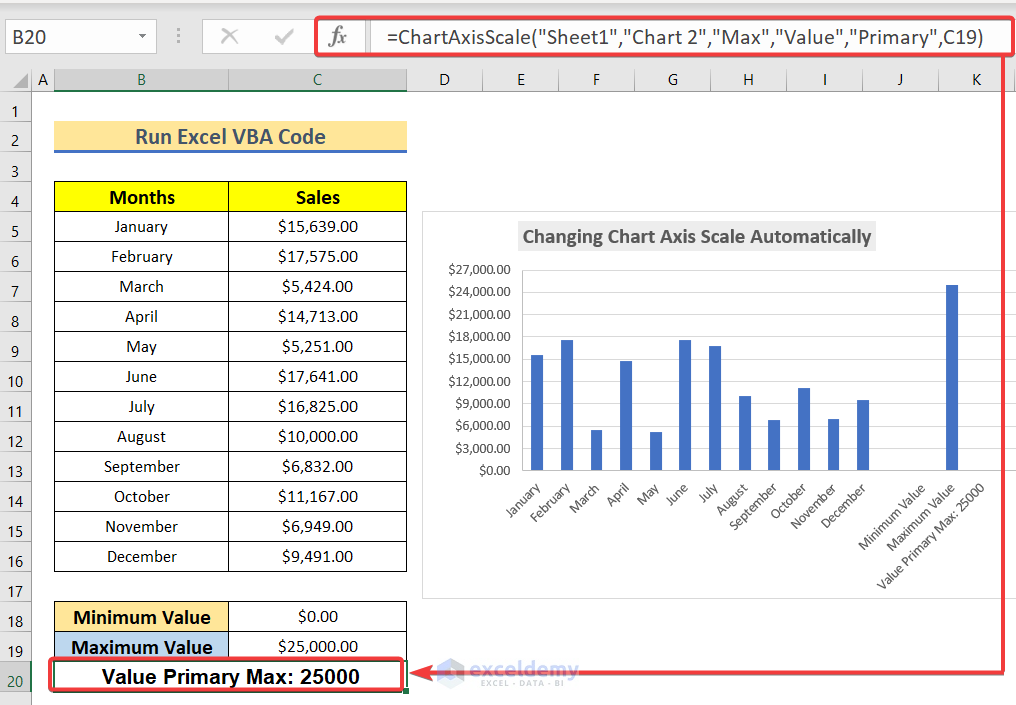
- Create a user-defined function.
- In your Excel sheet, select B20. Enter the user-defined function.
=ChartAxisScale(“Sheet1″,”Chart 2″,”Max”,”Value”,”Primary”,C19)
Code Breakdown:
This function modifies the properties of the Excel chart axis: sets the minimum or maximum value, or sets it to “Auto”, for the value (Y) or category (X) axis, either on the primary or secondary axis. The function includes 6 parameters:
- Sheet name: The name of the sheet that contains the chart
- Chart name: The name of the chart to modify
- Min Or Max: Whether to set the minimum or maximum value
- Value Or Category: Whether to modify the value (Y) or category (X) axis
- Primary Or Secondary: Whether to modify the primary or secondary axis
- Value: The value to set for the axis
The function returns a string with the final state of the axis.
Download Practice Workbook
Related Articles
- How to Scale Time on X Axis in Excel Chart
- How to Set Logarithmic Scale at Horizontal Axis of an Excel Graph
- How to Change Axis to Log Scale in Excel
- How to Break Axis Scale in Excel
- How to Set Intervals on Excel Charts
<< Go Back to Excel Axis Scale | Excel Charts | Learn Excel
Get FREE Advanced Excel Exercises with Solutions!
