Latest Posts From Mizbahul Abedin
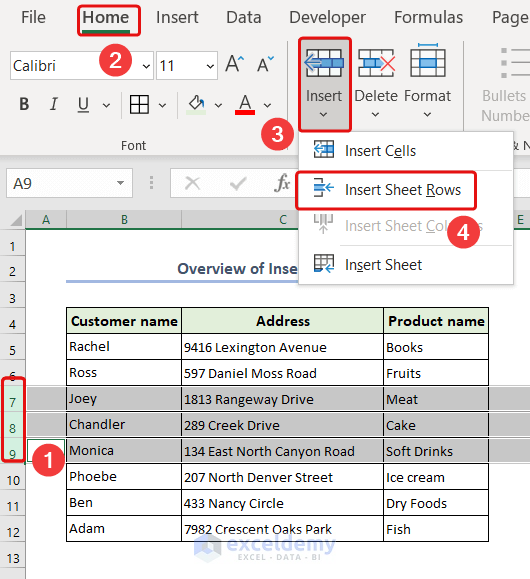
Method 1 - Using Keyboard Shortcut Select row 7 and then press ALT+I+R. A new row has been inserted into your Excel sheet. You can use another ...

Method 1 - How to Merge Cells in Excel Using Merge & Center Feature Select the cells from B5 to G5. Go to the Home tab. From the Alignment group, ...
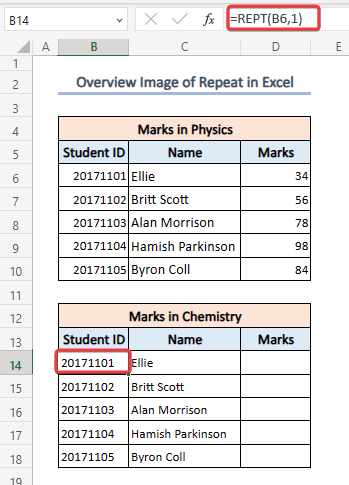
In this Excel tutorial, you will learn: - How to redo actions - How to repeat cell values - How to repeat patterns - How to repeat formulas using the Fill ...

What Is a Stacked Waterfall Chart in Excel? A stacked waterfall chart is a special type of graph that illustrates how values change across different ...

Trace dependents can make it easier to find which cells track data, but can also make the sheet a bit messier. We'll use a simple dataset as an example of how ...

In this article, we will demonstrate how to use the Excel IF statement to increment by 1. We will also increment by 1 using the COUNTIF function, and by using ...

What Is Economic Order Quantity? It means the optimum level of order quantity, not higher or lower. Economic Order Quantity (EOQ) is a calculation ...

In this article, we are going to show you how you link sheets in Excel with an index. We will apply the HYPERLINK link function, VBA macro, and also use the ...
Here's an overview of the VBA code needed to get cell values. How to Get Cell Value as String with Excel VBA: 4 Approaches Method 1 - Get a String ...
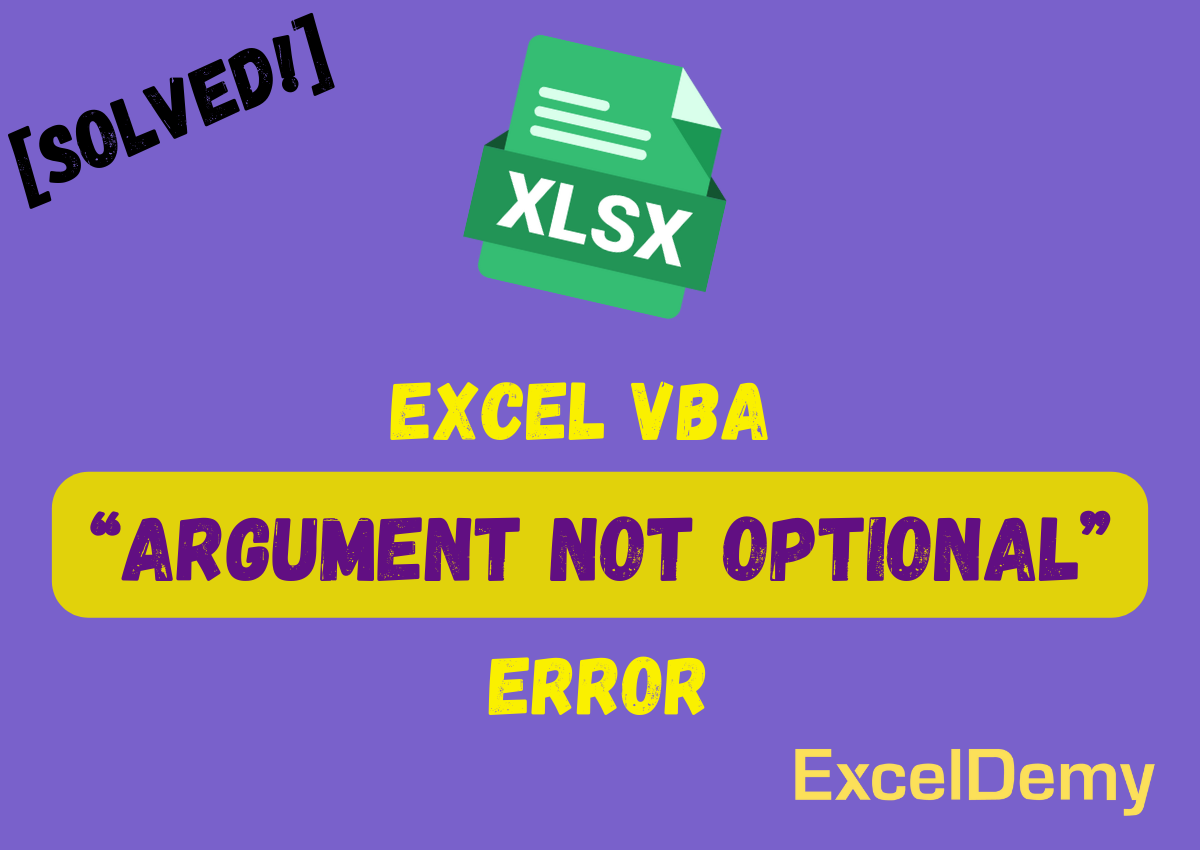
Why “Argument Not Optional” Error Occurs in Excel VBA This error occurs when you call a procedure or function without providing all the required arguments. In ...

The Do While loop in Excel VBA allows code to be executed repeatedly as long as a specified condition remains true. In this article, we will explore how to ...

Looking for ways to use Excel VBA to call private sub from userform? Then, this is the right place for you. In Excel VBA, private subs are typically ...

In this article, we will explore the step-by-step process of using VBA to create a Pivot Table from named range using Excel VBA. Excel Pivot Tables are ...
This is an overview. What Is a Global Array in Excel? In VBA (Visual Basic for Applications), a global array is an array that is declared at the ...

The article demonstrates how to create a VBA macro that automates the Text to Columns process and converts text dates into Excel date format. ...
See Our Reviews at


Hello AMAR,
Thanks for commenting. There is a typing mistake in your formula.
The formula for exercise 7 which we applied to cell I148 is: =SWITCH(TRUE,D148>=$B$173,$C$173,D148>=$B$172,$C$172,D148>=$B$171,$C$171,D148>=$B$170,$C$170,0%)
Formula Explanation:
The condition D148>=$B$173 is checked first by the SWITCH function. If it is true, then it returns the value of cell $C$173. If the first condition is false, the formula checks the next condition D148>=$B$172. If this is true, then it returns the value of cell $C$172.
This pattern continues for the following conditions and their respective values. If none of the conditions are true, the default value returned is 0%.
We regret to inform you that we are currently unable to provide the video you requested. As we haven’t made any video on this topic.
If you have any specific questions or if you need further clarification, feel free to ask!
Regards,
Mizbahul Abedin
Team ExcelDemy
Dear KRIS,
Thanks for your feedback. We are extremely sorry that, we missed multiplying the formula by 2 (method-1). Now we have corrected the formula in the article, please try it now.
If you still have any queries, please let us know in the comment section or our forum.
Thanks and regards,
Md. Mizbahul Abedin
Excel & VBA Content Developer