What Is Economic Order Quantity?
It means the optimum level of order quantity, not higher or lower. Economic Order Quantity (EOQ) is a calculation that businesses use to determine how much they should order at once. This helps them avoid having too much inventory, which could cost them more money and take up unnecessary space. By calculating EOQ, inventory managers can find the right balance between meeting demand and controlling costs.
It does not matter if your company sells airplanes, jelly beans, appliances, or furniture. Finding the economic order quantity for any product you buy will probably impact revenue. Measuring and adhering to the EOQ can benefit any company that controls inventory.
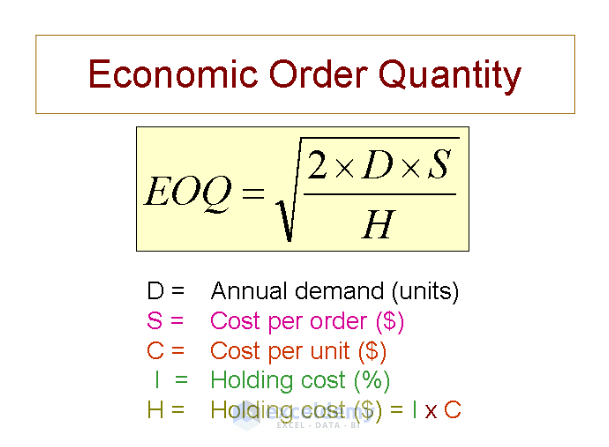
EOQ = SQRT(2D*S/H)
Here,
D= Total Demand
S=Total Ordering Cost
H=Total Holding Cost
Ordering Cost: Ordering cost is the cost of placing and receiving an order for inventory or goods. It includes all the expenses involved in the procurement process, such as the cost of paperwork, transportation, communication, and order processing. Ordering costs can also include costs associated with selecting suppliers, negotiating prices, and managing relationships with suppliers.
Holding Cost: Holding costs are the expenses incurred when merchandise remains unsold. Together with ordering and shortage charges, they are a component of overall inventory costs.
Step-by-Step Procedures
Step 1: Create a Dataset with Proper Parameters
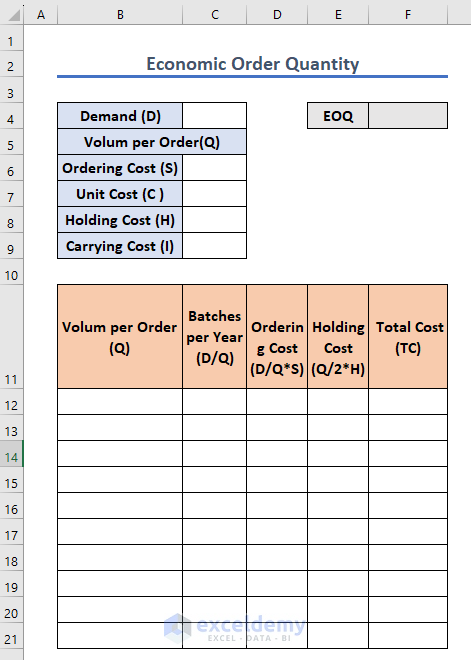
- Create a dataset like the picture below
The dataset includes input variables such as demand, volume per order, ordering cost, unit cost, holding cost, and carrying cost. These inputs are used to calculate EOQ.
Step 2: Determine the Demand
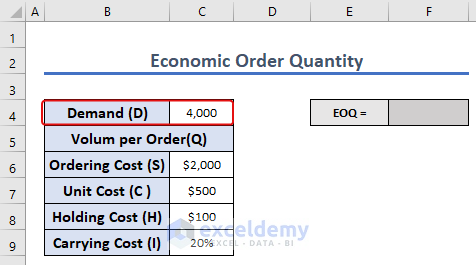
- Determine the demand for your upcoming sales. The demand may differ from company to company depending on the products or services.
- Enter the value of the demand in cell C4
Step 3: Calculate Holding Costs
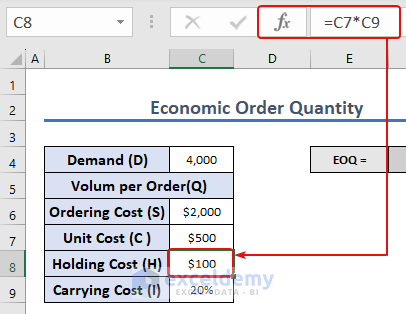
“Holding cost” means the total carrying or transportation and inventory costs of a product.
To calculate the holding cost, we have to multiply the unit cost and carrying cost. Here, cells C7 and C9 indicate the unit cost and carrying cost. The following image shows the value of holding costs.
Final Step: Determine Economic Order Quantity
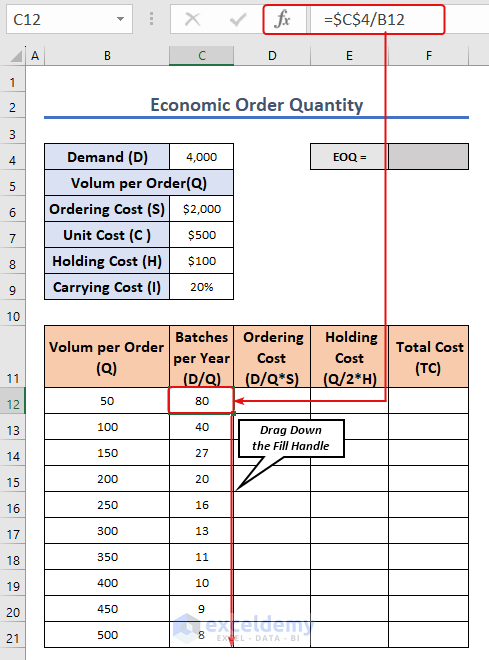
- To calculate the number of batches needed for a year.
- In our datasheet, to obtain the annual ordering cost and holding cost, we need a total batch number. To calculate the Batch Number, we have to divide the annual Demand by the Volume per Order. In the datasheet, cell C4 shows total Demand and cell B12:B21 means Volume per Order.
- We get the batches needed per year for the corresponding Volume per Order
Now, We have to determine the total ordering cost.
- Multiply “Batches per Year” and “Ordering Cost”(S)
- We will get the “Ordering cost” for each “Batches per Year.”
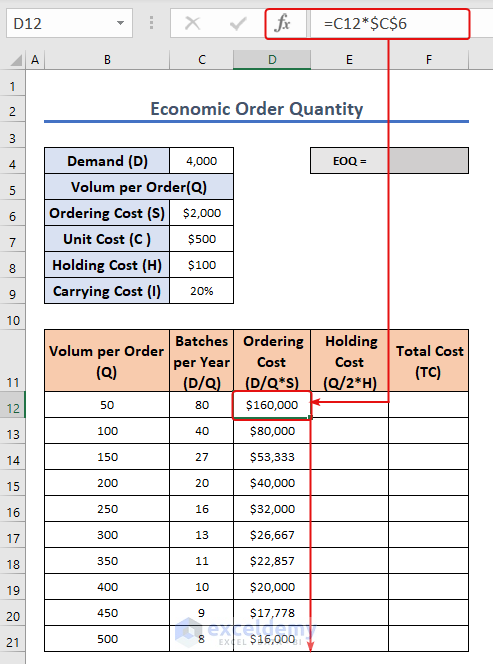
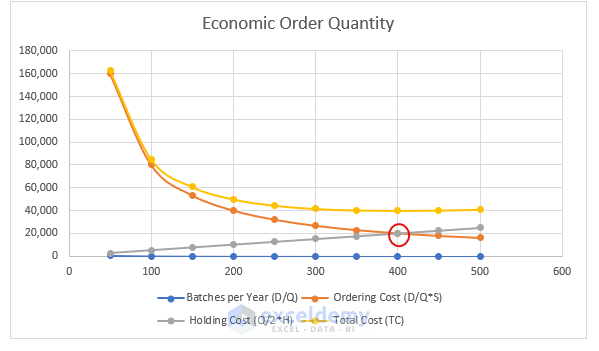
If you look at the chart, you will see that the Ordering Cost is decreasing for the higher volume per order.
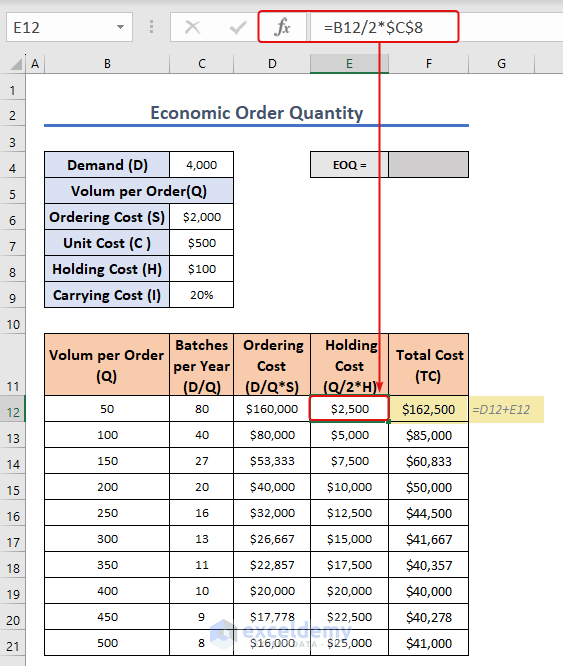
- For Holding Costs, enter the following formula for cell E12:
=B12/2*$C$8
- Sum up the corresponding Ordering and Holding Costs to calculate the Total Cost
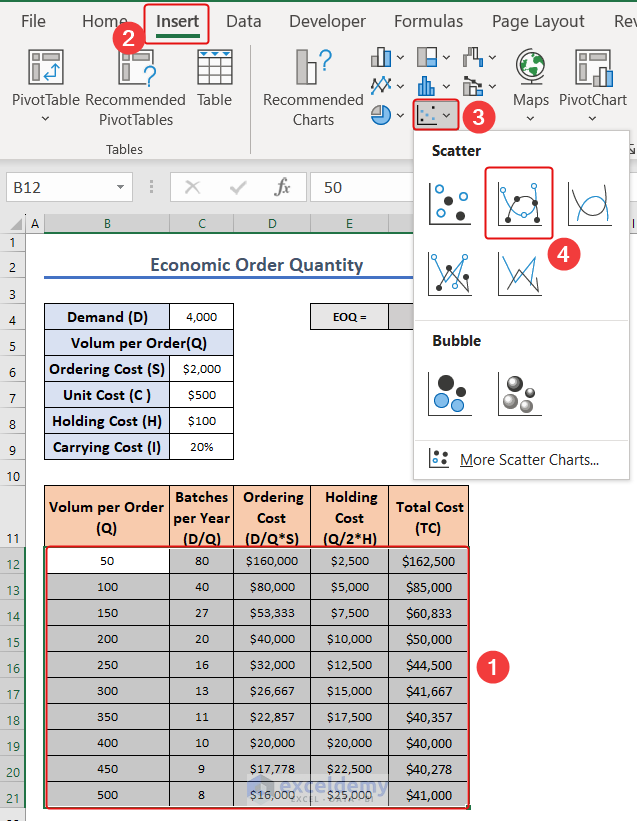
We will try to determine the EOQ point using a scatter diagram.
- Select cells B12:F21.
- Go to Insert >> Scatter Diagram
- Select the diagram like the image below.
- A diagram will appear, like the following image.
If you take a close look at the diagram, you’ll notice that the lines indicating Ordering costs and holding costs intersect.
The intersecting point is the EOQ point, which has a value of 400 on the X-axis.
The Economic Order Quantity of this dataset is 400.
Alternative Way
If you are using a minimal dataset,
- Enter the following formula:
EOQ = SQRT(2D*S/H)
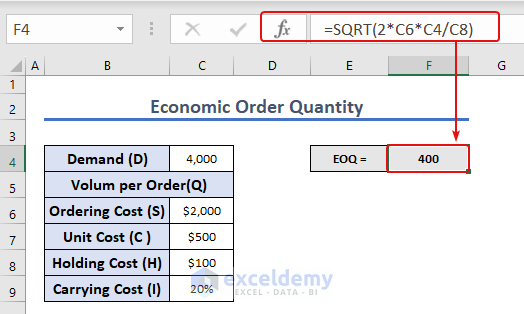
- Select cell F4 and enter the formula:
=SQRT(2*C6*C4/C8)
- The outcome is 400.
Things to Remember
Use consistent units: To avoid errors in calculations, ensure that all inputs, such as demand, ordering costs, and holding costs, are in the same units, such as dollars or units.
Check for errors: Double-check your formulas and calculations to avoid errors. Use Excel’s built-in auditing tools, such as trace precedents and dependents, to ensure that all formulas are correct and properly linked.
By keeping these things in mind, you can calculate EOQ in Excel accurately and use the model to make informed decisions about inventory management that can help minimize costs and maximize profits.
Download the Practice Workbook
Download this workbook to practice.
Related Articles
- How to Keep Track of Inventory in Excel
- How to Maintain Store Inventory in Excel
- How to Make Inventory Aging Report in Excel
- How to Create Inventory Database in Excel
- Min Max Inventory Calculation in Excel
- How to Calculate Stock to Sales Ratio Using Formula in Excel
<< Go Back to Inventory Management in Excel | Learn Excel
Get FREE Advanced Excel Exercises with Solutions!
