Having a comprehensive picture of the leads and sales in a sales pipeline may undoubtedly boost conversion and sales rates. However, this may result in having to purchase expensive, sophisticated software. This article shows how to create a weighted sales pipeline in Excel using a step-by-step process that takes this into account.
Introduction to Sales Pipeline
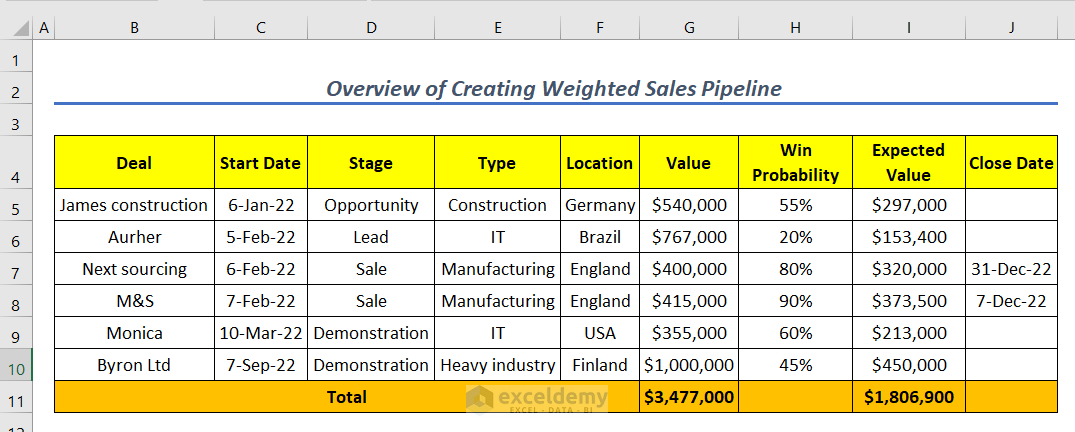
The Weighted Sales Pipeline acknowledges the fact that not all opportunities lead to sales. It is a more comprehensive sales forecasting tool that gives each opportunity a value based on where it is in the sales funnel.
How to Create a Weighted Sales Pipeline in Excel: Step-by-Step Procedures
This post will teach you how to use the SUM and SUMIF functions as well as Mathematical formulas to generate a weighted sales pipeline and how to create a funnel diagram. Now just go through the following instructions and the illustration step-by-step.
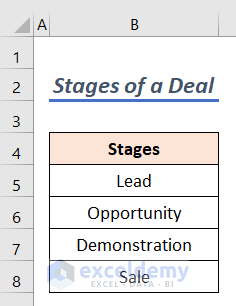
Step 1: Create a Dataset with Proper Parameters
- First, enter the various stages of a deal in the “Stages” worksheet. For example, we’ve entered 4 stages of a deal. Such as lead, opportunity, demonstration, and sale.
Step 2: Insert Basic information
- Secondly, Fill up the basic info of the various organizations on your worksheet. We entered 5 deals here.
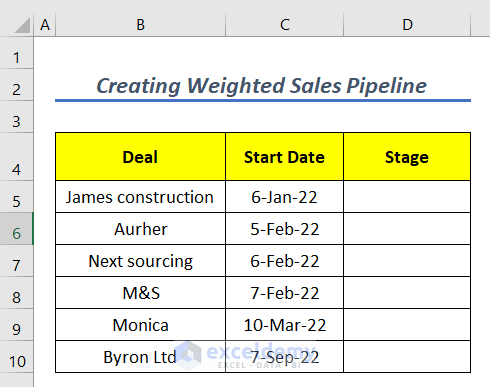
- Now, watch the animated GIF below to see how to enter the “Stages” into a Data Validation list in real-time.
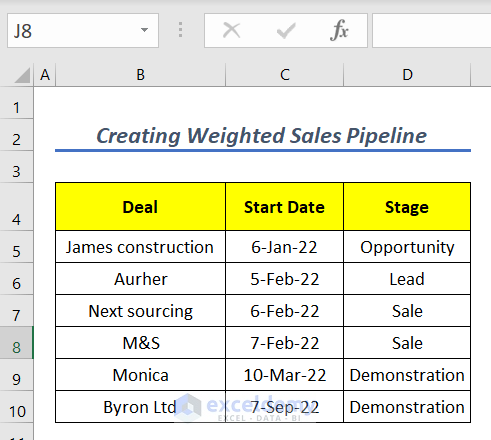
- Next, Click the drop-down to choose a stage for each contract.
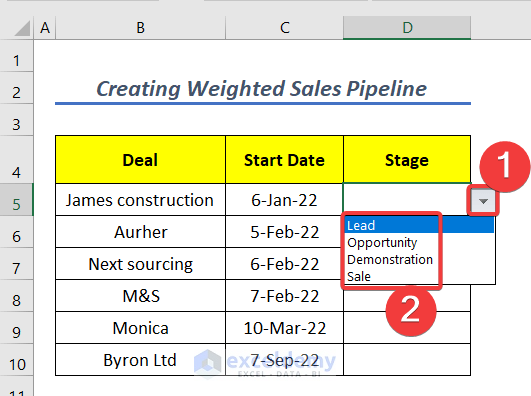
- Once the “Stage” for each “Deal” has been entered, the outcomes should look like the image below.
Step 3: Calculate the Total Value
Use the following expression to calculate the “Expected Value”.
- Insert the following formula into cell I5.
=G5*H5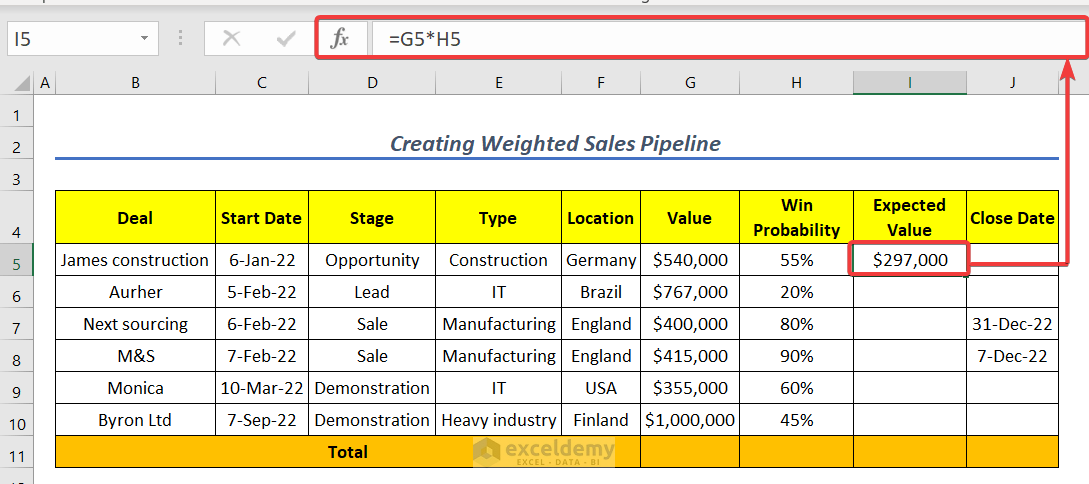
- The “Value” and “Win Probability” values are indicated by the G5 and H5 cells in this example.
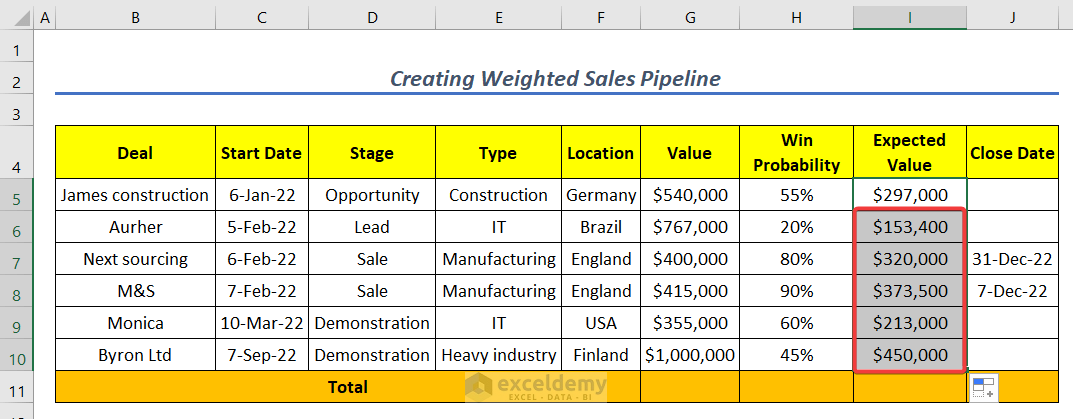
- Autofill the column up to cell I10 as in the image below.
- After that, we use the SUM function to calculate the “Total Value.”
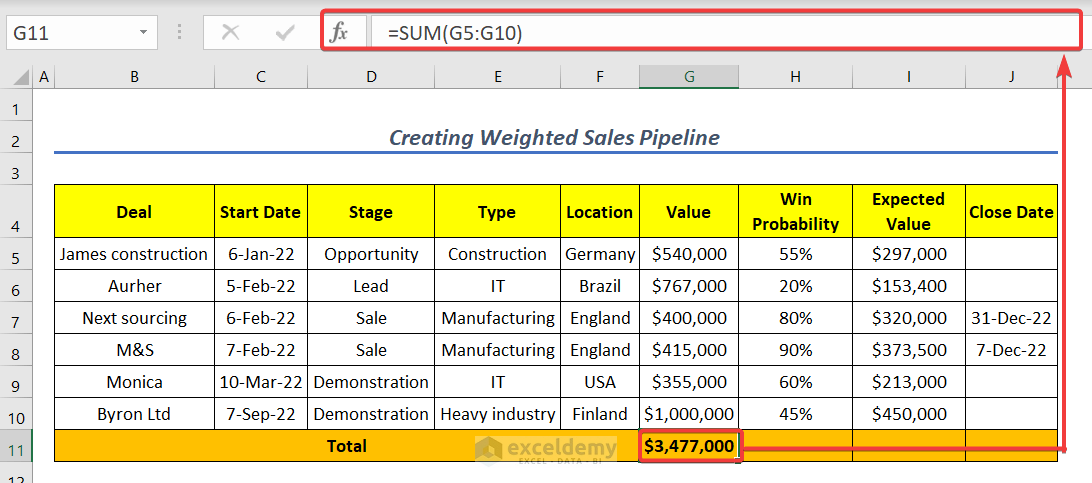
- Hence, write down the below formula in the cell
=SUM(G5:G10)- Here, G5:G10 indicates the “Value” of the column.
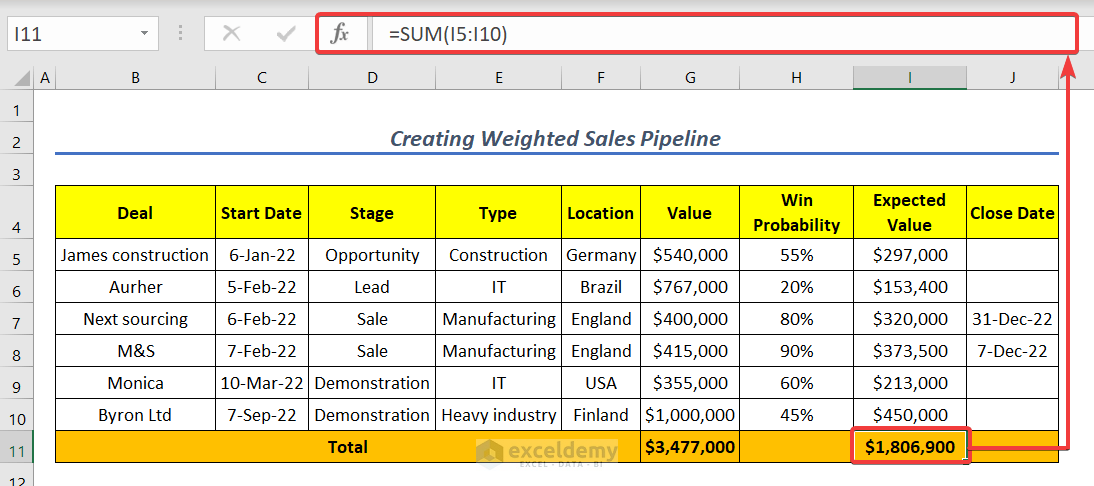
- Afterward, insert the following formula to obtain the “Total Expected Value”.
=SUM(I5:I10)- In this case, the “Expected Value” column is represented by the I5:I10 array.
Step 4: Create a Funnel Diagram
To generate a funnel diagram, first, go to the “Funnel Chart” worksheet >> go to cell C5 >> insert the SUMIF function in the Formula bar and write the following formula.
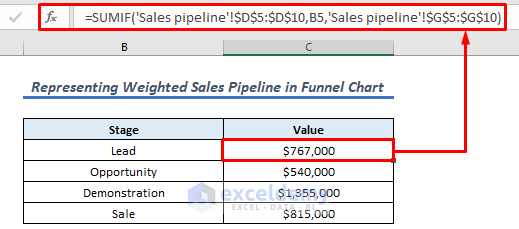
- SUMIF(‘Sales Pipeline’!$D$5:$D$10, B5,’ Sales Pipeline’!$G$5:$G$10) adds the cells that meet the criteria or conditions supplied. Here, the “Stage” column in the “Sales Pipeline” worksheet is referred to via the range argument D5:D10. Then, the “Lead” criteria argument to apply within the specified range is represented by the B5 cell. The final input, G5:G10, specifies the values to sum within the range and is optional.
- The Output is $767000.
Note
Please be sure that you press the F4 key on your keyboard to use Absolute Cell Reference.
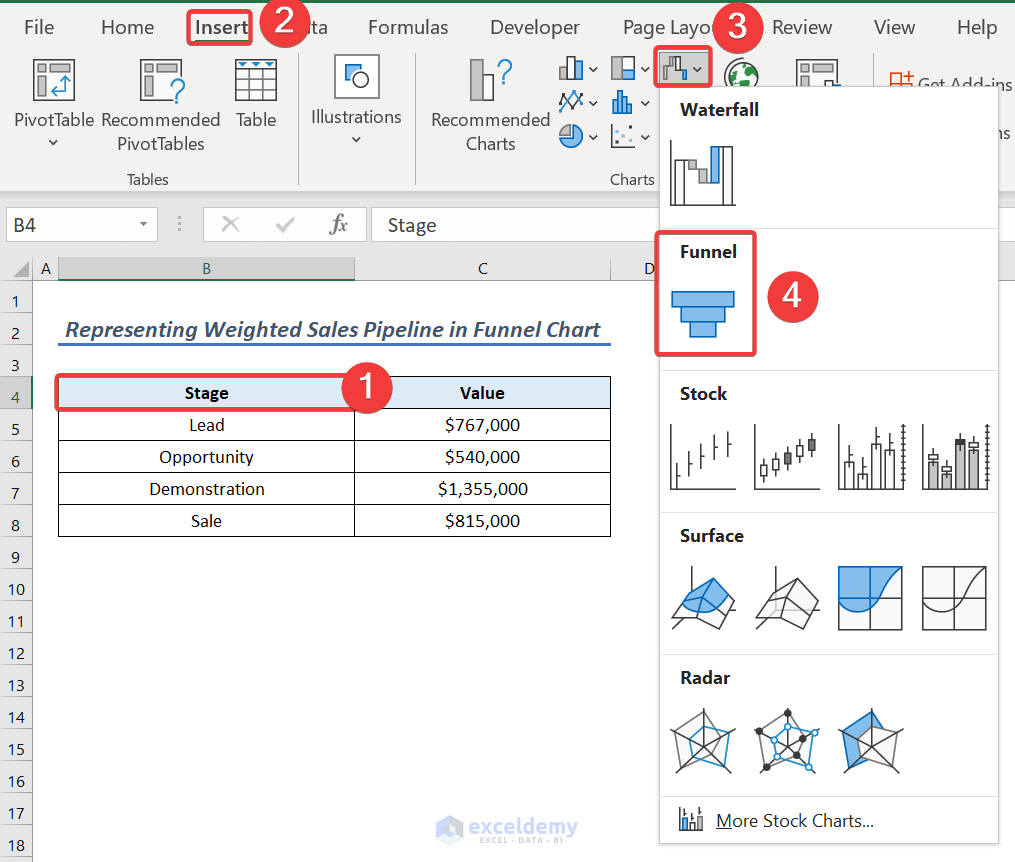
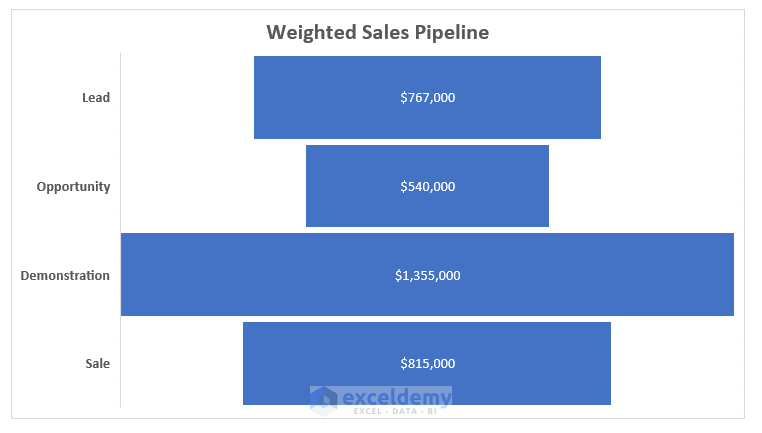
- Now, select cell B4 >> click Insert tab >> you will see the funnel logo, click on that logo and insert the Funnel chart.
- Finally, the Funnel Chart will appear before you like the following image.
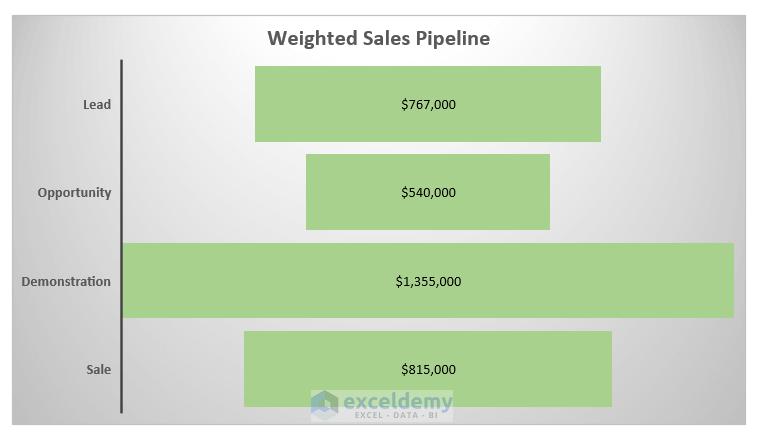
Note
You can use Ctrl + 1 key to customize the Funnel or use the Right Click of your mouse after selecting the Funnel Diagram. We have customized a Funnel Diagram like the image below.
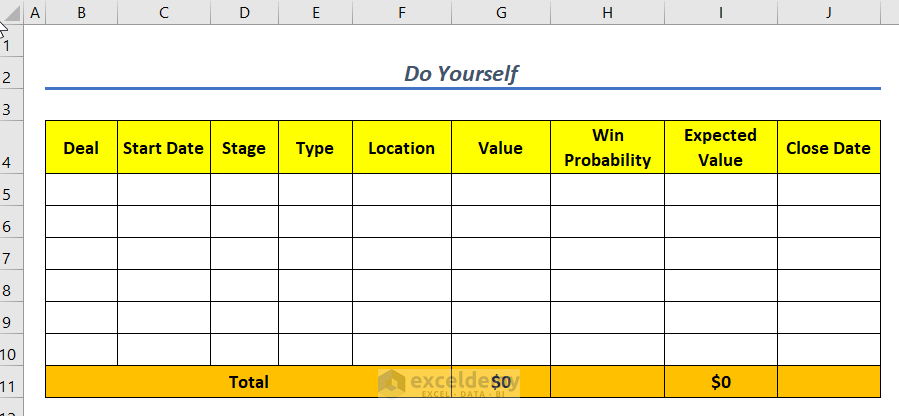
Practice Section
For your Practice, we’ve included a place marked “Practice Sheet” on the right side of each sheet. Don’t forget to complete it alone.
Download Practice Workbook
Download this practice workbook to exercise while you are reading this article.
Conclusion
In essence, this lesson covers every aspect of creating a weighted sales pipeline in Excel. Now that you know all the methods, we hope you will apply them to your Excel spreadsheets more successfully. Please don’t hesitate to leave any comments or questions in the space below.
Related Articles
<< Go Back to Excel Sales Pipeline Templates | Excel Sales Templates | Excel Templates
Get FREE Advanced Excel Exercises with Solutions!
