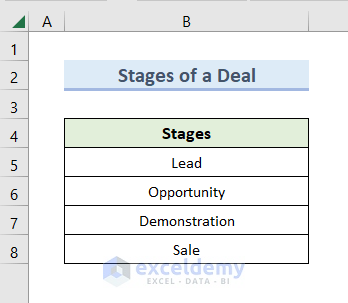
STEP 1 – Create a List of Stages of the Deal
- A list of 4 stages is created.
- Lead indicates that the deal is in the primary stage.
- Opportunity indicates a contact and a good opportunity to make a deal.
- Demonstration indicates the deal was presented to the company and waiting for a response.
- Sale means the deal is completed.
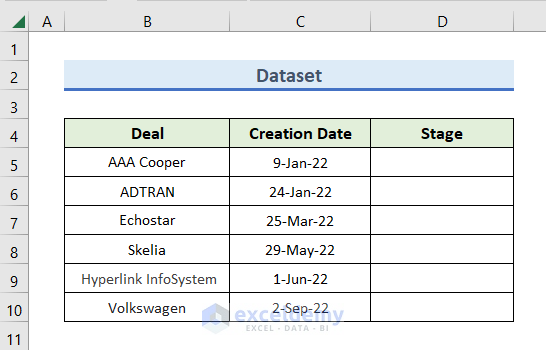
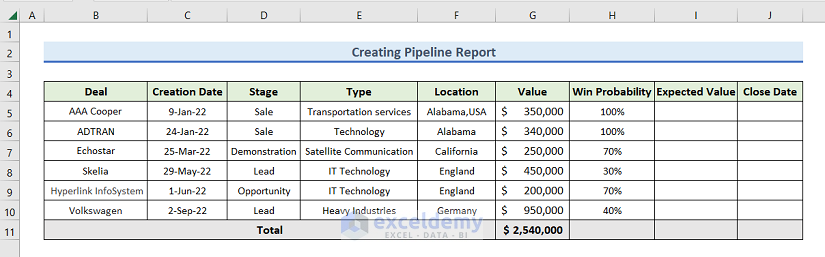
- Enter the deal information:
- The name of the company in the Deal column.
- In the Creation Date column, enter the dates in the database.
- In the Stage column, enter the conditions of the deal. (this column will be accessed through the worksheet containing the stages of the deal .
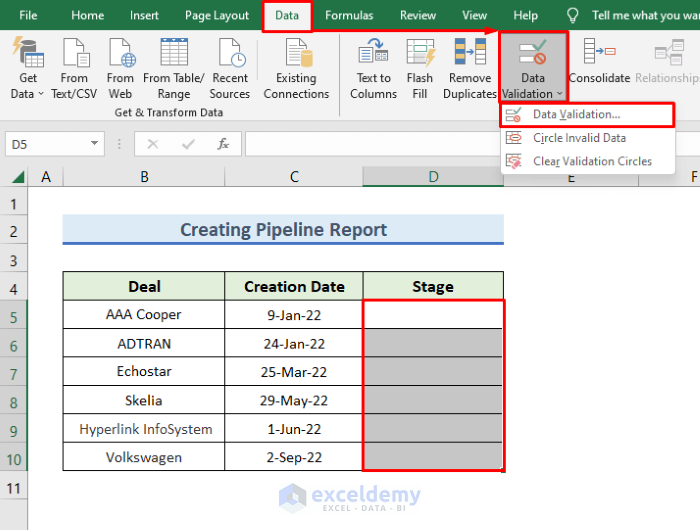
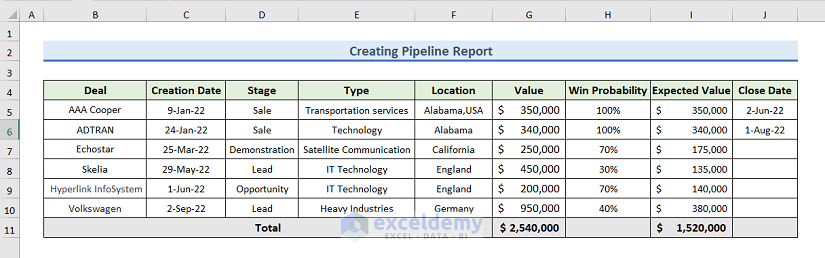
STEP 2 – Enter Data to Create a Pipeline Report
- Select the Stage column. Here, D5:D10.
- Go to the Data tab and click Data Validation >> Data Validation in Data Tools.
- Select List in Allow.
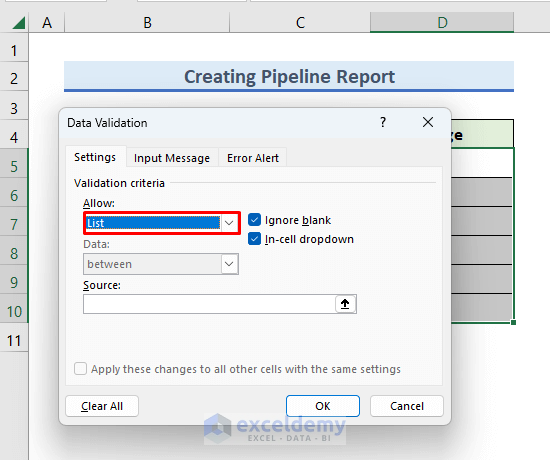
- Enter the following formula in Source:
=Stages!$B$5:$B$8
- Click OK.
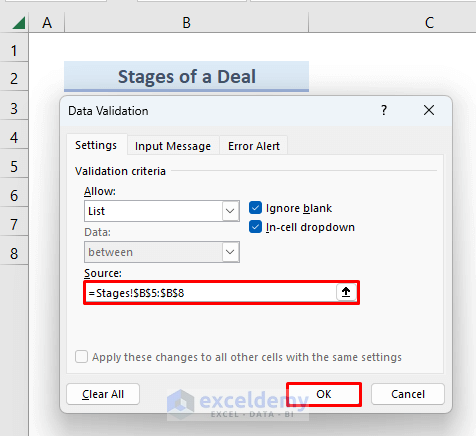
Stages is the Excel sheet name containing the Stages of the Deal.
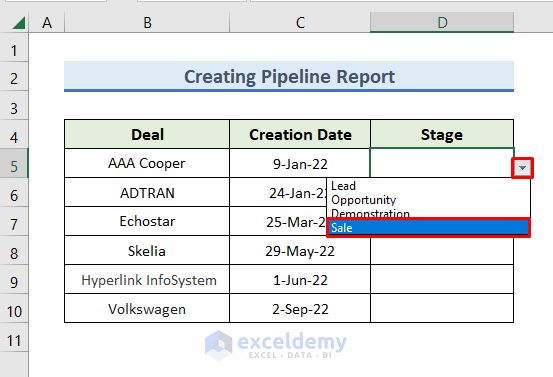
- In the Stage column, a drop-down menu is displayed.
- Clicking the drop-down menu will display 4 options.
- Select an option according to the progress.
- Here, Sale.
- The Stage of the AAA Cooper company is displayed in Sale.
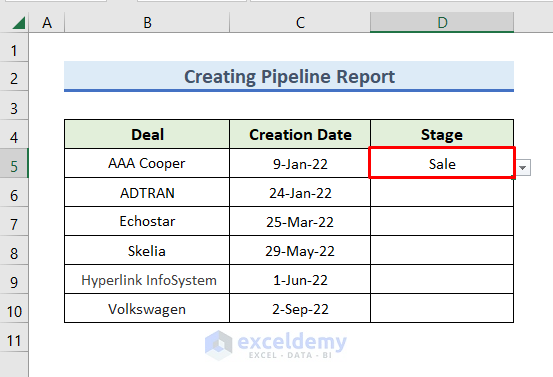
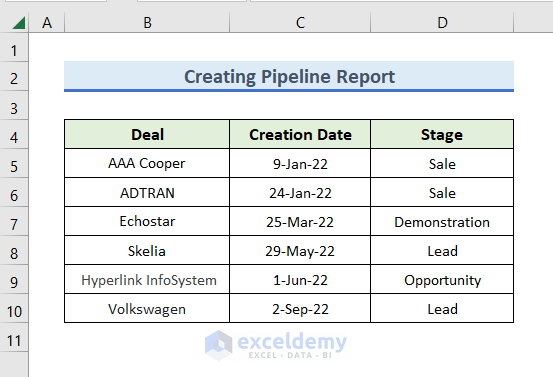
- Enter data in the Stage column, according to the deal progress, selecting the companies from the drop-down menu .
- Create the Type, Location, Value, Win Probability, Expected Value, and Close Date columns.
- Enter data from the database.
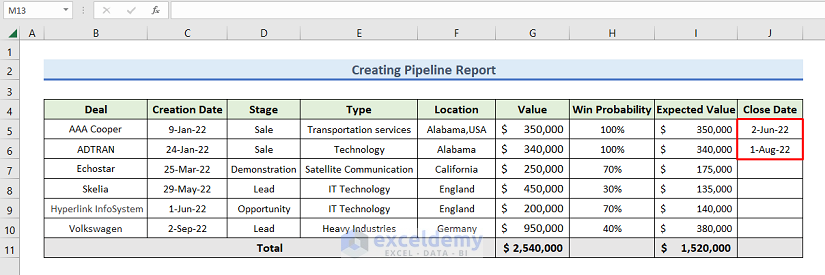
STEP 3 – Calculate the Output
- Enter following formula to calculate the expected value in I5:
=G5*H5
- Press Enter to calculate the result.
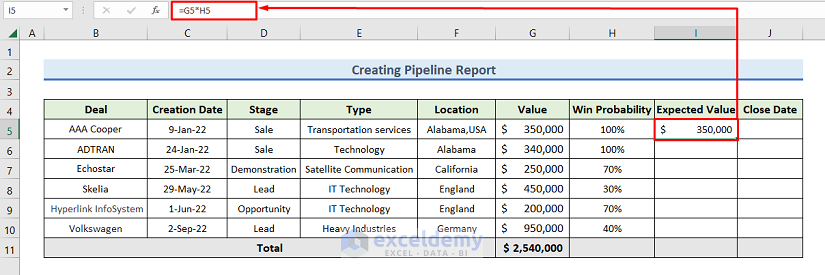
the Expected Value results from the multiplication of the Value and Win Probability of the company.
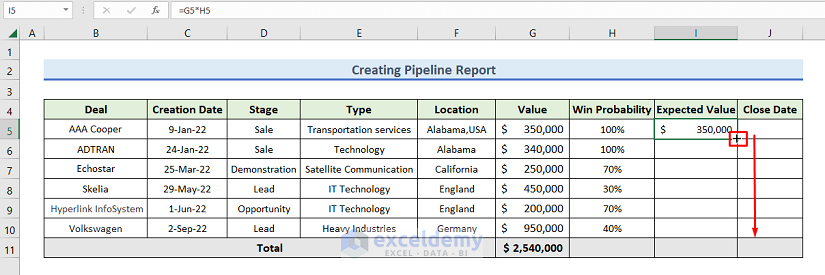
- Drag down the Fill Handle to fill all cells with the formula.
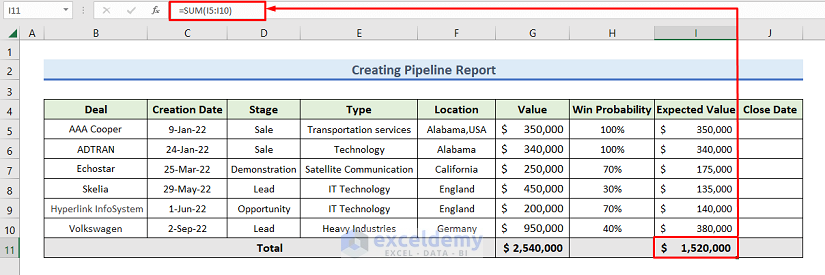
- To sum the Expected Value and get the Total Expected Value, enter the following formula in I11:
=SUM(I5:I10)
- Press Enter to see the result.
- Enter the closing date of the completed deals.
- Go back to the Stages worksheet.
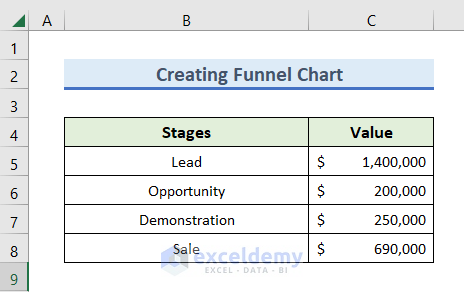
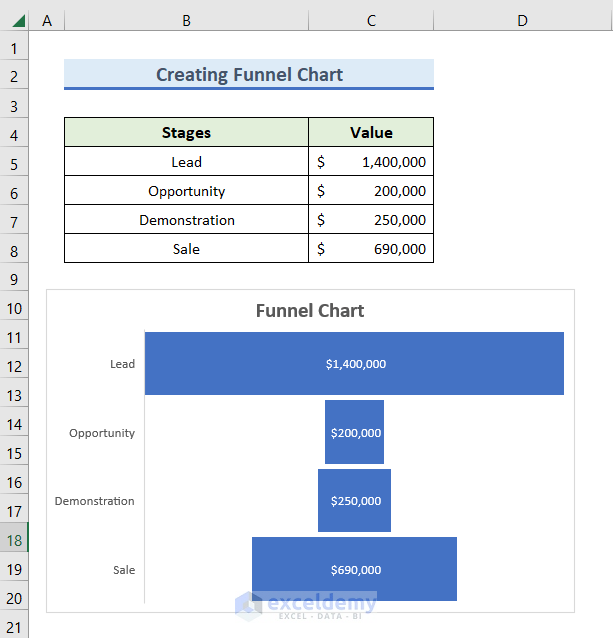
- Add a column named Value to calculate the amount in the Lead, Opportunity, Demonstration, and Sale levels.
- To sum the values in the Lead level, enter the following formula in C5:
=SUMIF('Pipeline Report'!$D$5:$D$10,B5,'Pipeline Report'!$G$5:$G$10)
- Press Enter to see the output.
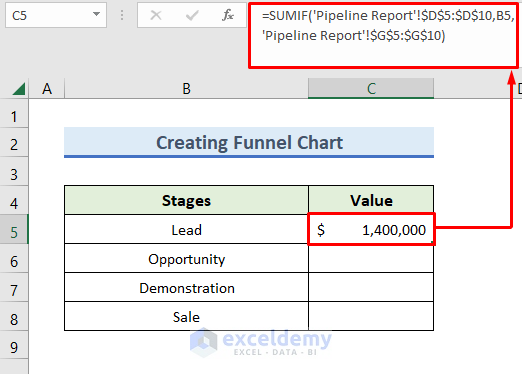
The formula adds the cells specified by the given criteria. D5:D10 is the range argument that refers to the “Stage” column in the “Pipeline Report” worksheet, which was previously created. B5 represents the criteria argument “Lead” to apply within the given range. G5:G10 is the optional sum_range argument that indicates the values to sum within the range.
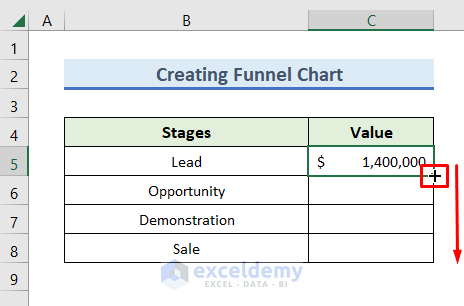
- Drag down the Fill Handle to see the result in the rest of the cells.
STEP 4 – Create a Funnel Chart
- Go to the Insert tab and click the icon shown below.
- Select Funnel in Charts.
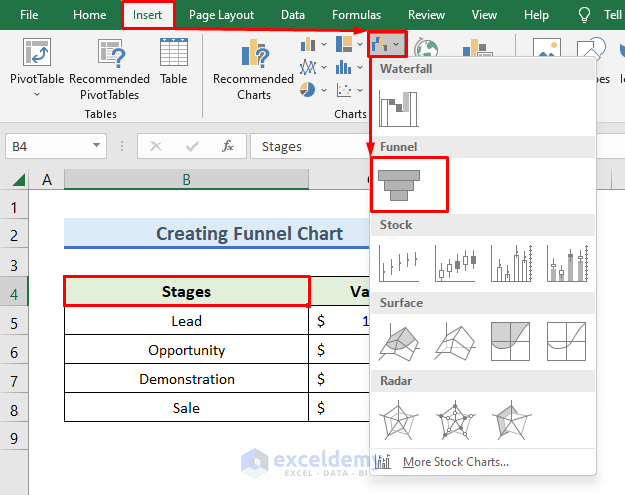
- The Funnel Chart is displayed.

Final Output
There are two outputs: the Pipeline report:
and the Funnel Chart:
Download Practice Workbook
Download the following workbook.
Related Article
<< Go Back to Excel Sales Pipeline Templates | Excel Sales Templates | Excel Templates
Get FREE Advanced Excel Exercises with Solutions!
