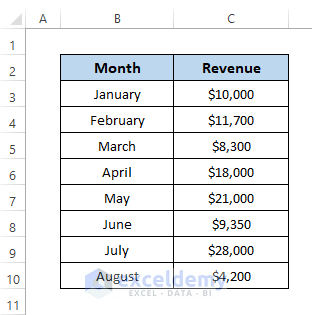
The sample dataset showcases a company’s monthly revenue over 9 month.
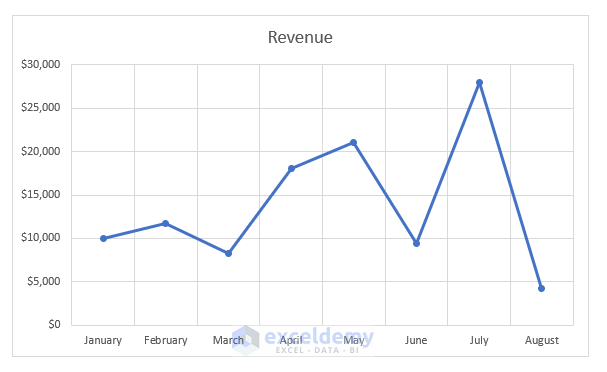
To create a graph:
- Go to Insert > Charts.
Method 1 – Using the Delete Key or Delete Option to Remove the Gridlines from the Graph
STEPS:
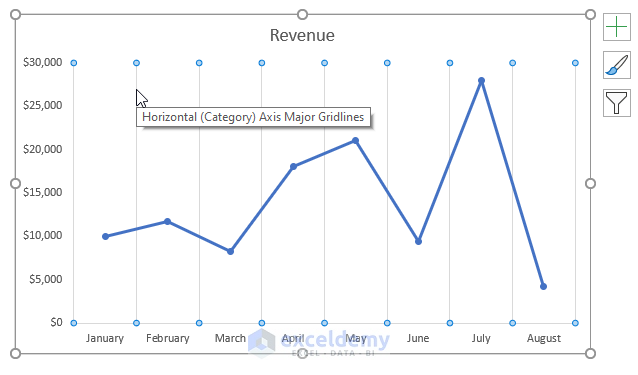
- Select any gridlines by clicking one of them (except the first one).
- Right-click and press Delete.
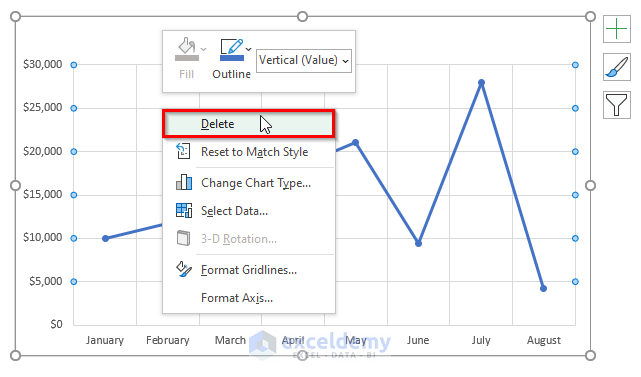
- You can also select the Vertical (Value) Axis Major Gridlines and press Delete.
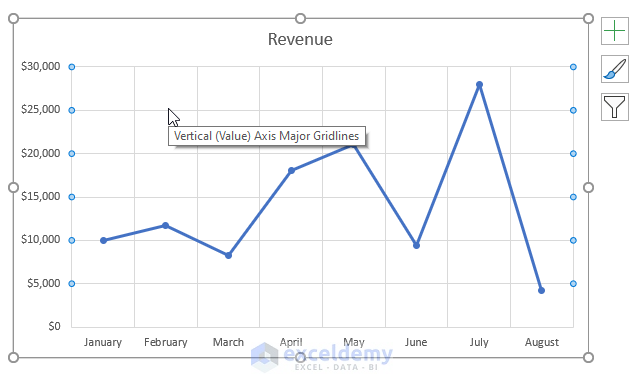
- To remove the horizontal gridlines, click the Horizontal (Value) Axis Major Gridlines and press Delete.
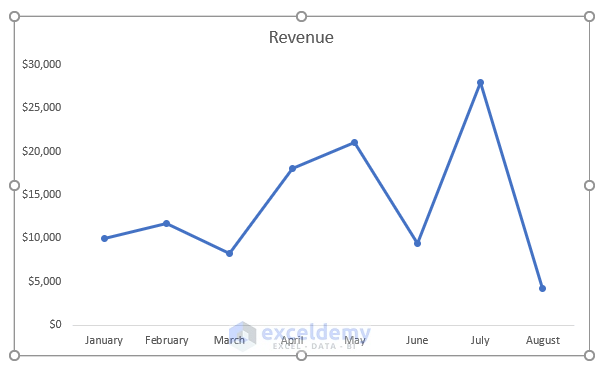
This is the output.
Read More: How to Add Vertical Gridlines to Excel Chart
Method 2 – Clearing Gridlines from a Graph using the Quick Layout Option in Excel
STEPS:
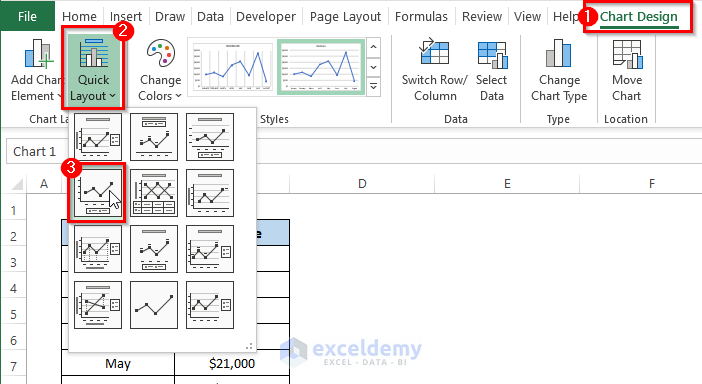
- Click the graph and go to Chart Design.
- In Chart Layouts, click Quick Layout.
- Select a layout that does not contain gridlines. Here, Layout 4.
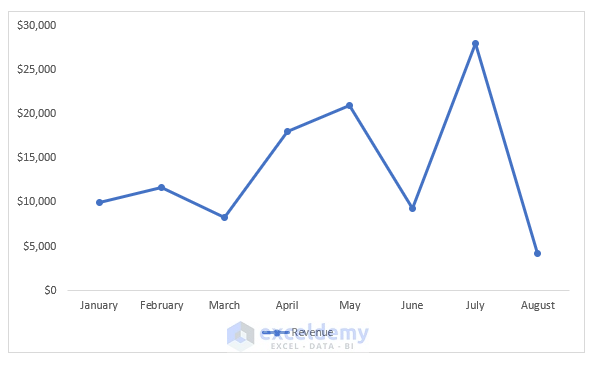
This is the output.
Method 3 – Delete Gridlines using the Chart Elements
STEPS:
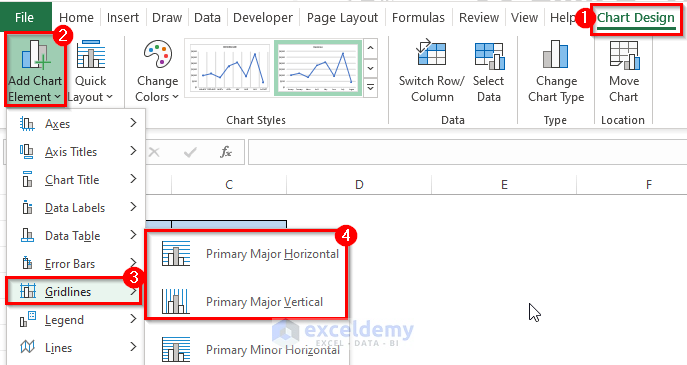
- Click the graph and go to Chart Design.
- Click Add Chart Element in Chart Layouts.
- Click the Gridlines and select Primary Major Horizontal or Primary Major Vertical.
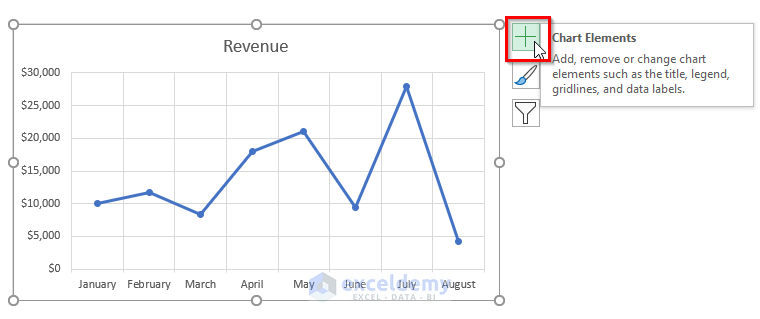
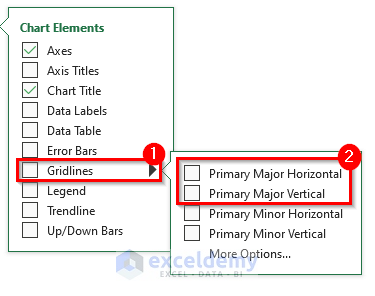
- You can also click the Plus (+) sign: Chart Elements.
- Uncheck Gridlines or Primary Major Horizontal or Primary Major Vertical.
This is the output.
Method 4 – Using the Format Gridlines Feature to Remove the Gridlines from an Excel Graph
STEPS:
- Click any gridline and right-click.
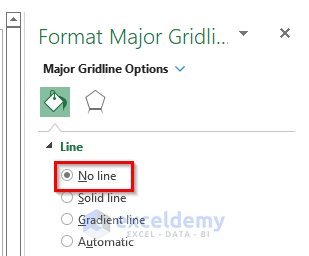
- Select Format Gridlines.
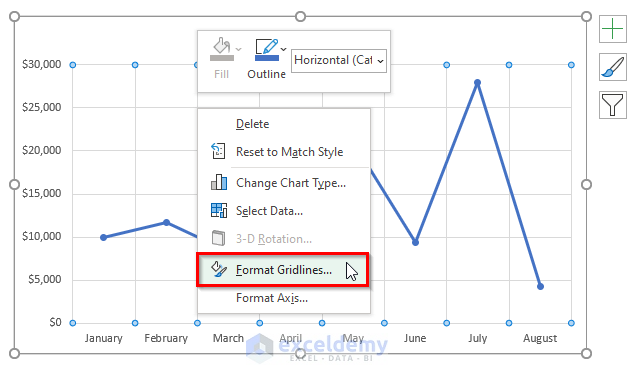
- Choose No line to remove all gridlines.
This is the output.
Method 5 – Using Excel VBA to Remove the Gridlines from an Excel Graph
STEPS:
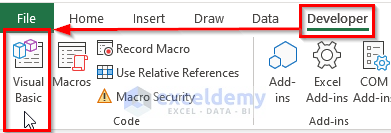
- Go to the Developer tab.
- In Code, click Visual Basic to open the Visual Basic Editor.
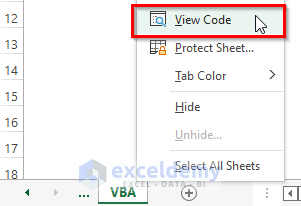
- You can also press Alt + F11 to open the Visual Basic Editor or right-click the worksheet and go to View Code.
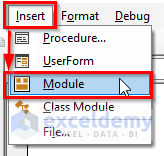
- Click Module in Insert.
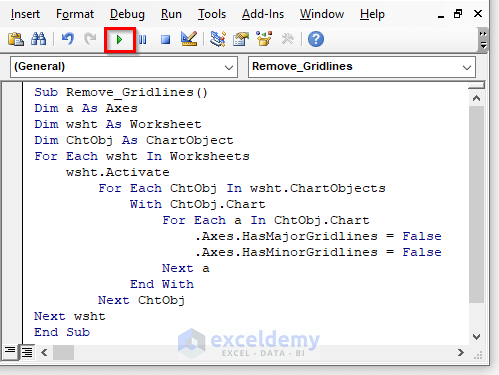
- Enter the VBA code below.
VBA Code:
Sub Remove_Gridlines()
Dim a As Axes
Dim wsht As Worksheet
Dim ChtObj As ChartObject
For Each wsht In Worksheets
    wsht.Activate
        For Each ChtObj In wsht.ChartObjects
            With ChtObj.Chart
                For Each a In ChtObj.Chart
                    .Axes.HasMajorGridlines = False
                    .Axes.HasMinorGridlines = False
                Next a
            End With
        Next ChtObj
Next wsht
End Sub- Run the code by clicking RubSub or pressing F5.
This is the output.
Download Practice Workbook
Download the workbook and practice.
Related Articles
- How to Add Primary Major Horizontal Gridlines in Excel
- How to Add Primary Major Vertical Gridlines in Excel
- How to Add Gridlines to a Graph in Excel
- How to Adjust Chart Gridlines Spacing in Excel
- How to Make Square Grid Lines in Excel Graph
- How to Adjust Gridlines in Excel Chart
<< Go Back To Gridlines in Excel Chart | Excel Chart Elements | Excel Charts | Learn Excel
Get FREE Advanced Excel Exercises with Solutions!
