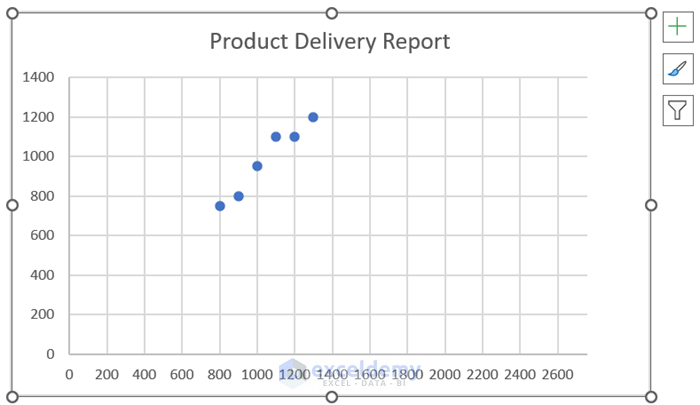
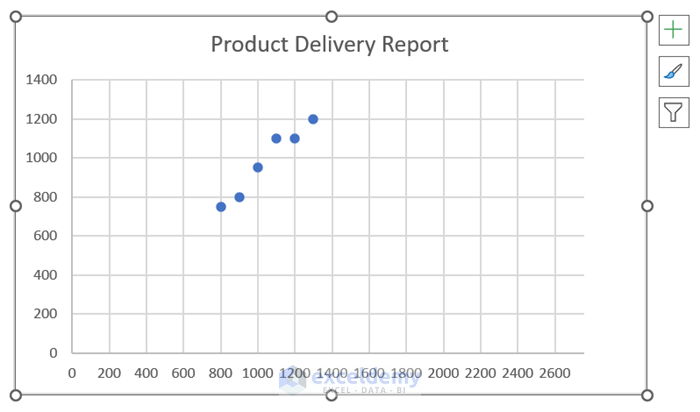
The following dataset is a Product Delivery Report. We will use this dataset to generate an Excel Graph.
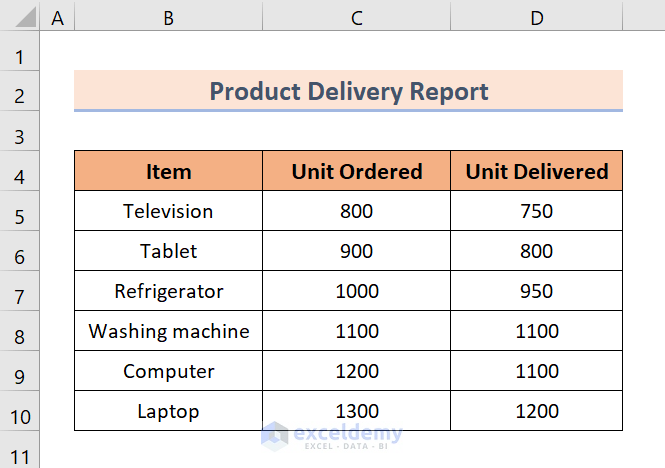
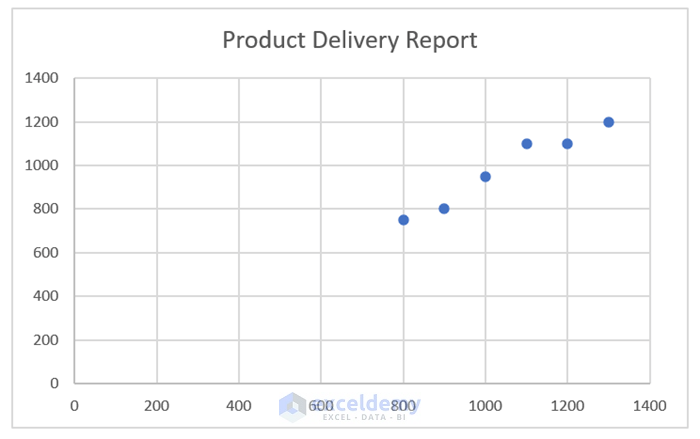
This graph has the traditional rectangular grid. We will use this graph to make square grid lines in an Excel graph.
Method 1 – Changing Axis Scales to Make Square Grid Lines in a Graph
Steps:
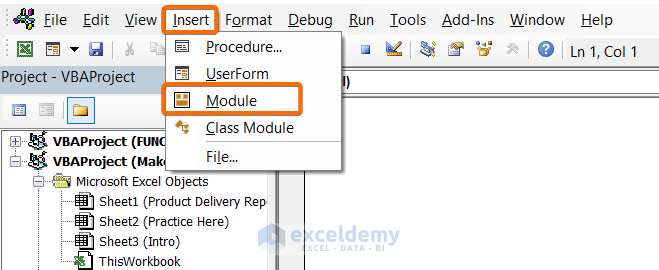
- Press ALT + F11 to open the VBA Editor.
- Go to Insert ➤ Module to create a new module.
- Insert the following code in the newly opened module:
Sub Changing_Axis_Scales()

  If Not ActiveChart Is Nothing Then
    ChangingAxisScales ActiveChart

  ElseIf TypeName(Selection) = "DrawingObjects" Then
    Dim zshp As Shape
    For Each zshp In Selection.ShapeRange
      If zshp.HasChart Then
        ChangingAxisScales zshp.Chart
      End If
    Next

  Else
    MsgBox "No Chart selected. Please select at least one.", vbExclamation, "Warning!"
  End If

End Sub

Function ChangingAxisScales(zChart As Chart)

  With zChart
    With .PlotArea
      Dim xplotInHt As Double, xplotInWd As Double
      xplotInHt = .InsideHeight
      xplotInWd = .InsideWidth
    End With

    With .Axes(xlValue)
      Dim Ymax1 As Double, Ymin1 As Double, Ymaj1 As Double
      Ymax1 = .MaximumScale
      Ymin1 = .MinimumScale
      Ymaj1 = .MajorUnit
      .MaximumScaleIsAuto = False
      .MinimumScaleIsAuto = False
      .MajorUnitIsAuto = False
    End With

    With .Axes(xlCategory)
      Dim Xmax1 As Double, Xmin1 As Double, Xmaj1 As Double
      Xmax1 = .MaximumScale
      Xmin1 = .MinimumScale
      Xmaj1 = .MajorUnit
      .MaximumScaleIsAuto = False
      .MinimumScaleIsAuto = False
      .MajorUnitIsAuto = False
    End With

    Dim Ytic1 As Double, Xtic1 As Double
    Ytic1 = xplotInHt * Ymaj1 / (Ymax1 - Ymin1)
    Xtic1 = xplotInWd * Xmaj1 / (Xmax1 - Xmin1)

    If Xtic1 > Ytic1 Then
      .Axes(xlCategory).MaximumScale = xplotInWd * Xmaj1 / Ytic1 + Xmin1
    Else
      .Axes(xlValue).MaximumScale = xplotInHt * Ymaj1 / Xtic1 + Ymin1
    End If
  End With

End Function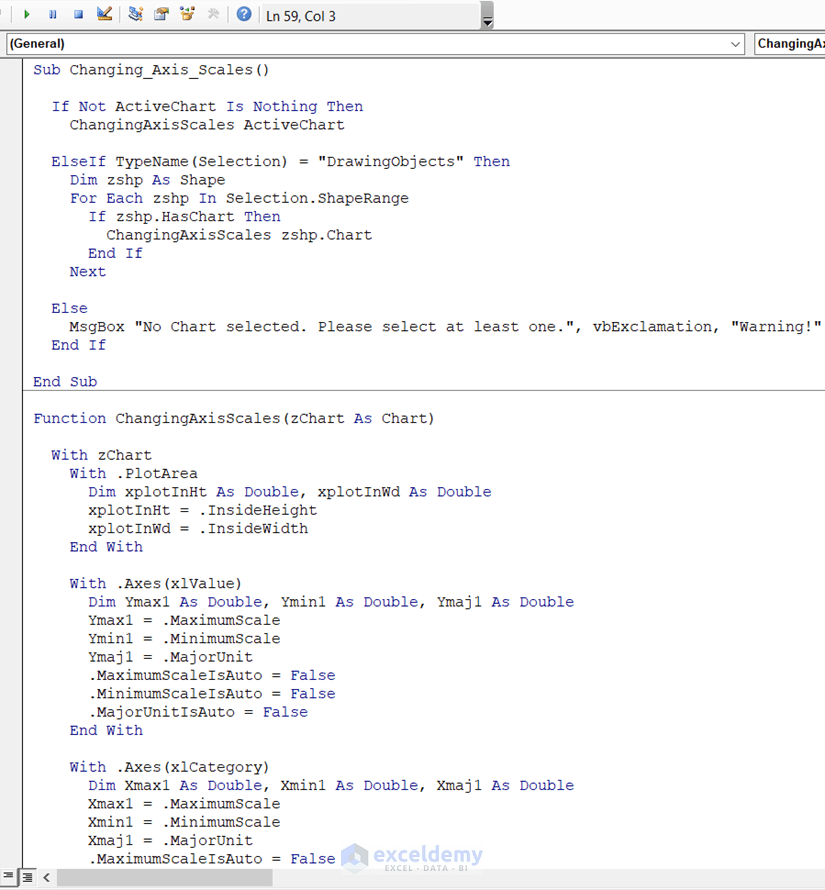
- Go back to your worksheet and click on your Excel graph to select it.
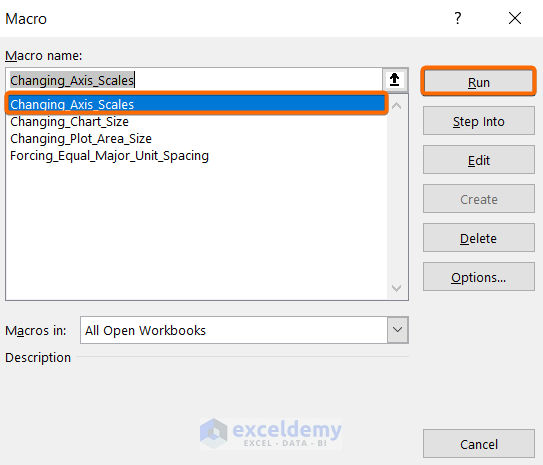
- Press ALT + F5 to open the Macro window.
- Select the macro Changing_Axis_Scales and hit the Run button.
The VBA code will run. The code will make your rectangular grid lines square, just like the picture below:
Method 2 – Forcing Equal Major Unit Spacing for Square Grid Lines
Steps:
- Press ALT + F11 to open the VBA Editor.
- Go to Insert ➤ Module to create a new module.
- Insert the following code in the newly opened module:
Sub Forcing_Equal_Major_Unit_Spacing()

  If Not ActiveChart Is Nothing Then
    ForcingEqualMajorUnitSpacing ActiveChart, True

   ElseIf TypeName(Selection) = "DrawingObjects" Then
    Dim zshp As Shape
    For Each zshp In Selection.ShapeRange
      If zshp.HasChart Then
        ForcingEqualMajorUnitSpacing zshp.Chart
      End If
    Next

  Else
    MsgBox "No Chart selected. Please select at least one.", vbExclamation, "Warning!"
  End If

End Sub

Function ForcingEqualMajorUnitSpacing(xChart As Chart, Optional xEqualMajorUnit As Boolean = False)

  With xChart
    With .PlotArea
      Dim plotInHt1 As Double, plotInWd1 As Double
      plotInHt1 = .InsideHeight
      plotInWd1 = .InsideWidth
    End With

    With .Axes(xlValue)
      Dim Ymax1 As Double, Ymin1 As Double, Ymaj1 As Double
      Ymax1 = .MaximumScale
      Ymin1 = .MinimumScale
      Ymaj1 = .MajorUnit
      .MaximumScaleIsAuto = False
      .MinimumScaleIsAuto = False
      .MajorUnitIsAuto = False
    End With

    With .Axes(xlCategory)
      Dim Xmax1 As Double, Xmin1 As Double, Xmaj1 As Double
      Xmax1 = .MaximumScale
      Xmin1 = .MinimumScale
      Xmaj1 = .MajorUnit
      .MaximumScaleIsAuto = False
      .MinimumScaleIsAuto = False
      .MajorUnitIsAuto = False
    End With

    If xEqualMajorUnit Then
      Xmaj1 = WorksheetFunction.Min(Xmaj1, Ymaj1)
      Ymaj1 = Xmaj1
      .Axes(xlCategory).MajorUnit = Xmaj1
      .Axes(xlValue).MajorUnit = Ymaj1
    End If

    Dim Ytic1 As Double, Xtic1 As Double
    Ytic1 = plotInHt1 * Ymaj1 / (Ymax1 - Ymin1)
    Xtic1 = plotInWd1 * Xmaj1 / (Xmax1 - Xmin1)

    If Xtic1 > Ytic1 Then
      .Axes(xlCategory).MaximumScale = plotInWd1 * Xmaj1 / Ytic1 + Xmin1
    Else
      .Axes(xlValue).MaximumScale = plotInHt1 * Ymaj1 / Xtic1 + Ymin1
    End If
  End With

End Function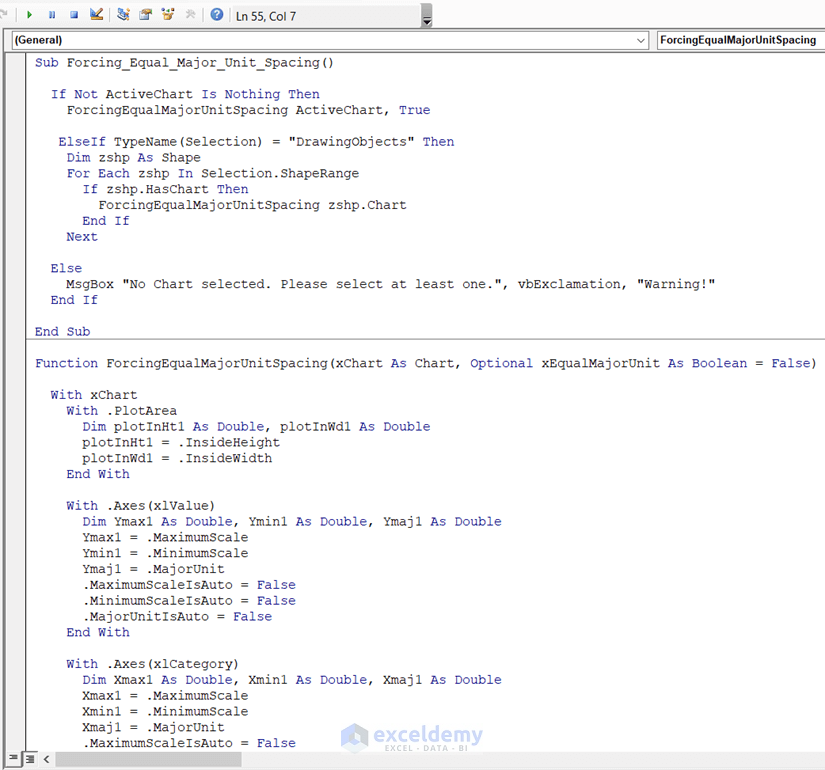
- Go back to your worksheet and click on your Excel graph to select it.
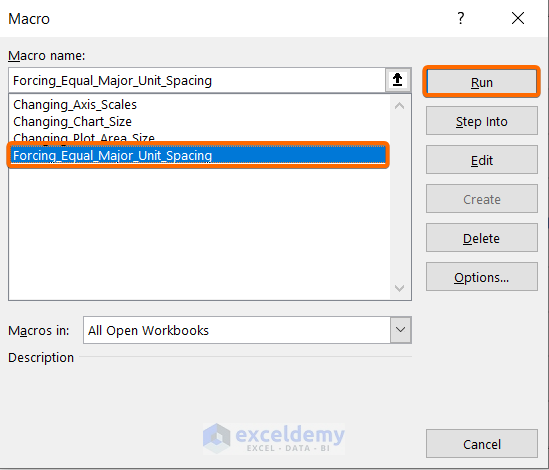
- Press ALT + F5 to open the Macro window.
- Select the macro Forcing_Equal_Major_Unit_Spacing and hit the Run button.
The VBA code will run. The code will make your rectangular grid lines square, just like the picture below:
Read More: How to Adjust Gridlines in Excel Chart
Method 3 – Creating Square Grid Lines by Changing Plot Area Size
Steps:
- Press ALT + F11 to open the VBA Editor.
- Go to Insert ➤ Module to create a new module.
- Insert the following code in the newly opened module:
Sub Changing_Plot_Area_Size()

  If Not ActiveChart Is Nothing Then
    ChangingPlotAreaSize ActiveChart, True

  ElseIf TypeName(Selection) = "DrawingObjects" Then
    Dim zshp As Shape
    For Each zshp In Selection.ShapeRange
      If zshp.HasChart Then
        ChangingPlotAreaSize zshp.Chart
      End If
    Next

  Else
    MsgBox "No Chart selected. Please select at least one.", vbExclamation, "Warning!"
  End If

End Sub

Function ChangingPlotAreaSize(xChart As Chart, Optional xEqualMajorUnit As Boolean = False)

  With xChart
    With .PlotArea
      Dim plotInHt1 As Double, plotInWd1 As Double
      plotInHt1 = .InsideHeight
      plotInWd1 = .InsideWidth
    End With

    With .Axes(xlValue)
      Dim Ymax1 As Double, Ymin1 As Double, Ymaj1 As Double
      Ymax1 = .MaximumScale
      Ymin1 = .MinimumScale
      Ymaj1 = .MajorUnit
      .MaximumScaleIsAuto = False
      .MinimumScaleIsAuto = False
      .MajorUnitIsAuto = False
    End With

    With .Axes(xlCategory)
      Dim Xmax1 As Double, Xmin1 As Double, Xmaj1 As Double
      Xmax1 = .MaximumScale
      Xmin1 = .MinimumScale
      Xmaj1 = .MajorUnit
      .MaximumScaleIsAuto = False
      .MinimumScaleIsAuto = False
      .MajorUnitIsAuto = False
    End With

    If xEqualMajorUnit Then
      Xmaj1 = WorksheetFunction.Min(Xmaj1, Ymaj1)
      Ymaj1 = Xmaj1
      .Axes(xlCategory).MajorUnit = Xmaj1
      .Axes(xlValue).MajorUnit = Ymaj1
    End If

    Dim Ytic1 As Double, Xtic1 As Double
    Ytic1 = plotInHt1 * Ymaj1 / (Ymax1 - Ymin1)
    Xtic1 = plotInWd1 * Xmaj1 / (Xmax1 - Xmin1)

    If Xtic1 < Ytic1 Then
      .PlotArea.InsideHeight = .PlotArea.InsideHeight * Xtic1 / Ytic1
      .PlotArea.Top = .PlotArea.Top + _
        (.ChartArea.Height - .PlotArea.Height - .PlotArea.Top) / 2
    Else
      .PlotArea.InsideWidth = .PlotArea.InsideWidth * Ytic1 / Xtic1
      .PlotArea.Left = .PlotArea.Left + _
        (.ChartArea.Width - .PlotArea.Width - .PlotArea.Left) / 2
    End If
  End With

End Function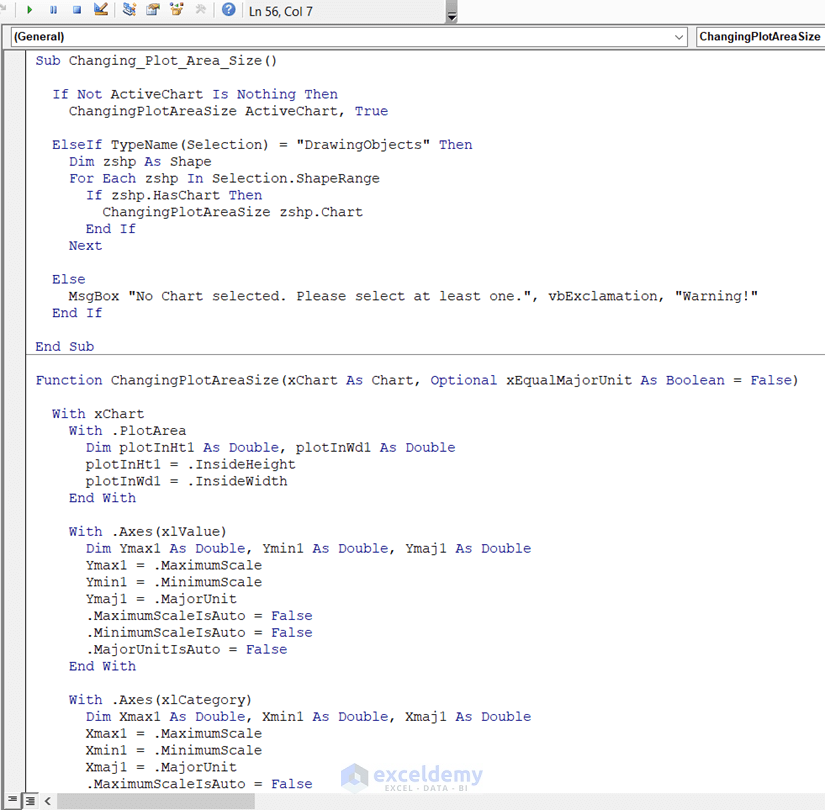
- Go back to your worksheet and click on your Excel graph to select it.
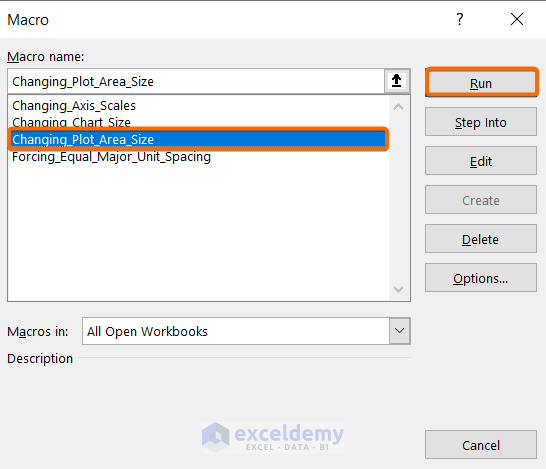
- Press ALT + F5 to open the Macro window.
- Select the macro Changing_Plot_Area_Size and hit the Run button.
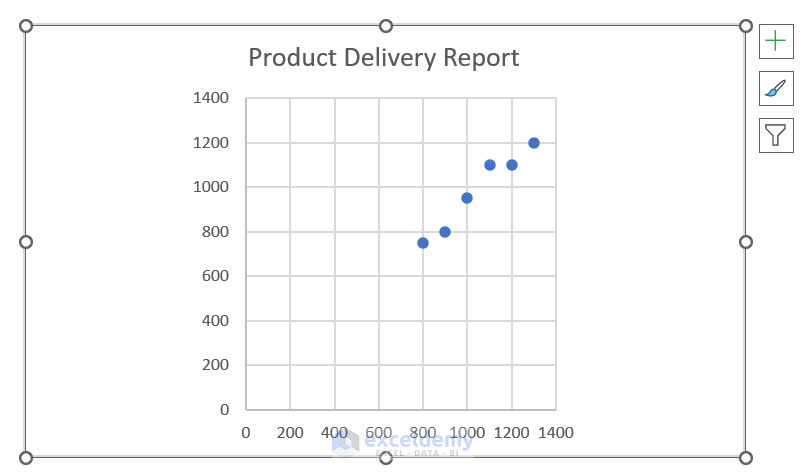
The VBA code will run. The code will make your rectangular grid lines square, just like the picture below:
Method 4 – Changing Chart Size to Make Square Grid Lines
Steps:
- Press ALT + F11 to open the VBA Editor.
- Go to Insert ➤ Module to create a new module.
- Insert the following code in the newly opened module:
Sub Changing_Chart_Size()

  If Not ActiveChart Is Nothing Then
    ChangingChartSize ActiveChart, True, True

  ElseIf TypeName(Selection) = "DrawingObjects" Then
    Dim zshp As Shape
    For Each zshp In Selection.ShapeRange
      If zshp.HasChart Then
        ChangingChartSize zshp.Chart, True, True
      End If
    Next

  Else
    MsgBox "No Chart selected. Please select at least one.", vbExclamation, "Warning!"
  End If

End Sub

Function ChangingChartSize(xChart As Chart, xShrinkChart As Boolean, _
    Optional xEqualMajorUnit As Boolean = False)

  With xChart
    With .PlotArea
      Dim plotInHt1 As Double, plotInWd1 As Double
      plotInHt1 = .InsideHeight
      plotInWd1 = .InsideWidth
    End With

    With .Axes(xlValue)
      Dim Ymax1 As Double, Ymin1 As Double, Ymaj1 As Double
      Ymax1 = .MaximumScale
      Ymin1 = .MinimumScale
      Ymaj1 = .MajorUnit
      .MaximumScaleIsAuto = False
      .MinimumScaleIsAuto = False
      .MajorUnitIsAuto = False
    End With

    With .Axes(xlCategory)
      Dim Xmax1 As Double, Xmin1 As Double, Xmaj1 As Double
      Xmax1 = .MaximumScale
      Xmin1 = .MinimumScale
      Xmaj1 = .MajorUnit
      .MaximumScaleIsAuto = False
      .MinimumScaleIsAuto = False
      .MajorUnitIsAuto = False
    End With

    If xEqualMajorUnit Then
      Xmaj1 = WorksheetFunction.Min(Xmaj1, Ymaj1)
      Ymaj1 = Xmaj1
      .Axes(xlCategory).MajorUnit = Xmaj1
      .Axes(xlValue).MajorUnit = Ymaj1
    End If

    Dim Ytic1 As Double, Xtic1 As Double
    Ytic1 = plotInHt1 * Ymaj1 / (Ymax1 - Ymin1)
    Xtic1 = plotInWd1 * Xmaj1 / (Xmax1 - Xmin1)

    If xShrinkChart Then
      If Xtic1 < Ytic1 Then
        .Parent.Height = .Parent.Height - .PlotArea.InsideHeight * (1 - Xtic1 / Ytic1)
      Else
        .Parent.Width = .Parent.Width - .PlotArea.InsideWidth * (1 - Ytic1 / Xtic1)
      End If

    Else
      If Xtic1 < Ytic1 Then
        .PlotArea.InsideHeight = .PlotArea.InsideHeight * Xtic1 / Ytic1
        .PlotArea.Top = .PlotArea.Top + _
          (.ChartArea.Height - .PlotArea.Height - .PlotArea.Top) / 2
      Else
        .PlotArea.InsideWidth = .PlotArea.InsideWidth * Ytic1 / Xtic1
        .PlotArea.Left = .PlotArea.Left + _
          (.ChartArea.Width - .PlotArea.Width - .PlotArea.Left) / 2
      End If
    End If
  End With

End Function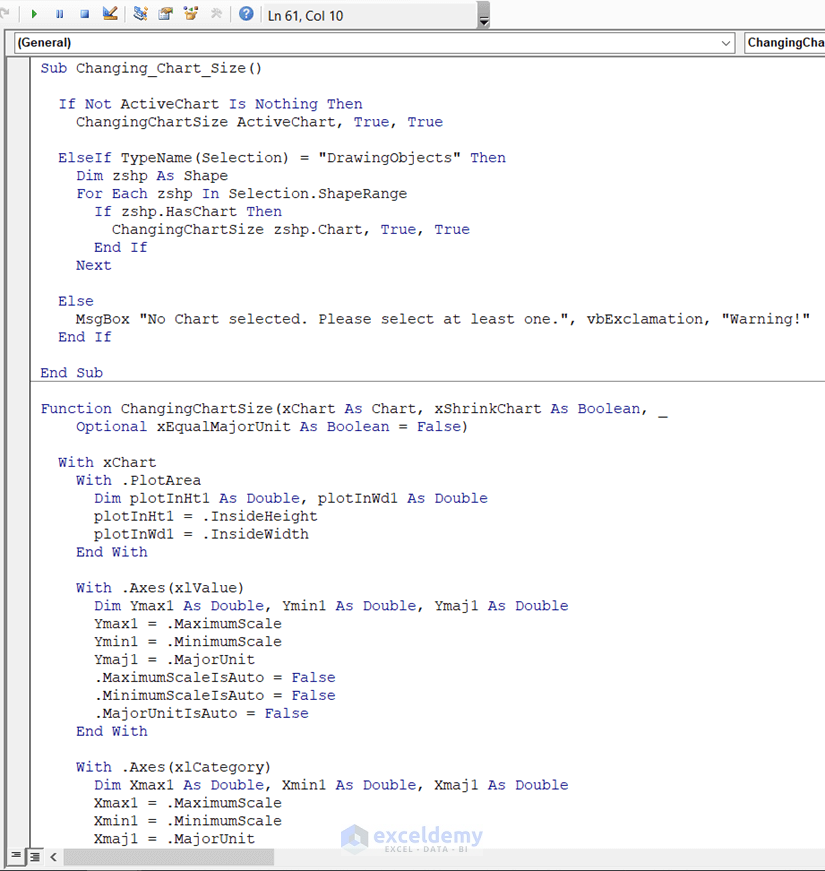
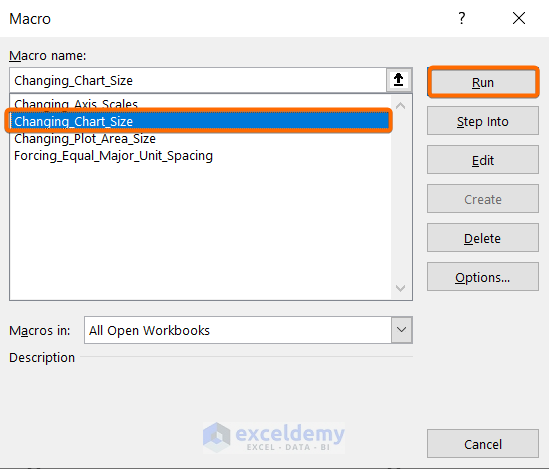
- Go back to your worksheet and click on your Excel graph to select it.
- Press ALT + F5 to open the Macro window.
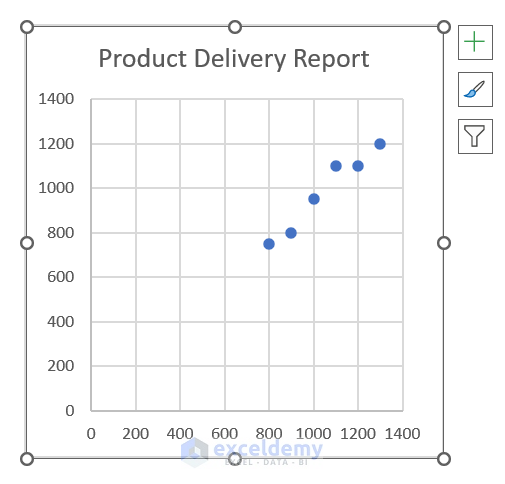
- Select the macro Changing_Chart_Size and hit the Run button.
The VBA code will run. The code will make your rectangular grid lines square, just like the picture below:
Things to Remember
- All 4 codes given in this article can perfectly make square grid lines when the values of both the X and Y axes are close to each other.
- If the value of both X & Y axes differs much, then set manual values instead of using the MaximumScale & MinimumScale properties. Otherwise, the final result will be unusable.
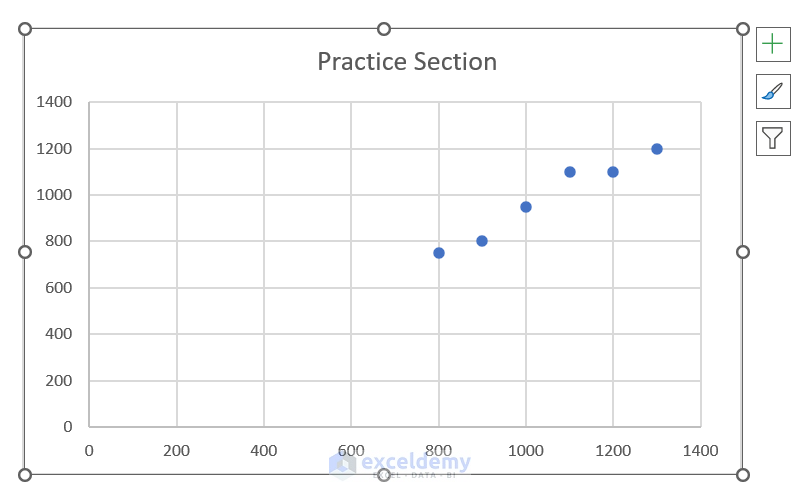
Practice Section
At the end of the provided Excel file, you will get an Excel sheet like the following screenshot, where you can practice all the topics discussed in this article.
Download the Practice Workbook
You can download the Excel file from the following link and practice.
Related Articles
- How to Add Primary Major Horizontal Gridlines in Excel
- How to Add Primary Major Vertical Gridlines in Excel
- How to Add Gridlines to a Graph in Excel
- How to Add Vertical Gridlines to Excel Chart
- How to Adjust Chart Gridlines Spacing in Excel
- How to Remove Gridlines in Excel Graph
<< Go Back To Gridlines in Excel Chart | Excel Chart Elements | Excel Charts | Learn Excel
Get FREE Advanced Excel Exercises with Solutions!

Will this work with Microsoft office non commercial use 2010. When I try your instructions the layout looks different. I managed to
Thanks for some help if yo have time.
Hello RAY,
Can you please elaborate what problems you are facing? And the problems in getting the output using these methods? I mean, the output scenario needs to be known and analyze properly to make a solution of your problem.
Thanks with Regards,
Towhid
Excel and VBA Content Developer