What Are Major Gridlines?
Major gridlines divide the chart axis into major units. Major gridlines are vertical or horizontal lines that represent the axis values. This is particularly helpful if the chart is large and we want to see elevations or which particular parameter any point belongs to.
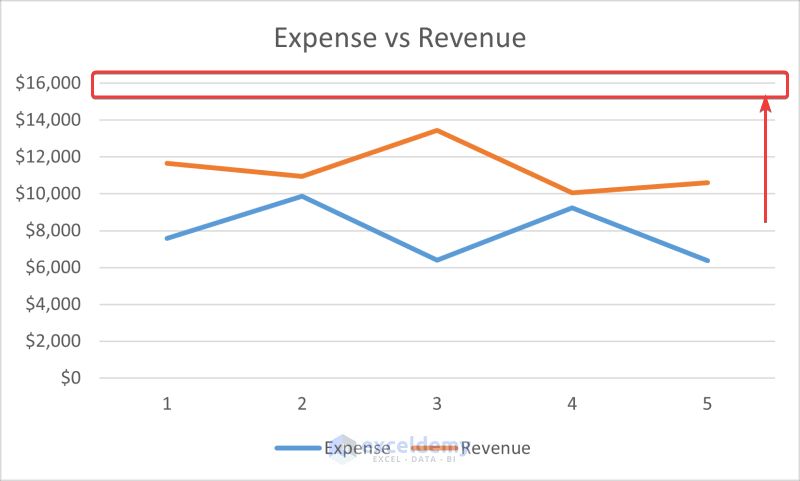
Consider the following figure. These are horizontal major gridlines that indicate every $2,000 value on the chart.
An axis can be of two types, category axis and value axis. For the category axis, the major gridlines are the only gridlines that are available. For the value axis, minor gridlines can also coexist with major gridlines.
How to Add Primary Major Vertical Gridlines in Excel: 2 Easy Ways
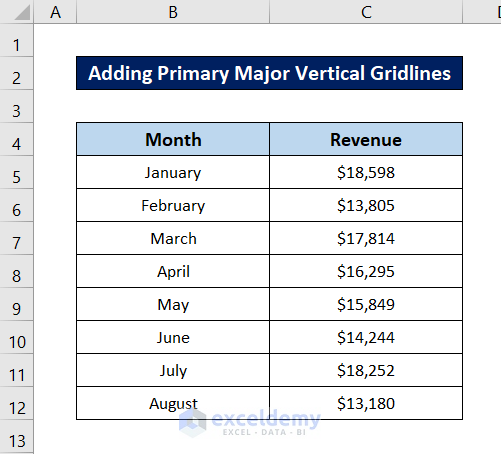
We will use the following dataset.
Method 1 – Adding the Major Vertical Gridlines from the Charts Layout Group
Steps to Plot Chart:
- Select the whole dataset (the range B4:C12).
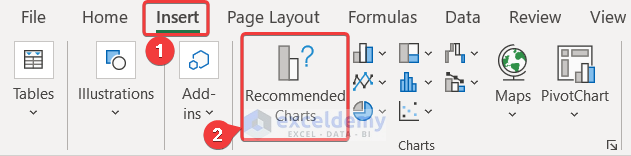
- Go to the Insert tab and select Recommended Charts from the Charts group.
- The Insert Chart box will open.
- Select your preferred chart. We are opting for a Clustered Column for the demonstration.
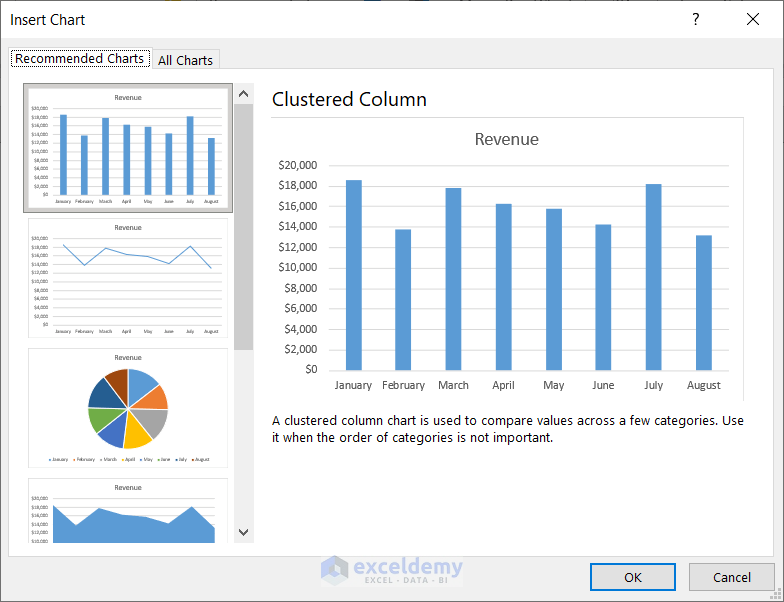
- Click on OK. You will get the chart.
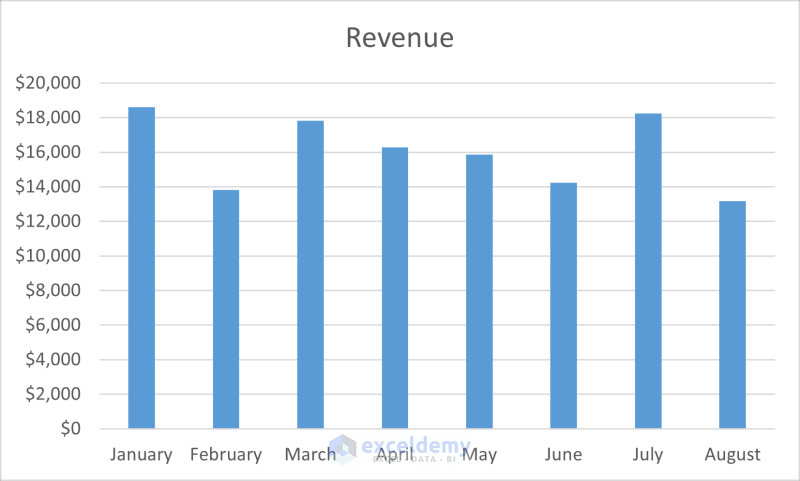
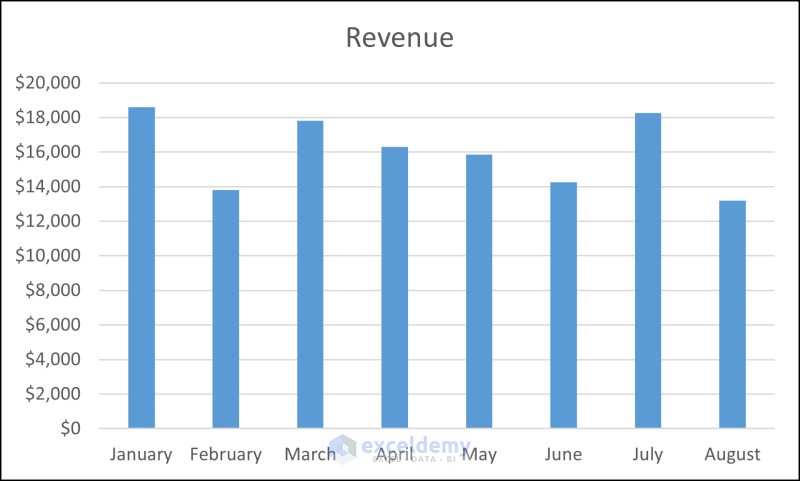
The primary major vertical gridlines aren’t available by default in the chart.
Steps to Add Primary Major Vertical Gridlines:
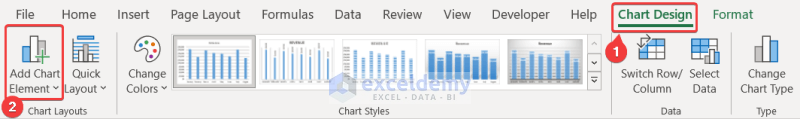
- Click once on the chart to select it. Two new tabs called Chart Design and Format will appear on the ribbon.
- Go to the Chart Design tab.
- Select Add Chart Elements from the Chart Layouts group.
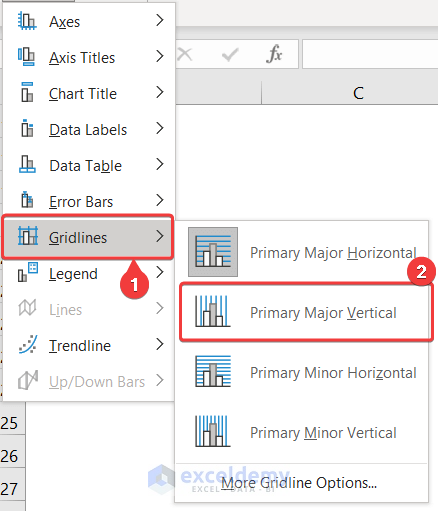
- A drop-down menu will appear. Select Gridlines from it first.
- Select Primary Major Vertical.
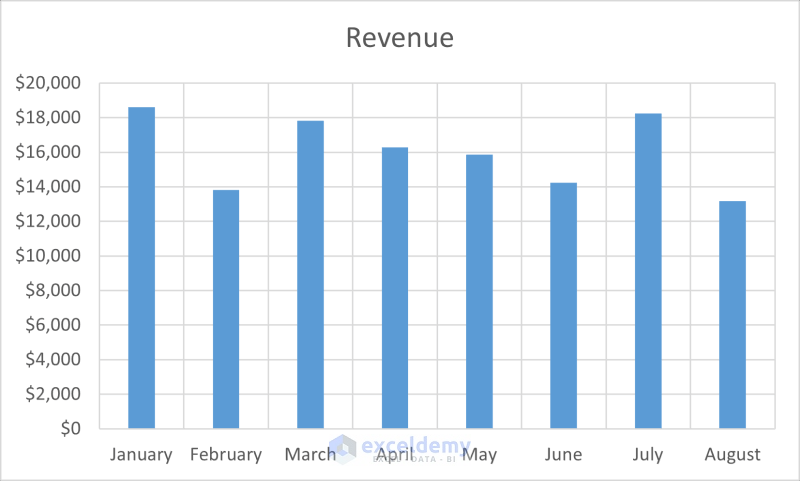
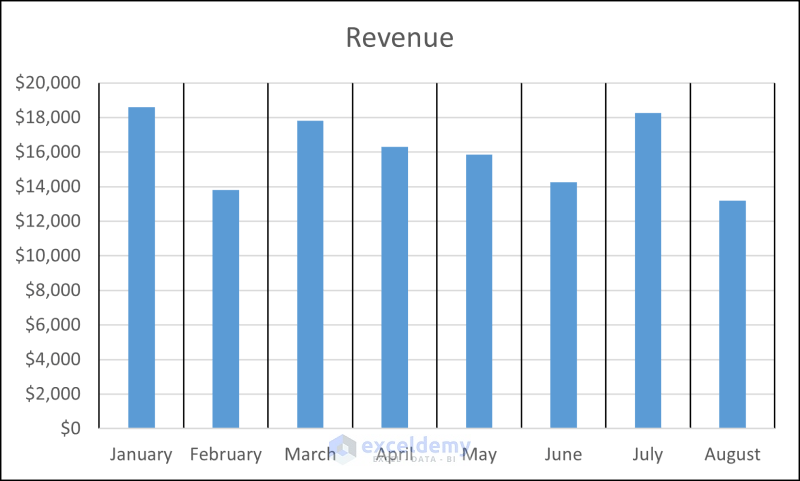
The primary major vertical gridlines will appear on the chart within the Excel spreadsheet.
Read More: How to Add Primary Major Horizontal Gridlines in Excel
Method 2 – Using Chart Elements
Steps to Plot Chart:
- Select the whole dataset (the range B4:C12).
- Go to the Insert tab and select Recommended Charts from the Charts group.
- The Insert Chart box will open up.
- Select your preferred chart. We are opting for a Clustered Column for the demonstration.
- Click on OK.
The primary major vertical gridlines are missing here.
Steps to Add Primary Major Vertical Gridlines:
- Select the chart by clicking on it once. Three options will appear on the right of the chart: Chart Elements, Chart Styles, and Chart Filters.
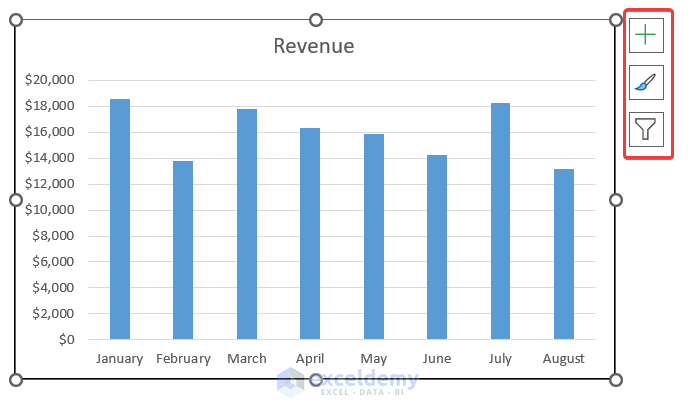
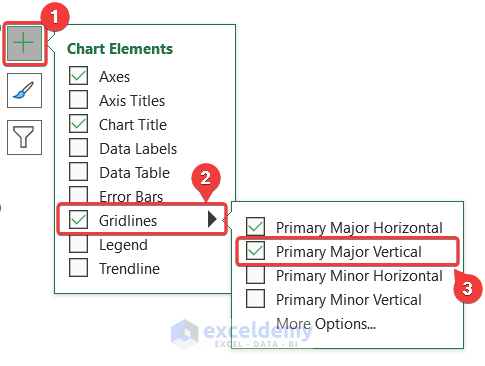
- Select Chart Elements.
- Click on the arrow for Gridlines from the options.
- Select Primary Major Vertical.
This will add primary major vertical gridlines in the Excel chart too.
How to Format Major Vertical Gridlines in Excel
Steps:
- Double-click on the primary major gridline.
- The Format Major Gridlines window will appear on the right side of the Excel spreadsheet.
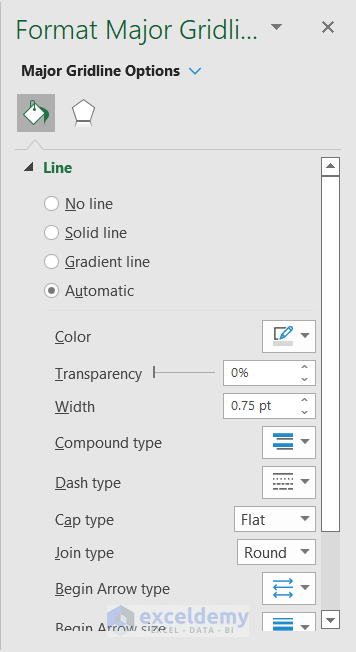
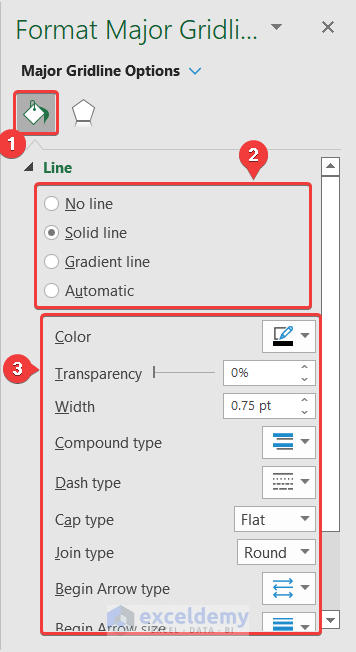
- Go to the Fill & Line tab on the window.
- Under the Line section, you can now select the type of line you want for your primary major vertical gridlines (marked as 2 in the figure).
- You can also select the color and line design from the options below (marked as 3 in the figure).
After choosing a solid line and the color black for our chart, the chart looks something like this.
Read More: How to Add Vertical Gridlines to Excel Chart
How to Remove Vertical Gridlines in Excel
Steps:
- Select the vertical gridlines you want to remove by clicking on any of them.
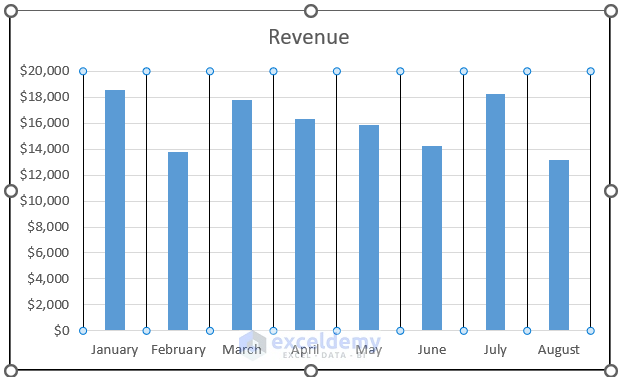
- Press Delete on your keyboard to remove them from the chart.
Download the Practice Workbook
Related Articles
- How to Add Gridlines to a Graph in Excel
- How to Adjust Chart Gridlines Spacing in Excel
- How to Make Square Grid Lines in Excel Graph
- How to Adjust Gridlines in Excel Chart
- How to Remove Gridlines in Excel Graph
<< Go Back To Gridlines in Excel Chart | Excel Chart Elements | Excel Charts | Learn Excel
Get FREE Advanced Excel Exercises with Solutions!
